The importance of this scientific research is that it elucidates the main causal relationships either behind the observation of an event - in the present context an example of successful revolutions - or their absence. It is the most diverse, multi-confessional and pluralistic country in the Arab and Middle Eastern region.
NEW DETERMINANTS OF SUCCESSFUL REVOLUTIONS
Introduction
Literature review
- Determinants of revolutions
- Arab uprisings and new determinants of revolutions
In the short term, higher income growth reduces the likelihood of both successful and attempted revolutions. According to Sika (2012, p.8), “the structural adjustment policies proposed by the World Bank and the IMF did not take into account the dynamics of authoritarianism in the region”.
Empirical model and data
- Variables and data sources
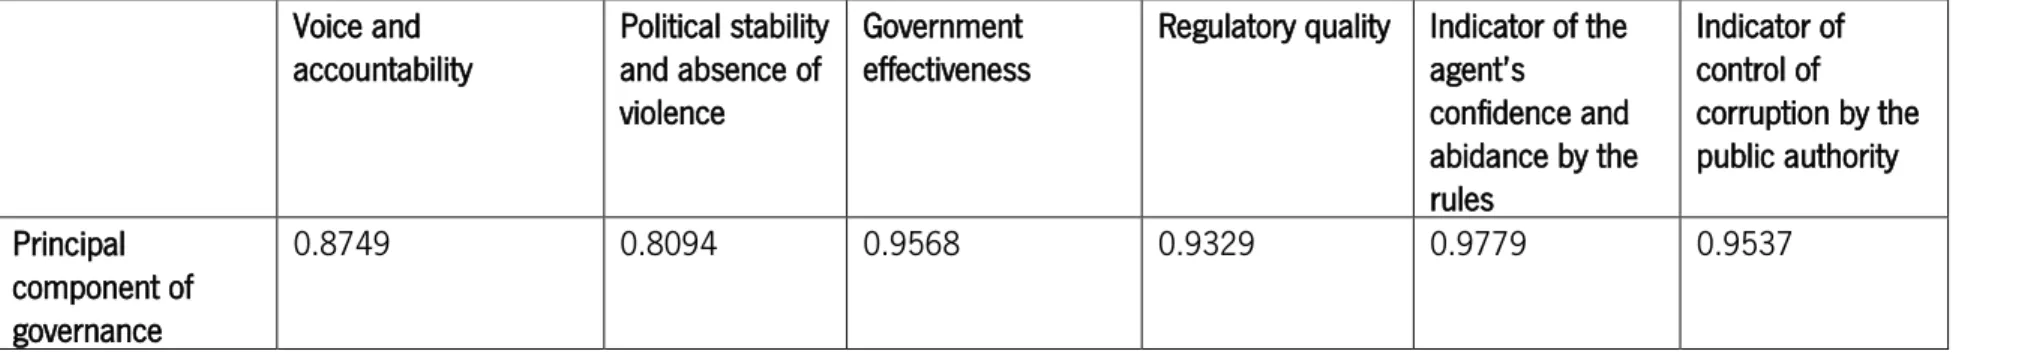
GDP inflation and unemployment are taken from the World Bank's Global Development Indicators (World Bank, 2018). These indicators are drawn from the World Bank's Global Governance Indicators (World Bank, 2017b), and all range from approximately -2.5 (weak performance) to 2.5 (strong governance performance).
Methodology
Empirical results
- Globalization effect
- Robustness checks
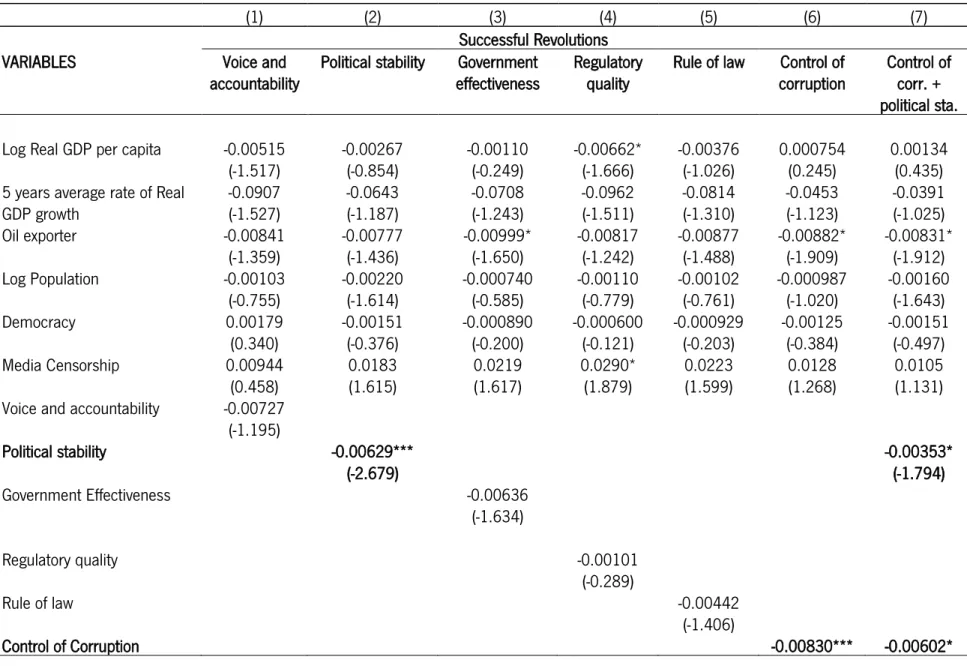
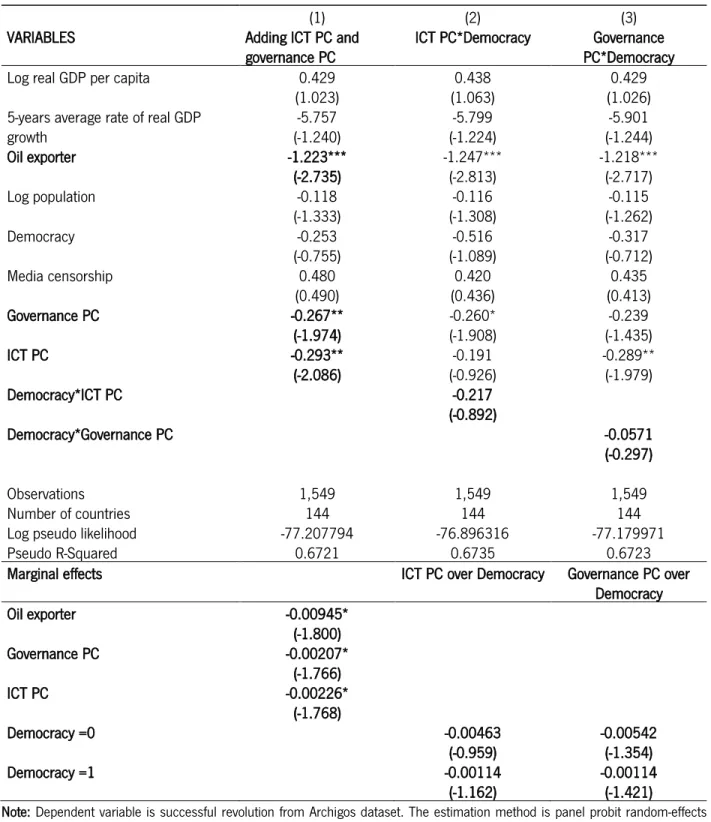
The analysis of the marginal effects shows that a one-unit increase in logreal GDP per capita reduces the probability of successful revolutions by 0.840 percentage point. However, the analysis of the marginal effects shows that KOF indicators do not have a statistically significant influence on the probability of successful revolutions.

Revolutions in the Arab countries
The marginal effects of the interaction terms are listed at the bottom of the table. The table lists only the marginal effects of the following variables: column (1) Arab youth unemployment; column (2) HDI; column (3) inflation; column (4) Governance PC; column (5) neighboring countries with violence; column (6) primary education; and column (7) ICT PC.
Other forms of violent events
Increases in population size are associated with a higher likelihood of demonstrations and riots. Regarding the demonstrations and riots, the analysis of the results in column 2 suggests that increases in the 5-year average growth rate of real GDP decrease the likelihood of demonstrations and riots. The dependent variable in column (4) is binary variable revolutionary war, in column (6) civil violence and column (8) successful coup d'état.
The dependent variable in column (3) is the binary variable revolutionary war, in column (5) civil violence, and in column (7) successful coups.
Conclusion
Only recently, with the outbreak of the Arab Spring, has research begun to focus on the importance of governance and the development of media and communication technologies in explaining the onset of revolutions. Our baseline model was robust in explaining the successful revolutions that occurred in our sample during this period, but this was not the case when we restricted our analysis to Arab countries. In this paper, we have re-evaluated the triggers that we have previously proposed to explain the causality of successful revolutions – mainly income level, population size, oil and the conditional effect that democracy can have on the probability of successful revolutions.
The main limitation of this study is related to the time frame considered for our analysis, which reduced the number of successful revolutions.
VOTING IN A MUTLI-CONFESSIONAL MULTI-PARTY SYSTEM: THE POWER OF
Introduction
With more than 18 religious sects and more than 30 political parties, we ask whether religion is the main determinant of Lebanese voters' choice. In this paper, we present a quantitative analysis, based on econometric estimates, of the factors that support the choice of Lebanese voters in parliamentary elections. The paper is organized as follows: Section 2.2 reviews the literature on voting and popularity functions.
Literature review
Other factors, such as party identification (Campbell et al., 1960), explain support for parties during some elections (Sanders, 2003). Party identification, or partisanship, refers to the psychological attachment to a party that enables citizens to define themselves and others in the political landscape (Campbell et al., 1986). Another view of party identification (Green et al., 2002) posits a close relationship between parties and social identities (social class, ethnicity, race and religion).
The impact of partisanship on elections, especially in the American context, was always relevant (Campbell et al., 1960).
Overview of the political and electoral systems in Lebanon
- Political system
- Electoral laws and elections
- Electoral laws
- Elections
These included the transfer of presidential powers to the council of ministers and the expansion of the number of seats in parliament from 99 to 108, divided equally between Christians and Muslims (Hudson, 1999). Members of the Chamber of Deputies are elected according to the electoral law in force. Seats are won by whichever candidate from that denomination wins the plurality (ie, the largest number) of votes cast.
In Beirut, the nomination of candidates and the vote followed the level of Muhafaza as an electoral district.

Empirical model
Meanwhile, the fallout from the Syrian conflict began to spill over onto the Lebanese scene. At the end of 2014, the term of office of the President of the Republic, Michel Suleiman, ended. The right-hand side of the equation includes vectors of explanatory variables associated with political, socio-economic and religious variables.
Data on political parties in office come from the Lebanese presidency of the Council of Ministers — see Appendix B 10 for political parties in office during election years.
Empirical results
- Amal Movement
- Hezbollah
- Future Movement
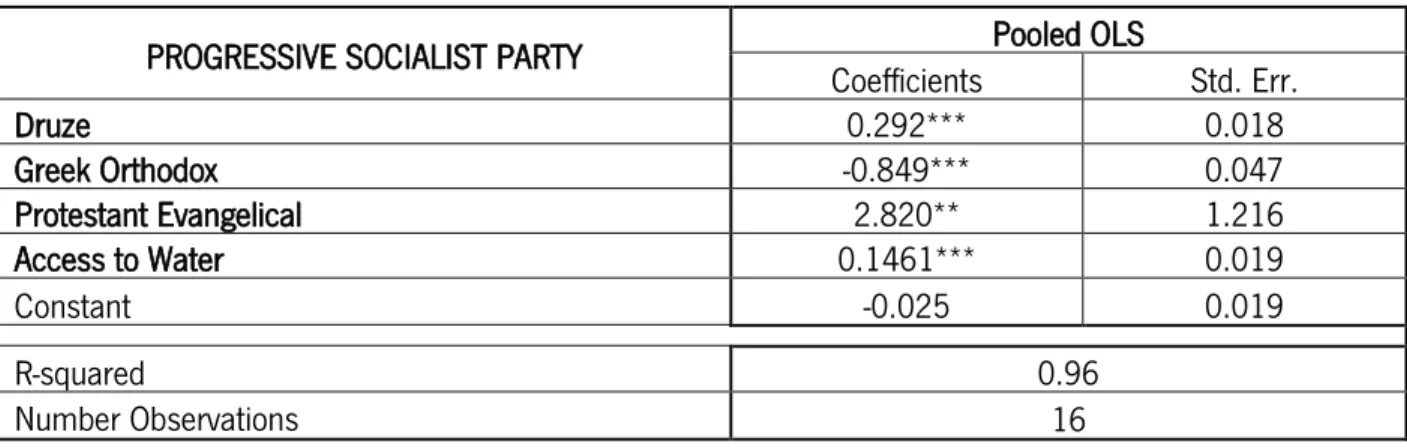
- Progressive Socialist Party
- Lebanese Communist Party
- Syrian Social Nationalist Party
- Independents of March 14 coalition
- Independents
However, both Alawites and Armenian Catholics represent very small fractions of the electorate. They are more likely to capture some of the cultural effect of the religious makeup of each district. SSNP is a secular party whose members are present in different geographical areas of the country.
In Table 25, we can see that, as with other parties, the SSNP's vote share depends mostly on the religious composition of the district.
Conclusion
Religious variables, namely the percentage of voters belonging to specific religious sects, are particularly relevant to explain the vote shares of the Amal movement, the Hezbollah, the Progressive Socialist Party and the Independents of the March 14 coalition. Since it is associated with the Shia, it was not surprising to find that the vote share of the Amal movement is positively and mostly associated with the percentage of voters belonging to the Muslim Shia sect. A greater proportion of voters belonging to the Muslim Druze sect positively influences the vote shares of the Progressive Socialist Party and the Independents of March 14 coalition.
The economy also plays a role in the Syrian Social Nationalist Party's vote share, with higher unemployment associated with lower vote share.
VOTER TURNOUT AT THE LEBANESE PARLIAMENTARY ELECTIONS
Introduction
Lebanon is one of the few democracies in the Middle East where political organizations with sectarian orientations play a crucial role in meeting the basic needs of the population (Cammett & Issar, 2010), competing to mobilize as many of the electorate to the polls as possible. . The paper is organized as follows: Section 3.2 reviews the literature on turnout; Section 3.3 briefly presents the Lebanese framework; Section 3.4 discusses the empirical model and defines the data.
Literature review
In the same vein, Verba et al. 2004) and Blais and Galais (2016) suggest that civic duty is the essential motivation for voting. Most empirical literature found a positive effect on the probability of voters participating in elections as a result of these three variables. The impact of proximity on voter turnout goes back to the assumption of instrumental behavior defined by Downs (1957), where a closer election is expected to increase participation as each vote can have a decisive influence on output .
Proportional systems are believed to increase the likelihood that voters will go to the polls believing their vote can make a difference.
The Lebanese setting
- Institutional framework
- Turnout from 1992-2018
The electoral system used during the first five parliamentary elections that took place after the end of the civil war and 2009 was a plurality system (First-Past-The-Post FPTP). The threshold is counted again after excluding the total number of votes from the disqualified lists. The turnout in Beirut was low mainly because the results were known well before election day.
No one doubted that the electoral list led by the late Prime Minister Rafik Hariri's son would win all the seats in the district.
Data and model specification
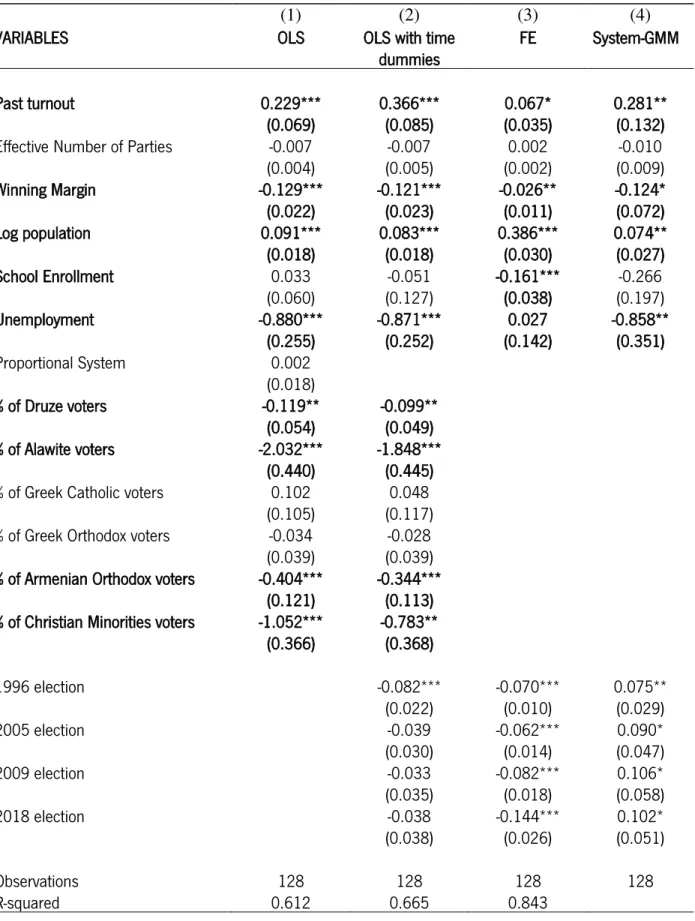
It is expected to be positively related to the current turnout rate (Cancela & Geys, 2016). b) Effective number of parties: is "the number of hypothetical equal-sized parties that would have the same total effect on the fractionation of the system as the actual unequal-sized parties" (Laakso & Taagepera, 1979: p.4) . An increase in the effective number of parties is expected to go hand in hand with a higher attendance percentage (Geys, 2006a). The squared log number of voters will also be used to test the existence of a non-linear relationship with turnout (Juel et al., 2014). b) School enrollment rate: is the school enrollment rate in district d during election year t and is expected to be positively correlated with voter turnout.
Data for the number of registered voters are extracted from the Ministry of the Interior and Municipalities and the Lebanese Center for Political Studies.
Empirical results
- Robustness checks
Analysis of the results in column 4 suggests that voters become accustomed to past voter turnout (the lagged dependent variable) being statistically significant and with a positive sign. In the rest of this chapter, we will refer to the model estimated in column 4 as the main model, and the system GMM as the main estimation strategy. In the 1st column, we add the quadratic term of unemployment, and in the 2nd column, the quadratic term of the logarithmic population.
Similar results to those of the system GMM baseline model were obtained in terms of statistically significant covariates.
Religious fragmentation
First, we calculated the religious fragmentation by referring to equation 5 and replacing the fraction of votes from party i with the fraction of the number of voters belonging to confession i (ri). This variable was added to the main model (column 4 Table 31) and the results are reported in column 1 of Table 34. Second, we added the share of Christian voters as a percentage of total voters to the main model.
A similar analysis was conducted with the percentage of Muslim voters and similar results were obtained.

Conclusion
In the 2005 Lebanese Parliamentary Elections Amidst Local and Regional Transformations (Arabic) (First). In Assafir & Koutoub (Eds.), Parliamentary Elections of Lebanon 2009 By Constituencies, Incumbents and Religions (Arabic) (First, p. (Arabic) (First, p.
In 2005 Lebanese Parliamentary Elections Amidst Local and Regional Transformations (Arabic) (First, pp. 183–224). We replace democracy in the baseline model with Polity 2 score in column (1) and DD in column (3). Oil exporter is replaced by % of fuel exports in the base model (column 1) and in model 3 (column 3).