The results are compared with those obtained without the use of the wake expansion and discussed in light of the results and conclusions of previous contributors to the lifting line code. This further translates into more reliable values of the power coefficient predicted by the wind turbine load design optimization with the lift line model. 𝑉 The magnitude of the projection of the total velocity vector on the blade cross-section 𝑣⃗𝑘 Velocity induced by the kth lift line and its sheet of trailing vortices.
1 Introduction
State of the art
This allowed the modeling of the sprues with variable geometry by aligning them with the local velocities at various axial stations - the examples of which can be found in the works of Kinnas [14], Aran [15] and Diniz [16] ]. For example, the introduction of a variational approach - an alternative to the classical optimization, by authors such as Yim [17] and Kerwin [10] or a more modern contributor Epps, who with the use of his open source software OpenProp [18] [19 ] investigated new wake models [ 20 ] and a lift line/momentum theory hybrid approach [ 21 ]. Much credit is also due to the research group led by Falcao de Campos and Baltazar who actively contributed to the lifting line theory.
Objectives
A lifting line code developed by them was implemented by Duarte [22] [23] in 1997 and is still being improved to this date. Last but not least, in 2016 Melo [27] [28] continued Caldeira's analysis of wind turbines and included a wake adjustment scheme, and Sousa [29] made the optimization procedure by adjusting the analysis code of Melo and implementing the Lagrange multiplier method.
Thesis outline
2 Theory
- Introduction to the lifting line theory
- System of vortices
- Forces, angles and coefficients
- Modeling of wake expansion
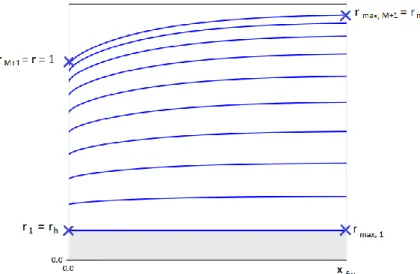
L – lift per span, is the component of the resultant force perpendicular to the inflow velocity vector 𝑉⃗⃗,. To define the radius of the fully extended wake, we will use the actuator disc theory. The non-dimensional radius of the extended wake will change along the axial coordinate from 1 to 𝑟𝑚𝑎𝑥∗ according to the expression:.
![Figure 2.1: Considered coordinate systems and uniform inflow velocity fields (from [27]) Now, let us recall that in the lifting line theory, the lifting body is modelled as a bound vortex called a lifting line](https://thumb-eu.123doks.com/thumbv2/123dok_br/19768650.0/17.892.289.602.521.851/figure-considered-coordinate-systems-uniform-velocity-lifting-modelled.webp)
3 Numerical model
- Discretization
- Induced velocities
- Hub model
- Optimization
- Computational procedure
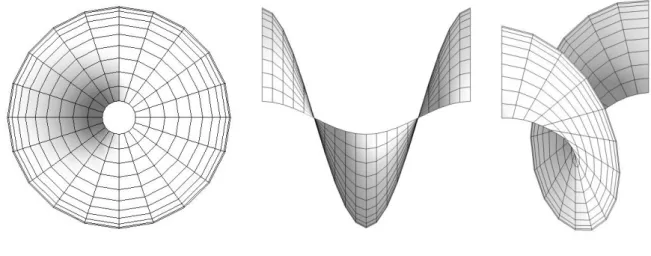
In this way we obtain the mesh of the coil geometry, as in Figure 3.2, in which nodes are the endpoints of the rear vortex segments. Similarly, coordinates of the extended radial coordinates are updated at the end of each iteration when new wakes are calculated. Moreover, the further we move from the hub radius, the more evident is the expansion of the trailing vortices.
Having discussed all aspects of turbine rotor modeling, we can now focus on the essential part of the calculation procedure - optimization. In this section we will analyze the computational procedure of the algorithm of the aerodynamic design problem coded in the FORTRAN language. Note that the code still allows calculations to be performed without the wake extension and broadening, using a simplified version of the algorithm shown below.
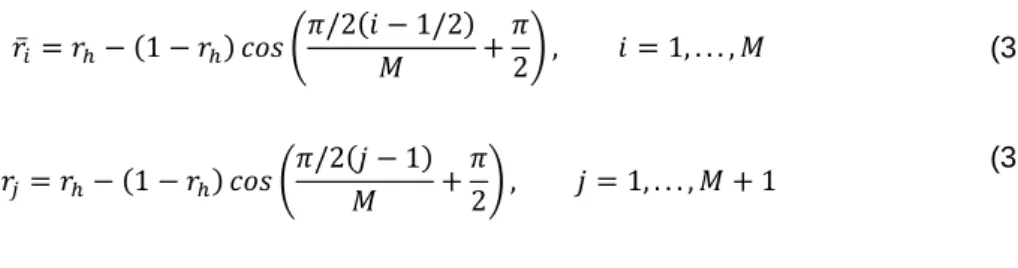
The guard expansion formulas discussed in Section 3.1 are implemented in two places of the algorithm. The number of alignment sections and their axial coordinates are defined in the input file. Next, the axial and angular coordinates of the new coil are calculated using Equation 3.4 and Equation 3.5.
It is important to note that the axial length of the track is defined as an input parameter 𝑥𝑢𝑤/𝑅 and remains constant during the entire process. It is worth noting that the FORTRAN code allows calculations to be performed without the use of alignment and wake expansion. In such a simplified case, we can use an analytical approach to calculate the influence coefficient matrices, as already explained in section 3.2, and skip the wake alignment loop (using only a simplified initial wake geometry and assuming spiral filaments of trailing vortices).
4 Results
Convergence analysis
- Lifting line discretization
- Wake discretization
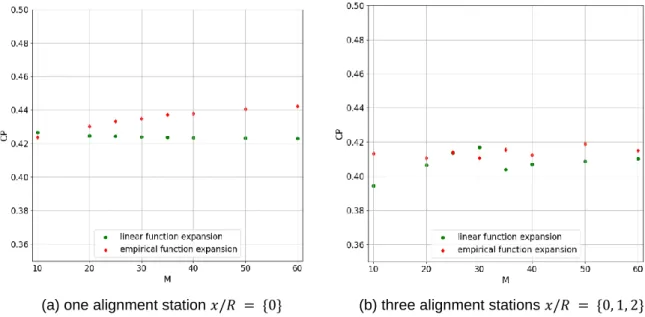
In this section, the influence of the number of lifting line segments 𝑀 on the computational model was investigated. Focusing on figure 4.1a (one line guidance station), we see that in the case of linear expansion the influence of the number of lifting line segments on the power coefficient is negligible, while in the case of the empirical function 2.34 we can note that 𝐶𝑃 is slightly increasing with the increase of 𝑀. However, since this value does not converge but gradually increases, we can interpret this as a numerical problem, not the real influence of the number of lifting line segments.
Here too, as in the case of an adjustment station, the power coefficient does not seem to converge to a certain value, indicating that we are dealing with numerical uncertainties, not the influence of the tested parameter. Moreover, when we compare Figure 4.1a and Figure 4.1b, we can notice that the values of the power coefficient in the case of three wake adjustment stations are lower than in the case of the wake directed only at the lifting line (this will also be mentioned in Section 4.2.1). In this section, we tested how wake discretization affects the overall convergence of the solution.
Tests were performed using the linear expansion method, the track aligned on the rise line, and all combinations of the previously mentioned discretization parameters. Analyzing Figure 4.1, we can see that increasing the number of current sections per turn from 𝑁𝑡 = 10 to 𝑁𝑡 = 100 results in a significant increase in the value of the power coefficient. When we focus on the second parameter – the axial trace length 𝑥𝑢𝑤/𝑅, we can see that the value of the power coefficient decreases slightly as it increases.
It is worth mentioning that the difference between the power coefficient value becomes negligible when we go from 𝑥𝑢𝑤/𝑅 = 25 to 𝑥𝑢𝑤/𝑅 = 50.
Transition wake parameters
- Number and position of the alignment stations
- Maximum radius of expansion
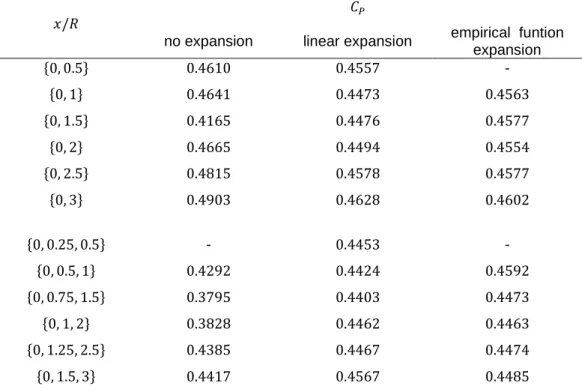
The performance of the individual cases was assessed against two criteria: the value of the drift coefficient and the shape of the guard geometry. Let us first focus on 𝐶𝑃 which values for different configurations of the wake alignment stations are presented in Table 4.2. In the runs without the wake extension, the values of the power coefficient show great variation, from 0.3828 to 0.4903.
Moreover, when the wake broadening procedure is applied, the introduction of the intermediate stretching station contributes to a small decrease in the power coefficient. Therefore, to identify good configurations of wake stretching stations, we need to take a closer look at the wake geometries. In Figure 4.3 we present the wake geometries of selected configurations of wake stretching stations for the case without wake broadening.
Note that in all cases so far the intermediate alignment station has been placed exactly in the middle of the transition carriage. In Figure 4.7 we can see the comparison of the three expansion methods for the track aligned at the same configurations of the alignment stations, as analyzed in Figure 4.6. The circulation and induced tangential velocity distributions in the case without the coil expansion are as in the case with the effect of the expansion.
In Figure 4.9 we can notice how with the increase of the maximum radius of the expansion (from . 𝑟𝑚𝑎𝑥/𝑅 = 1.03 to 𝑟𝑚𝑎𝑥/𝑅 = 1.27) the value of the power coefficient gradually decreases.
Parametric studies
For tests using the empirical expansion function 2.34 we see an unexpected result: the value of the power coefficient decreases with increasing tip speed ratio. Here the influence of the increasing design point speed ratio is not as clear as in the case of Figure 4.10a. The reason for that may be much more complex geometry of the vortex sheet compared to the case with the track aligned only at the lift line in which each trailing vortex is a helical line.
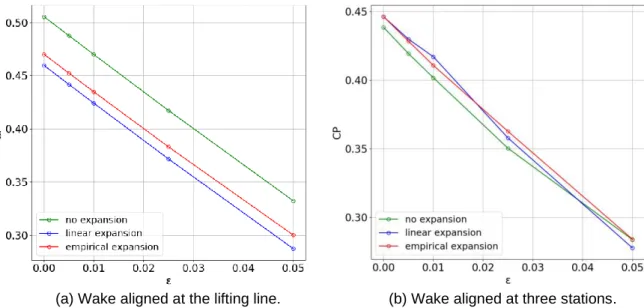
This can be further reflected in the value of the drift coefficient, which, according to Equation 3.26, depends on distributions of the circulation and induced axial velocity over the lift line. For each of three considered approaches to the wake extension, various values of the drag-to-light ratio from 𝜀 = 0 to 𝜀 = 0.05 were tested. The results of the study are presented in Figure 4.11. a) Wake in line with the lift line.
The decrease of the force coefficient is almost linear with increasing drag-to-lift ratio. However, this result was also obtained and discussed by Sousa, applying the Lerbs' analytical expressions, not the numerical approach. In Figure 4.11a we can see that the introduction of the wake expansion contributes to the decrease of the power coefficient.
On the other hand, in the case of three adjustment stations (Figure 4.11b) we observe the opposite behavior: for most of the tested values of the drag-to-lift ratio, the value of the power coefficient is higher when the expansion procedure is used.
5 Conclusions
The next test revealed that the value of the power coefficient decreases with the increase of the maximum radius of the expansion. In the tests with only one adjustment station, we could observe well-known dependence of the power coefficient on the value of the design peak speed ratio, discussed by Sousa [29]. In the case of the extension with the feature adapted from Hoshino, we are unfortunately faced with results that are inconsistent with the known research (e.g.
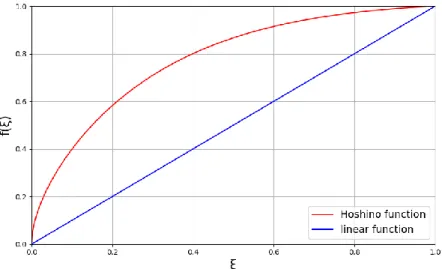
For our research, we adapted the function without introducing any adjustments that could help to improve the results of the procedure where this function is used for wake expansion. Second, the empirical function 2.34 is characterized by a very steep slope near the lifting line (see Figure 2.5). In summary, we can speculate that the more realistic form of the expansion function lies somewhere between the linear function and the function adapted from Hoshino – i.e.
Note that in this thesis we have considered only two chosen functions for defining the geometry of the transition wake expansion and the radially induced velocities have not been calculated. There is certainly a lot of room for further improvement of the lifting line code in terms of the wake expansion procedure. First, the additional detailed analysis of the possible extension functions could lead to finding methods that provide more stable and satisfactory results.
Moreover, with the development of additional features, we expect higher computational costs, which have already increased significantly, just because of the application of the wake alignment scheme.
Geometries of the wakes without the effect of the wake expansion effect of the wake expansion
Geometries of the wakes expanded with the linear function with the linear function
Geometries of the wakes expanded with the empirical function with the empirical function
![Figure 2.2: System of vortices for a single lifting line (from [27])](https://thumb-eu.123doks.com/thumbv2/123dok_br/19768650.0/18.892.303.589.391.650/figure-2-2-vortices-single-lifting-line-27.webp)
![Figure 2.3: Velocity and force triangles at a blade section (from [31])](https://thumb-eu.123doks.com/thumbv2/123dok_br/19768650.0/20.892.223.667.171.461/figure-2-velocity-force-triangles-blade-section-31.webp)
![Figure 2.4: The actuator disc extracting energy from the fluid and the stream-tube (from [32]) The axial force acting uniformly on a disc is:](https://thumb-eu.123doks.com/thumbv2/123dok_br/19768650.0/23.892.206.708.110.377/figure-actuator-extracting-energy-fluid-stream-acting-uniformly.webp)
![Figure 3.5: Two-dimensional illustration of the pair of vortices and corresponding induced velocities (from [35])](https://thumb-eu.123doks.com/thumbv2/123dok_br/19768650.0/31.892.237.656.197.469/figure-dimensional-illustration-pair-vortices-corresponding-induced-velocities.webp)
![Figure 3.6: Flowchart of the computational procedure (from [29])](https://thumb-eu.123doks.com/thumbv2/123dok_br/19768650.0/35.892.187.572.111.678/figure-3-6-flowchart-computational-procedure-29.webp)
