In the first essay, we develop a systematic analysis of the inequality literature published in economic journals since 1950. This corresponds to an analysis of the inequality-growth relationship and its transmission channels in 27 members (from 2021) of the European Union (EU) in the period 2001-2019 using a panel VAR modeling approach.
Introduction
We therefore combine a quantitative and qualitative approach to identify, characterize and contextualise the main streams of research on the inequality literature since 1950. The remainder of this article is structured as follows: Section 2.2 presents a brief overview of the debates on inequality in the 20th century. ; Section 2.3 describes the methodology used in more detail; Section 2.4 characterizes the network and each cluster; finally, Section 2.5 presents the main concluding remarks, some limitations and suggestions for further work in our study.
A brief overview of Inequality debates in the Twentieth Century
With the establishment of the National Bureau of Economic Research (NBER) in the early 1920s, inequality statistics received a significant boost. This was crucial to the emergence of human capital theory in the latter part of the decade (as in Jacob Mincer's 1957 dissertation).
Methodology
Type of Analysis
Therefore, the higher it is, the less the distance between each pair of references and the final number of clusters.2. The researcher can set the resolution parameter and thus retains some control over the final number of groups in the network.
Dataset
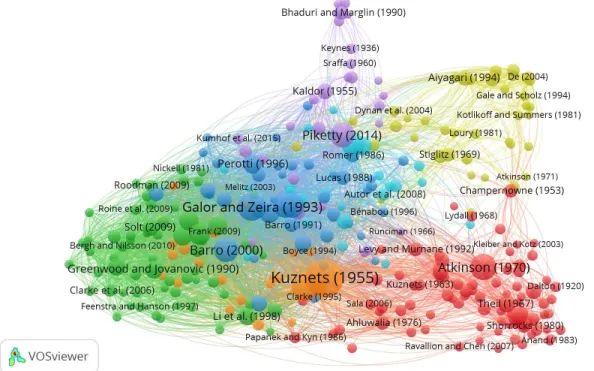
We also identified and analyzed the profile of the most influential authors, including aspects such as the journals in which they have published, their academic affiliations and their Alma Matres, and the corresponding countries. Using the VOSviewer software, we determined how often each of these references was cited in the first group of 2510 retrieved documents and, following previous surveys (e.g. Korom, 2019), retrieved a sample of the most cited references, which we considered those with at least 15 citations.
The clusters: a quantitative and a qualitative analysis
A generalized analysis of the network
The individual importance of each reference is measured by the number of citations and represented by the size of the corresponding circle. Links - The number of references that were cited together with all references of the group or network.
An individual analysis of each cluster
On the other hand, it reduced investment due to the latter's dependence on profits (Onaran & Obst, 2016). The importance of the latter also explains the presence of the University of Minnesota in the Top 5 Almae Matres and the World Bank as the most important affiliation.

Concluding Remarks
Performs an empirical analysis of the distribution of wealth over time and of the degree of inequality. Undertakes an empirical analysis of the degree of mobility in wealth distribution over time or across generations.

Review of the Literature
The focus of our analysis is on the United States and France, two of the most advanced and influential economies in the world. The authors conclude that this is the result of differences in the growth rate of the labor force, but also in labor productivity. Our approach has several substantial advantages over those existing in the literature.
Data
Description
However, we could not find a time series with observations for all years of the. In contrast, it is possible to obtain fair values of the gross subscription rate for almost all years in the analysis period. Enrollment rate Ratio between the resident population enrolled in tertiary education and the corresponding official group.

Unit Root and individual structural break tests
In almost all cases, the results of the constant version of the Kapetanios test lead to the rejection of the null hypothesis of order 1 integration, while the corresponding version of the KPSS test also fails to reject the null hypothesis of stationarity at least at the 5% significance level. The only exceptions refer to enrU S, invU S, plU S, govF R, but in all cases a more detailed analysis of the results and graphical analysis lead to the conclusion that the first differences were stationary. Finally, if we analyze the structural change tests applied to first differences in most time series, we can see that the null hypothesis of no structural change is rejected at least at 5%.
Methodology
The SVAR Model
The structural change test is a Chow test of the null hypothesis that a series has no structural breaks around a constant (sixth column) or a trend (seventh column) and follows Zeileis, Leisch, Hornik, and Kleiber (2002). The p-values are obtained by taking the corresponding test statistics from 1000 simulated random time series of the length of those under analysis in which the null hypothesis is verified. Since the off-diagonal elements of the covariance matrix Ω are not necessarily equal to 0, these impulse responses are not orthogonalized because they are based on correlated shocks.

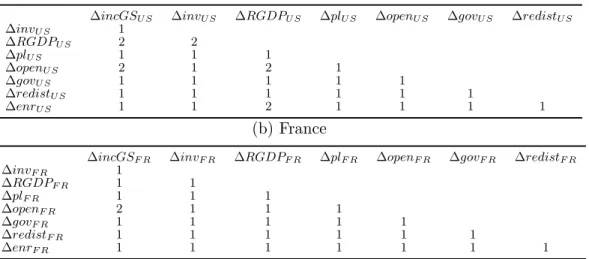
Identification
If some variables satisfy the previous condition, perform Wald tests of the null hypotheses "zj causes no other variable in the system by Granger". The aim is to consider the null hypothesis H0,G,i,jz∗ that a variable zj does not cause Granger zi in the context of the VAR model of z if this hypothesis was not rejected in the corresponding bivariate VAR model. In this case, no null constraint would be imposed, despite its relevance in the context of the bivariate model.
Bootstrap method
This is accomplished by three different approaches, depending on the nature of the test we are interested in. In the case of the current test of causality, the appropriate restrictions apply to the covariances between the residuals. No restrictions can be directly imposed on these, as they depend in a complex way on the coefficients of the lagged terms of the model.
Results
- Results of the bivariate models
- Model reduction
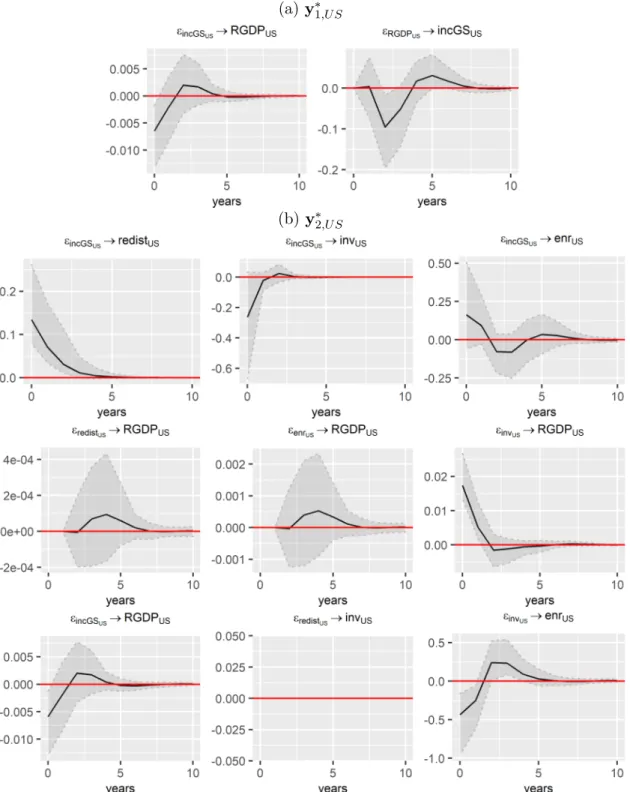
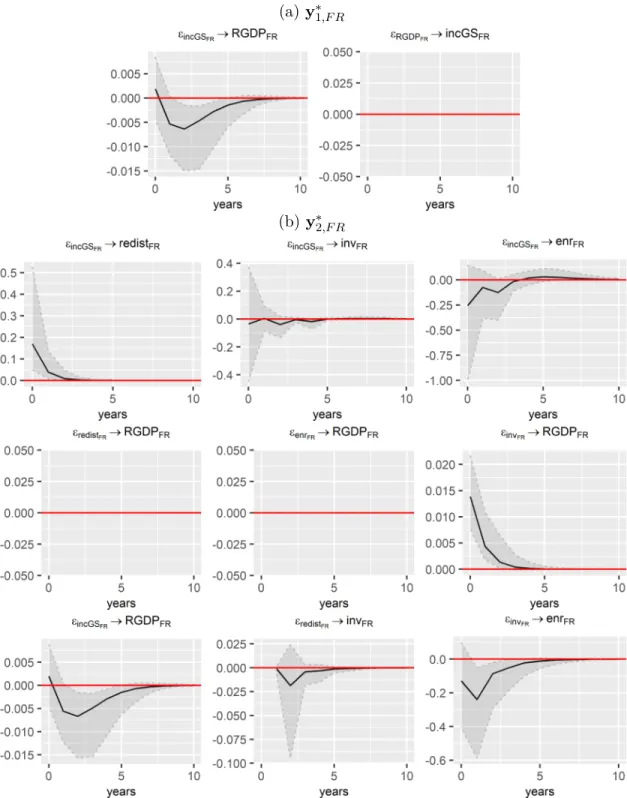
- Impulse response analysis
- Robustness checks
This is necessary to assess the stability of the results in the context of VAR models focused on relatively long periods, as in our case. However, the former is significantly weaker compared to the effect found in the analysis of the entire period. These opposing effects may explain the non-statistically significant results found in the context of the entire period of analysis.
Concluding Remarks
In the analysis of transmission channels, we found in both countries a statistically significant positive effect of inequality on redistribution, no effects of the latter on economic outcomes and no effects of inequality on enrollment rates. The third is the exploration of the effects of using different measures of inequality on the results of the inequality-growth relationship. Our work is closely related to Herzer and Vollmer (2012), who analyzed the inequality-growth relationship in the context of a panel cointegration approach, Atems and Jones (2015), due to the adoption of the Panel VAR approach to analyze the inequality-growth relationship , and the recent contribution of Soava, Mehedintu and Sterpu (2020), who analyzed this relationship in the context of the EU.
Data
Description
As far as group (c) is concerned, we focus our analysis on some of the most important transmission channels considered in the literature and for which they are adequate representatives of. In the presence of imperfections in the credit market, an increase in inequality increases the proportion of the population that is unable to make investments in human capital. The importance of financial development in determining inequality and growth can be interpreted as an immediate consequence of the channel of credit market imperfections.
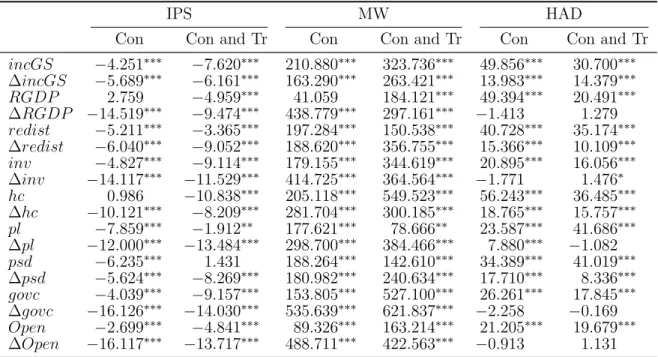
Panel unit root tests
The IPS and MW tests are based on the estimation of augmented Dickey-Fuller regressions for each time series. The HAD test is based on the results of individual KPSS tests applied to individual series and tests the null hypothesis that all time series are stationary against the alternative that at least one has a unit root. For each test, we consider a version of stationarity around a constant (Con) or a constant and a trend (Con and Tr), which in the case of the IPS and MW tests distinguish between two alternative hypotheses of stationarity, while in the case of HAD these relate to the null hypotheses being tested.
Methodology
Panel Vector autoregressive model
These variables are all included in first differences because of the results of the panel unit root tests which indicate that they are all integrated of order 1 and to ensure that the stability condition, described next, is verified. The estimation of the model requires the elimination of the fixed effect, which is accomplished by applying an appropriate transformation ∆∗ to the original variables resulting in the following specification:. A panel VAR model is stable if the moduli of the eigenvalues λ of the covariance matrix below the VAR model, obtained by representing (4.6) in a panel VAR model of order 1, are all less than or equal to 1:.
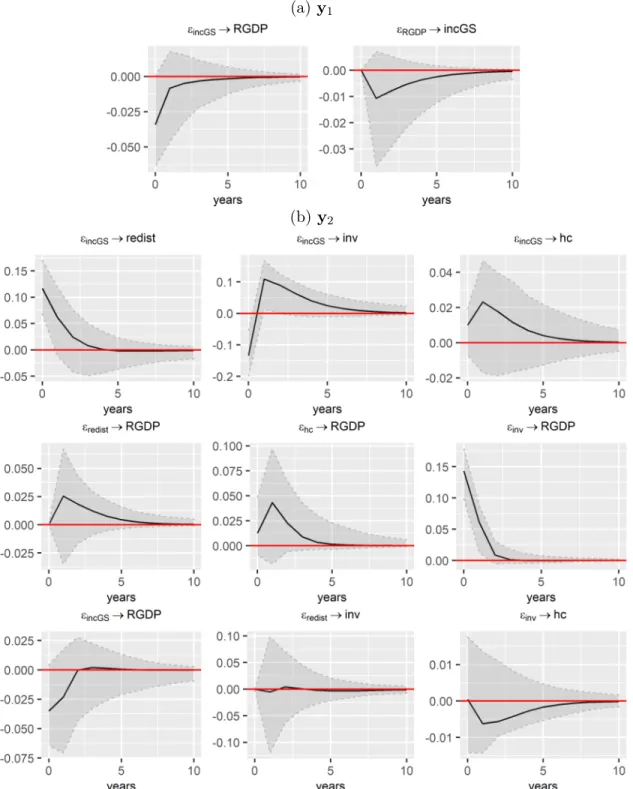
Impulse response analysis
Another analysis is to determine the transmission channels through which the effects of inequality on growth are materialized. These shocks are defined by considering the alternative specifications of the vector processes defined in (4.2) to (4.5). On the other hand, we believe that there are no reasons for the remaining variables to justify such a similar level of inertia.7.
Results
These findings suggest that the non-statistically significant link between inequality and growth is due to the opposite effects of inequality on investment. There are some changes, for example the positive effect of inequality on investment becomes non-statistically significant in the short run. However, the positive effect of inequality on investment, which was statistically significant without the control variables in the baseline specification, is now non-statistically significant.
Concluding Remarks
We also obtained the mean, minimum, and maximum of the standard deviation of the coefficient estimates across the simulations. Source: Socio Economics Accounts (February 2012 release) of the World Input-Output Database (Timmer et al., 2015). Note: (1) The average qualification premium is the time average of the ratio between the wages of skilled and unskilled workers.
Theoretical model
- Technology and prices
- Directed technical change
- Preferences and monetary authority
- Macroeconomic Aggregation
- Balanced Growth Path (BGP)
By substituting this into the Hamilton-Jacobi-Bellman condition, we obtain an expression for the real interest rate. The next proposition summarizes the dynamics of the economy both outside and in the BGP. This in turn will lead to an increase in the growth rate of the number of varieties in the H sector, i.e.
Calibration
It ensures that the model produces estimates of the stable values of the growth rate, g∗= 0.0279, and the skill premium, W∗= 1.878, obtained from the data. Finally, we calibrate γL and λ to ensure that the model produces the aforementioned values of the steady-state growth rate and skill premium, given the basic model calibration already described and the estimates we obtained for the relative supply of skilled labor. 12 In the case of the skill premium, it is calculated as the ratio of the average hourly wage of skilled and unskilled workers, i.e. Wc,t = wwH,c,t.

Results
Sensitivity Analysis
Concluding remarks
Main Streams of Research of References in cluster 1
Main Streams of Research of References in cluster 2
Main Streams of Research of References in cluster 3
Main Streams of Research of References in cluster 4
Main Streams of Research of References in cluster 5
Main Streams of Research of References in cluster 6
Main Streams of Research of References in cluster 7
Description of the data
Results of the Unit root and individual structural break tests with
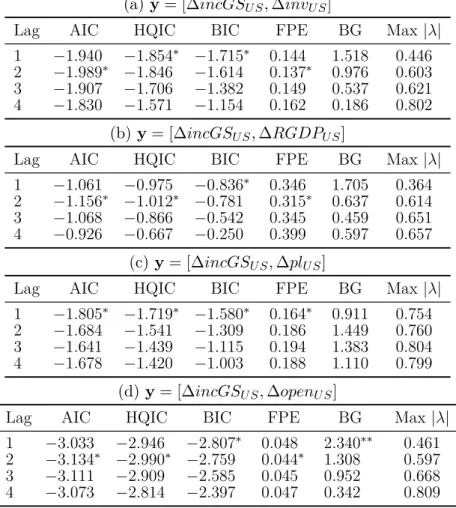
Lag order of VAR models focused on different pairs of variables
Bootstrap causality tests in bivariate models focused on the US
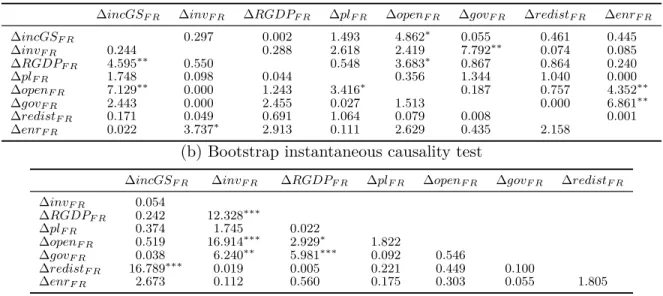
Bootstrap causality tests in bivariate models focused on France
Bootstrap causality and instantaneous causality tests to determine the
Bootstrap Wald test of the null hypothesis consistent with the lag
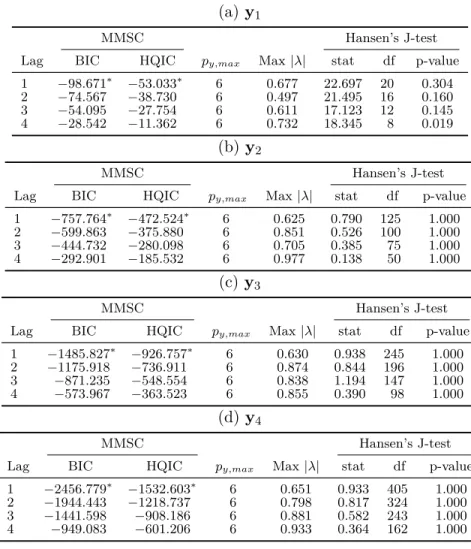
Information criteria, bootstrap serial correlation tests and stability
Information criteria, bootstrap serial correlation tests and stability
Bootstrap diagnostic tests of serial correlation and autoregressive
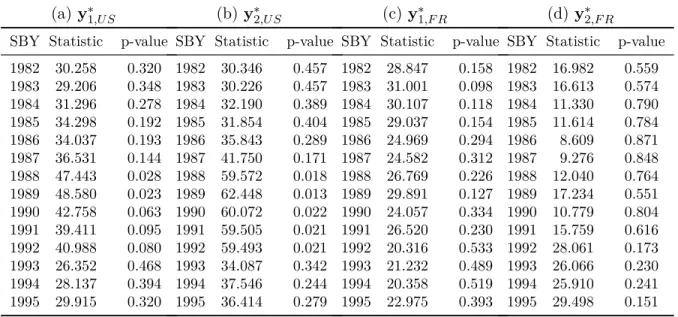
Bootstrap sample split Chow test for structural change of the estimated
Description of the data
Description of the main transmission channels analyzed in the paper
Panel Unit root tests of the variables of interest