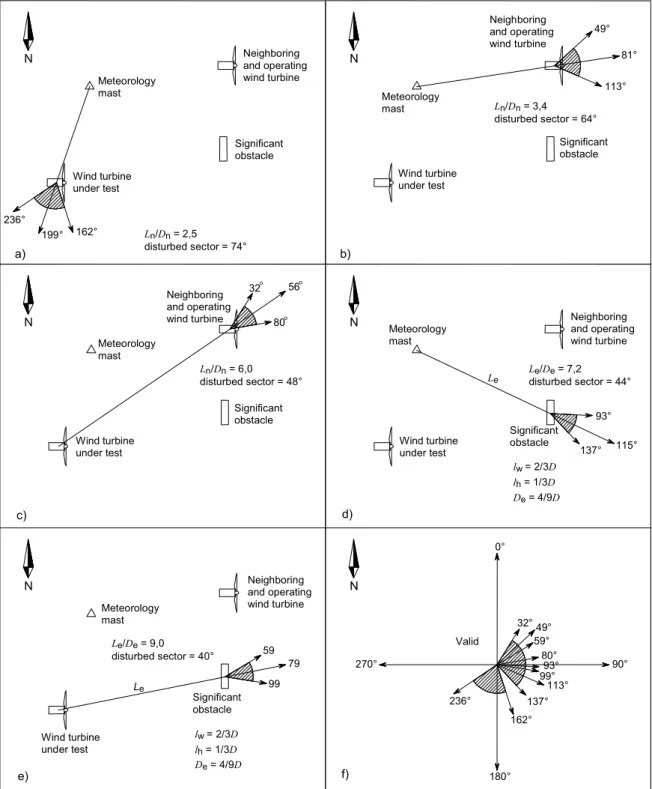
34 Figure A.2 – An example of sectors to be excluded due to aftershocks from the wind turbine below. In the meantime, a user of the standard should be aware of differences arising from large variations in wind shear and turbulence, and from the chosen criteria for data selection. Therefore, a user should consider the influence of these differences and the data selection criteria in relation to the purpose of the test before contracting the power measurements.
However, there will always be a possibility that the result of the test could be influenced by the choice of wind speed instrument. Special attention should therefore be paid to the choice of instruments chosen to measure wind speed. The specific test conditions related to the measurement of the wind turbine power performance shall be well defined and documented in the test report as described in Article 9.
Wind turbine and electrical connection
Test site
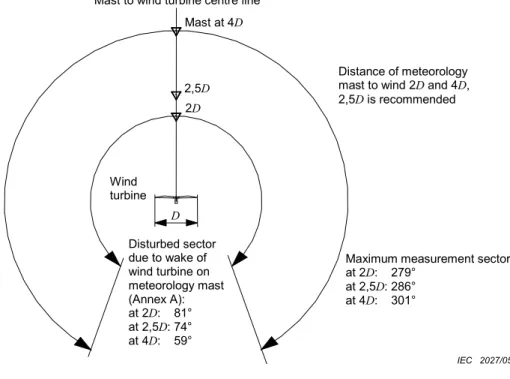
In most cases, the best location for the meteorological mast is upwind of the turbine in the direction from which the most valid wind is expected during the test. The measurement sector(s) must exclude directions with significant obstacles and other wind turbines, as seen from both the wind turbine under test and the meteorological mast. For all neighboring wind turbines and obstacles, the directions to be excluded due to wake effects are determined according to the procedure in Annex A.
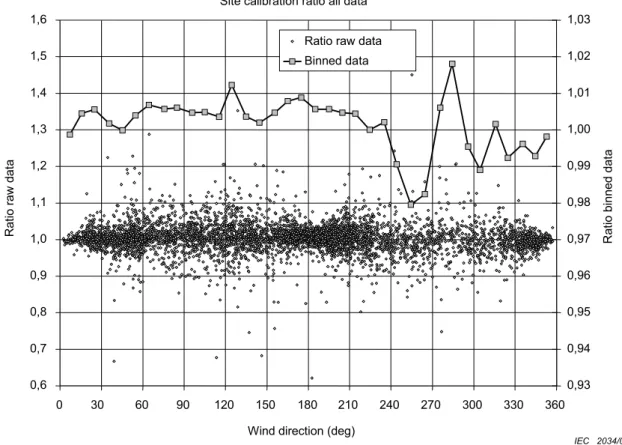
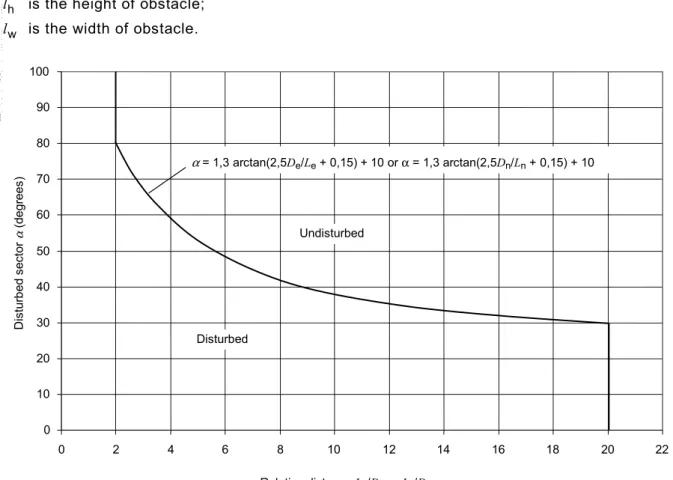
The disturbed sectors to be excluded because the weather mast is in the wake of the wind turbine under test are shown in Figure 1 for distances 2, 2.5 and 4 times the diameter of the wind turbine rotor. The test site will be evaluated for sources of wind flow distortion due to topographic changes. If the criteria of Appendix B are met, the area wind flow regime does not need a site calibration.
However, assuming no flow correction factors are required, the applied uncertainty due to flow distortion of the test site should be at least 2% of the measured wind speed if the meteorological mast is located at a distance between 2 and 3 times the rotor diameter of the wind turbine and 3% or more if the distance is 3 to 4 times the rotor diameter, unless objective evidence can be provided that quantifies another uncertainty. If the criteria in Annex B are not met, or if a lower uncertainty due to flow deformation of the test site is desired, an experimental calibration of the test site should be performed.
Electric power
Wind speed
As an inferior alternative to recalibration, it should be documented that the cup anemometer remains calibrated throughout the measurement period. The cup anemometer shall be mounted at a hub height of ± 2.5 % from the ground at the meteorological mast. The uncertainty in the wind speed measurement comes from three sources (see Table D.1): the calibration of the instrument, the operational characteristics of the anemometer, and flow distortion due to instrument mounting effects.
Wind direction
Air density
Rotational speed and pitch angle
Blade condition
Wind turbine control system
Data acquisition system
General
Wind turbine operation
Data collection
Data rejection
Data correction
Database
If a single incomplete bin prevents completion of the test, that bin value can be estimated by linear interpolation from the two adjacent complete bins. The following condition must be met using these two criteria: AEP measured by extended procedures deviates less than 1 % from AEP extrapolated up to the highest complete wind speed bin for the extended procedures (for the Rayleigh distribution in 8.3).
Data normalization
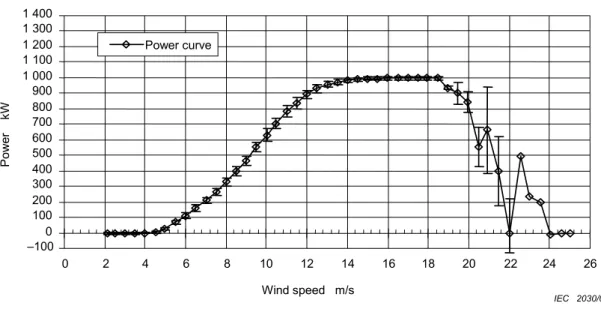
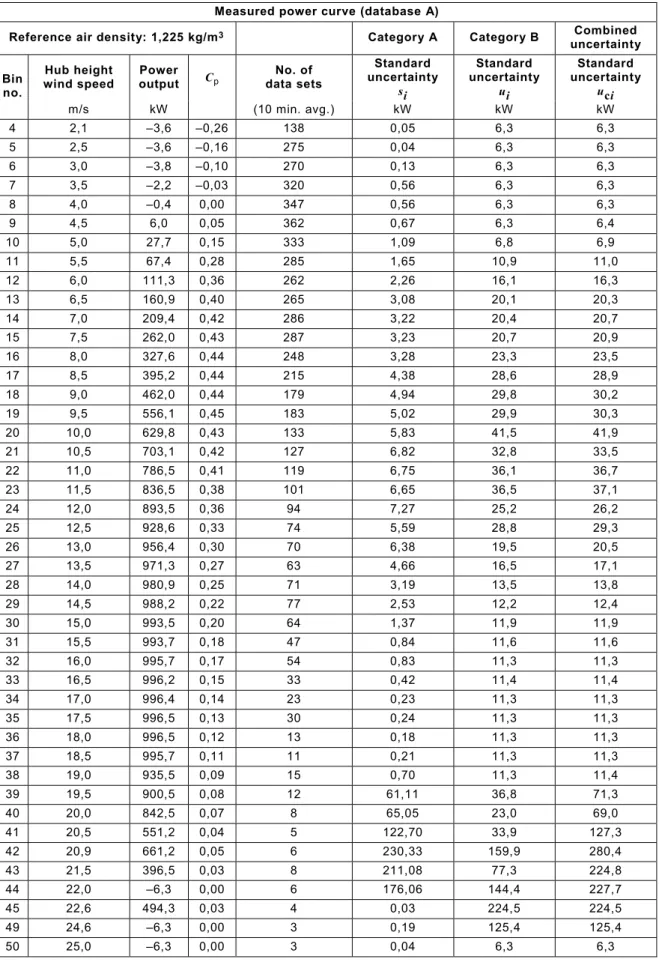
Determination of the measured power curve
Annual energy production (AEP)
AEP must be calculated in two ways, one termed "AEP measured", the other "AEP extrapolated". If the measured power curve does not contain data up to interrupted wind speed, the power curve must be extrapolated from the maximum complete measured wind speed up to interrupted wind speed. AEP measured shall be obtained from the measured power curve by assuming zero power for all wind speeds above and below the range of the measured power curve.
The extrapolated AEP is obtained from the measured power curve assuming zero power for all wind speeds below the lowest wind speed on the measured power curve and a constant power for wind between the highest wind speed on the measured power curve and the extracted wind speed. The constant power used for the extrapolated AEP is the power value from the bin at the highest wind speed on the measured power curve. AEP measured and AEP extrapolated shall be presented in the test report as detailed in Clause 9.
34;incomplete" when calculations show that the measured AEP is less than 95% of the extrapolated AEP. Measurement uncertainty estimates in terms of AEP standard uncertainty according to Appendix D shall be reported for AEP- in measured for all taking into account the average annual wind speed.
Power coefficient
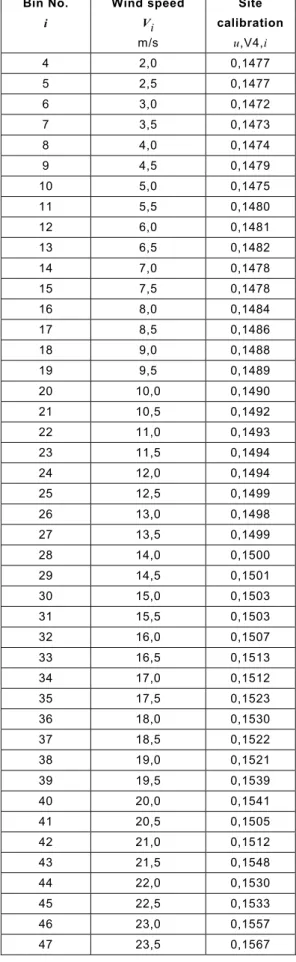
Before installation or after removal of the wind turbine, two meteorological masts are placed. The wind direction bin must not be smaller than the uncertainty of the wind direction sensor. From the site calibration database, the averages of the flow correction factors due to terrain.
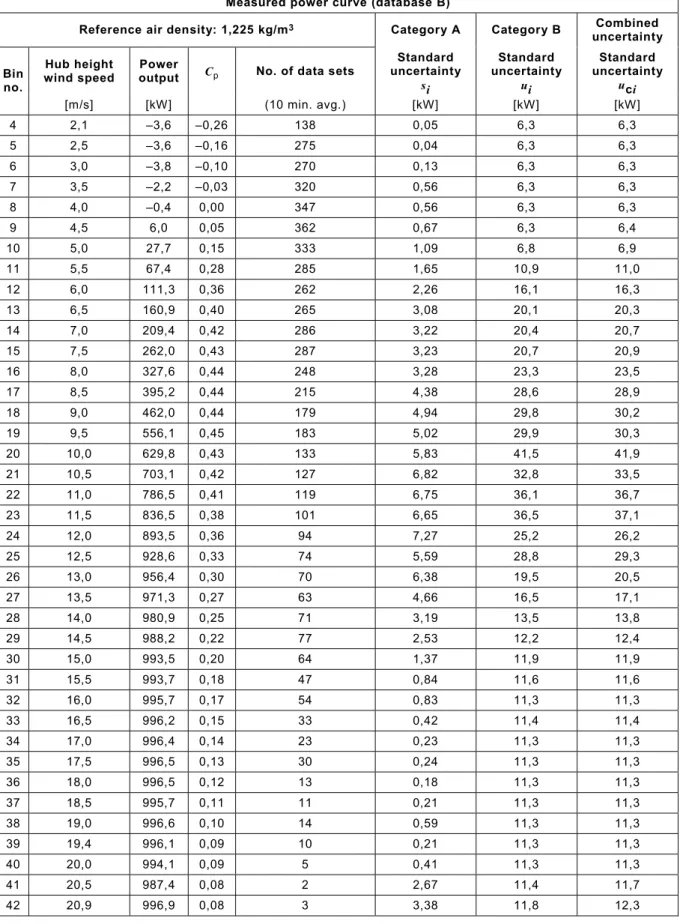
The measured power curve must be supplemented with an estimate of the uncertainty of the measurement. The uncertainty for the power curve is derived and finally the uncertainty for the AEP is estimated. The uncertainty of the anemometer calibration (see appendix F) and the uncertainty due to operating characteristics (see appendix I) can be dominant in the measurement.
The standard uncertainty of the flow deformation due to take-off effects is estimated to be 1% of the wind speed. An uncertainty due to the correction can be taken into account, and the uncertainty (calibration) of the pressure sensor must be included. The presence of the anemometer will not substantially affect the flow field in the wind tunnel.
The anemometer is placed as precisely as possible on the test section perpendicular to the flow field in the wind tunnel.
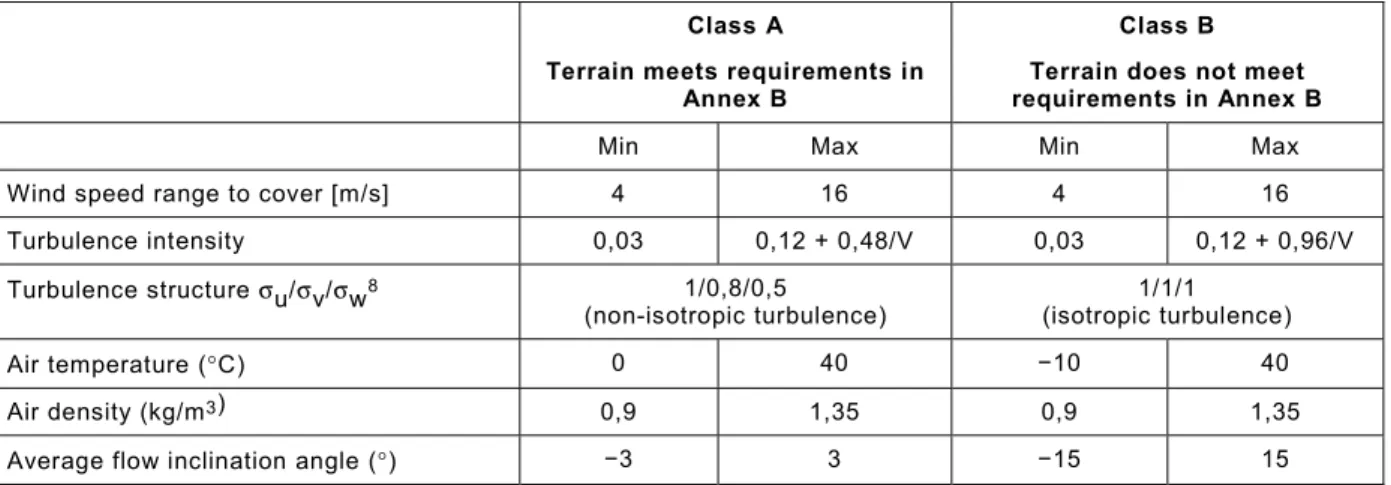
Class S: Associated with a specified accuracy, where the influence parameter ranges are limited to allow for the specified accuracy of the anemometer. An actual assessment of a type of cup anemometer can be based on the examples, but can also be based on other assessment methods, as long as they include verified procedures to include the influence of the basic characteristics. The torque on the cup anemometer rotor can be measured in a wind tunnel by attaching a thin shaft to the top of the cup anemometer rotor, and by rotating the shaft around the cup anemometer at non-equilibrium rotational speed compared to wind tunnel air speed .
An example of a torque measurement, where the wind tunnel speed was kept constant at 8 m/s and the rotation speed of the rotor was varied, is shown in Figure J.2. The angular response characteristic of a cup anemometer in turbulent flow depends on the vertical components of the turbulent flow. The standard deviation of the vertical wind speed component is smaller than the standard deviation of the horizontal component (for classification purposes a relation σv = 0.8σu must be used).
In addition to the effects described above due to unsteady flow conditions caused by the angular characteristics of the cup anemometer, some anemometers tend to have a type of dynamic effect often referred to as aerodynamic overspeed. Since the deviations according to the above procedures can be negative or positive, a class 1 anemometer must not have a total deviation of more than 1% within the range of influence parameters of the power curve measurement. By exposing the anemometer cup model to a time trace of such an artificial wind for 10 minutes, the response of the anemometer cup is derived.
The data is filtered for a narrow sector of the wind direction (eg ±20º or ±40º centered at 90° to the arm, depending on the measurement sector) and a wind speed range of 6 m/s to 12 m/s. The relationship between the measurements of the two anemometers must be analyzed using the bin-by-bin method of 1 m/s (control wind speed of the anemometer). From the first part of the measurement period until the end of all 1 m/s intervals (minimum three values per interval and maximum eight weeks), a linear regression is performed with the control anemometer as the dependent variable and the primary anemometer used to measure the power curve as the independent variable.
A recalibration in the wind tunnel of the primary anemometer after the measurement period is not necessary, if the following two criteria are met (only data recorded after the linear regression has been performed should be analyzed): . a) there is at least 30 minutes of sample data per bin;. The standard uncertainty of the wind speed differences is calculated in each wind speed bin as standard deviation of wind speed differences divided by the square root of number of data points per wind speed bin. The sum of the squares of the systematic deviation and the statistical deviation must be less than 0.1 m/s for each wind speed bin.