341
Leandro Fleck Fadel Miguel
https://orcid.org/0000-0002-7881-1642 Professor-Adjunto
Universidade Federal de Santa Catarina - UFSC Departamento de Engenharia Civil
Florianópolis - Santa Catarina - Brasil [email protected]
Jorge Daniel Riera
Professor-Titular Convidado
Universidade Federal do Rio Grande do Sul - UFRGS Departamento de Engenharia Civil
Porto Alegre – Rio Grande do Sul [email protected]
Vanessa Vanin
http://orcid.org/0000-0003-2292-9649 Doutoranda
Universidade Federal de Santa Catarina - UFSC Departamento de Engenharia Civil
Florianópolis - Santa Catarina - Brasil [email protected]
Comparative study of tall
building response to synoptic
and non-synoptic wind action
Abstract
Until the beginning of the 21st Century, the characteristics of wind for purposes
of structural analysis and design, as reflected in wind codes worldwide, were based on the behavior of wind currents in the vicinity of the ground surface observed in so-called synoptic events. It was only recently recognized that the latter are not the only cause of wind damage to buildings and structures, not even its main cause. In view of the absence of any reference to non-synoptic winds in most South American wind codes, their urgent revision to include the effects on non-synoptic winds is badly needed. The
downburst is a relevant meteorological phenomenon that causes extreme winds in the
lower atmospheric boundary layer. The present article briefly describes an introduction to an simplified approach recently proposed by the second author to describe the wind velocity field in this type of meteorological phenomenon, that is, downbursts within in-stability lines. The method is examined by a comparative study of tall building response to synoptic and non-synoptic wind action.
Keywords: wind action, structural design, synoptic wind, downburst, velocity
field, risk, probability of occurrence. http://dx.doi.org/10.1590/0370-44672017710131
Civil Engineering
Engenharia Civil
1. Introduction
Wind loads play an important role in structural design, especially in the case of tall or light constructions. Most codes assume that at above plane, horizontal ground, the mean
veloc-ity vector is constant and parallel to the ground surface. The hypothesis is valid in case of so-called synoptic wind, which is the most frequent type of wind storm in temperate regions, namely extra-tropical storms or Extended Pressure Systems (EPS), and in the case
of tropical storms or hurricanes, also designated typhoons when originated in the Pacific Ocean. On the other hand, wind effects caused by downdrafts or downbursts, typical of thunderstorms (TS), or of combinations of the
lat-ter with an EPS event, in so-called instability or squall lines, have not yet
been explicitly considered in the wind codes in South America. It is germane to underline at this point that the wind velocity field during squall lines
is significantly different from the field assumed in most wind codes, usually based on models valid only for synoptic wind. Important differences between wind originated in EPS and TS events
are the following: records of EPS winds
may be regarded as samples of random stationary processes. Moreover, the
fre-quency content of the process depends on the surface roughness of the upwind terrain. None of these assumptions is valid for TS winds. As an obvious
consequence, methods prescribed in wind codes for assessing the response of structures subjected to EPS winds
cannot be directly applied to excitation due to TS winds. In temperate regions, not affected by tropical storms, around
nine out of every ten observations of the maximum annual horizontal compo-nent of the wind velocity at the standard 10 m height occur during EPS events.
In consequence, extreme velocities for return periods that exceed 10 years
are almost always due to TS events,
which should then govern structural design, at least for low construction heights. Evidence in relation with the statement, in general, may be found in Letchford & Lombardo (2015). Data from Brazilian meteorological stations are described in Riera & Nanni (1989) and Riera, Viegas & Santos (1989). The practical importance of determining the probability distribution of maxi-mum annual velocities caused by TS
events, independently of EPS winds,
was underlined by Riera et al (1977),
but not yet implemented in South America, to the author’s knowledge. Thom (1967) had earlier suggested the use of a mixed distribution PV (v) to
predict the occurrence in the USA of extreme winds due to EPS events and
velocities of wind caused by EPS or by TS phenomena are characterized by probability distribution functions with different parameters. It was found for
most annual maximum velocity series, the Fisher-Tippett Type I, also known as Gumbel distribution, presented a better fit to the data than either the Types II or III extreme value distributions.
Additional evidence on the im-portance of winds caused by TS events
was provided by builders or designers of electrical transmission lines. In fact, ac-cording to CIGRÉ (2002), in temperate climates worldwide, more than 83% of failures of transmission towers or lines were caused by downbursts. Finally, at the recent 14th ICWE - International Conference on Wind Engineering,
held in 2015, more than 20 contribu-tions dealt with TS winds and their
effects. Letchford (2015) discusses the possibility of including in wind codes, the guidelines for designing structures subjected to downbursts, as already proposed by Gomes & Vickery (1978), who are among the first researchers that recognized the need to separate wind velocity records according to the
causative meteorological phenomenon. Moreover, recent studies confirm that the wind loads that control structural design in most areas of the continental USA are due to the TS event
(Lom-bardo, 2012; De Gaetano et al, 2014).
These developments led to the consid-eration of TS winds in the revised map of wind velocities of ASCE Code 7 (2016), following previous advances of the Australia/New Zealand Standard AS / NZS 1170.2.
Riera (2016) recently suggested a simplified procedure to account for the effects of TS events in structural
design, based on the observation that the horizontal component of the maxi-mum wind velocities at the reference 10 m height during stationary TS events (downbursts) very rarely exceeds
30 m/s. This velocity is below the minimum wind design velocity in most regions of the entire South American continent and since the dimensions of the area affected by the wind velocity field are, more often than not, of the same order of magnitude or smaller than the dimensions of the structures under consideration, the resulting wind
forces should rarely exceed current code prescriptions for synoptic winds. In consequence, except in special situations, the action of stationary TS events (downbursts) should not have
any influence on the required structural strength and needs not be discussed in wind codes. However, in so-called instability lines, also known as squall lines, in which the wind velocities
caused by the downdraft from the causative cumulonimbus cloud sums up with the velocity of the (usually synoptic) wind that carries the cloud, the horizontal component at 10 m height may exceed 60 m/s, which has to be considered in design. Thus, Riera (2016) proposed a simplified model for the design wind in a squall line, which will be described next.
Thus, in order to assess the predic-tions of the design procedure suggested by Riera (2016), the probabilistic response of a prismatic building with square cross-section and heights in the range between 20 and 300 m is assessed. To this purpose, the simulation model proposed by Ponte and Riera (2010) and extended by Gheno
et al. (2014) is employed.
2. Simplified model of a squall line
Let Vo denote the design velocity
for TS winds, defined as the horizontal
component of the maximum velocity at the standard 10 m height above ground level, for a period of exposure and prob-ability of occurrence defined by the de-signer, or specified in the wind code. For recurrence periods of 25 years or more, the TS wind would almost certainly
occur in a squall line, in which case the translation velocity of the downburst may be estimated as 0.35 Vo, as discussed
in Riera (2016). On a plane normal to the orientation of the squall line, the
horizontal component of the mean veloc-ity at the reference height (z = 10 m) may be represented by the simplified diagram shown in Figure 1.
For static structural analysis or design, only the peak values (Vo or 0.35 Vo) and associated vertical profiles are
needed. Note that outside the band of width b, the vertical profile and other
characteristics of the wind correspond to an EPS event, as described in Code
NBR 6123 and elsewhere. The parameter
T, known as characteristic time of the TS event, depends on several factors,
such as the height and other geometrical dimensions of the causative cumulonim-bus cloud and the translation velocity, typically increasing with the intensity of the event (Ponte & Riera, 2007). The recommended values of the parameter T
for TS event categories are indicated in
Table 1. Finally, within the band of width
b, the vertical profile may be determined
by the Equation (1), proposed by Savory
et al (2001) for TS winds. Note that,
employing the heights zmax indicated in
Table 2, the value of Vmax may be
deter-mined if Vo is specified.
(a) (b)
Figure 1
Velocity distribution at the reference height (z = 10 m), in a cross-section normal to the orientation of the velocity for a TS event. (a) Downburst wind (TS): width at the top of the trapezoidal region
343
Designation Vo d b Height of Vmax T
(CD) (m/s) (m) (m) zmax(m) (s)
CD 1 Vo≤ 30 10 40 20 60
CD 2 30 < Vo≤ 40 20 60 40 120
CD 3 40 < Vo≤ 50 40 100 80 180
CD 4 50 < Vo≤ 60 60 160 120 300
CD 5 60 ≤Vo 80 240 160 480
Table 1 Parameters of the five categories of downdrafts (CD).
V
(η) /
V
max=
exp
(- 0.15 η ) –
exp
(- 3.2175 η ), η =
z / z
max3. Simulation procedure
Ponte & Riera (2010) simulated a series of observations of the horizontal component of the wind velocity at a 10 m height during TS events at the loca-tions of two meteorological staloca-tions in Southern Brazil. Probability distributions of the maximum annual velocity based on the simulated series were shown to be close to the distributions based on actual meteorological records from those stations. The approach was extended by Fadel Miguel & Riera (2013) to simulate an annual series of bending moments and shears caused by TS events at the base of a free standing constant cross-section 50 m tall building. The procedure was later employed by Gheno et al (2014) to
determine by simulation the response of transmission lines. In all those studies, the simulation of annual maximum wind velocity, as well as response data of specific structures at predefined locations required the specification of the following data: geographic region of interest, dimensions of area for the simulation, mean frequency of TS events in the region, pressure drop in thunderstorms, characteristic time, ve-locity and direction of background wind, height of cumulonimbus cloud, radius of the wind flow at the cloud base. The top-ics listed and the discussion in connection with the numerical examples adopted herein are found in Gheno et al (2014).
Thus, in the present application, the simulation starts by defining the coordi-nates of the points of interest (building heights). Afterwards, random values of the following variables are generated, con-sidering the probability distribution of the variable under consideration: coordinates of the point of origin of the thunderstorm, height of the anvil, pressure drop, char-acteristic time of the event, radius of the flow at the cloud base, background wind speed, orientation of background wind (γ). For each height of interest z, the following steps are performed: the tangential veloc-ity of the streamline passing through x,y,z
is calculated; the background wind speed is determined considering the height z of
the point; the coordinates of the storm center at each time step are calculated; the distance between the storm center and the location of interest for each time step is calculated; the evolution with time of the wind velocity is accounted for with the modulation function and the corrections based on the distance from the point to the origin of the storm are applied; if the point is outside the area of influence of the TS event, the speed is set equal to zero.
Thus, the velocity generated by the TS is defined at each instant of time for pre-defined building heights. From these data, the resulting speed can be calculated by combining the velocity
vector generated by the downburst with the background wind velocity vector. To simulate a series of annual maximum shearing forces and bending moments at the building base, the number of years to be simulated and the number of events each year must be defined. Afterwards, for each event, the steps presented above are executed. At the end of each event, the maximum wind speed at 10 m height, and the corresponding shearing forces and bending moments at the building base are recorded. This process is repeated for all the events that occur during the year. By performing this procedure, a series of annual maximum 10 m height velocities is generated, as well as series of annual maximum shearing forces and bending moments at the building base. In previ-ous studies (Ponte & Riera, 2010; Fadel Miguel & Riera, 2013 and Gheno et al,
2014), simulations of wind fields during TS events were limited to heights below around 50 m, since they were intended for applications for low height constructions such as transmission lines, silos and indus-trial structures. The basic assumptions and computer programs were not tested for tall buildings or towers and thus only results for heights below 90 m are herein reported, range in which the influence of the adopted vertical profile proposed in literature should be small.
4. Assessment of response methods
For comparison purposes, a pris-matic building with square cross-section and heights in the range between 20 and 300 m was considered in this assessment. A base length of 15 m was adopted in all cases, which means that the slenderness of the buildings varied between 1.3 and 20. Only wind orientation normal to one of the faces was considered in the deter-mination of the resulting shear and bend-ing moment at the base. The response of
the buildings was calculated adopting the model suggested by Ponte & Riera (2007, 2010) and the simulation scheme employed by Miguel & Riera (2013), with the modifications introduced by Gheno et al (2014), to estimate the static response of slender structures subjected to TS wind action (Method TS1). Next, the simplified method proposed by Riera (2016) (Method TS2) was employed with the same objective. In both cases,
response amplification due to dynamic effects caused by TS wind action was ne-glected, a simplification that is clearly ac-ceptable for practical structural design of buildings less than about 60 m in height, but requires further verification for taller structures, which are presently in prog-ress. The approach under consideration for assessing the dynamic component of TS wind effects differs from existing proposals in technical literature. It may
also be noted that the scheme employed by Le and Caracoglia (2017) to deter-mine the transient dynamic response of a tall building subjected to a specific TS event does not seem feasible for use in
engineering design. The same prismatic buildings were analyzed employing the procedures adopted in the Brazilian code NBR 6123 (1988), which are ap-plicable to synoptic winds (EPS). Under
the action of EPS winds, the buildings described above were examined under Exposure case 2 (grasslands, open fields), subjected both to static (EPS1) and dy-namic (EPS2) excitations.
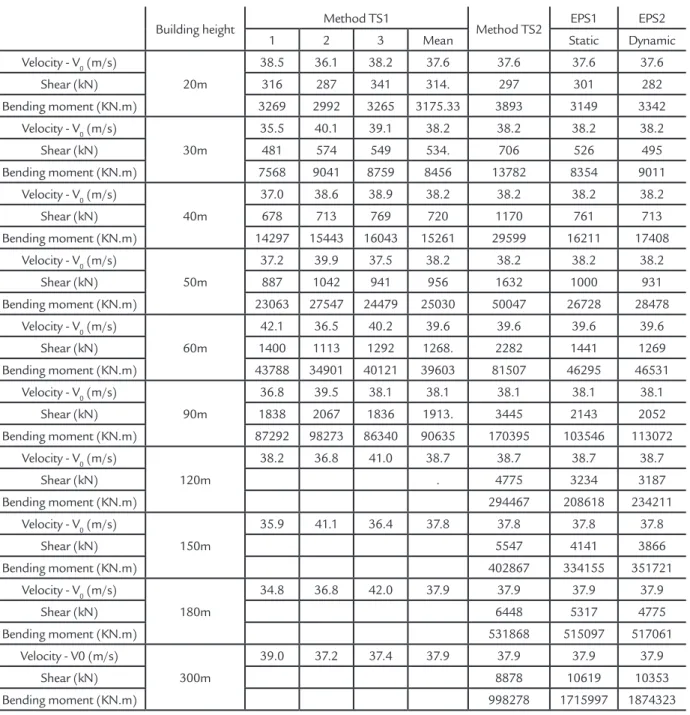
Building height Method TS1 Method TS2 EPS1 EPS2
1 2 3 Mean Static Dynamic
Velocity - V0 (m/s)
20m
38.5 36.1 38.2 37.6 37.6 37.6 37.6
Shear (kN) 316 287 341 314. 297 301 282
Bending moment (KN.m) 3269 2992 3265 3175.33 3893 3149 3342
Velocity - V0 (m/s)
30m
35.5 40.1 39.1 38.2 38.2 38.2 38.2
Shear (kN) 481 574 549 534. 706 526 495
Bending moment (KN.m) 7568 9041 8759 8456 13782 8354 9011
Velocity - V0 (m/s)
40m
37.0 38.6 38.9 38.2 38.2 38.2 38.2
Shear (kN) 678 713 769 720 1170 761 713
Bending moment (KN.m) 14297 15443 16043 15261 29599 16211 17408
Velocity - V0 (m/s)
50m
37.2 39.9 37.5 38.2 38.2 38.2 38.2
Shear (kN) 887 1042 941 956 1632 1000 931
Bending moment (KN.m) 23063 27547 24479 25030 50047 26728 28478
Velocity - V0 (m/s)
60m
42.1 36.5 40.2 39.6 39.6 39.6 39.6
Shear (kN) 1400 1113 1292 1268. 2282 1441 1269
Bending moment (KN.m) 43788 34901 40121 39603 81507 46295 46531
Velocity - V0 (m/s)
90m
36.8 39.5 38.1 38.1 38.1 38.1 38.1
Shear (kN) 1838 2067 1836 1913. 3445 2143 2052
Bending moment (KN.m) 87292 98273 86340 90635 170395 103546 113072
Velocity - V0 (m/s)
120m
38.2 36.8 41.0 38.7 38.7 38.7 38.7
Shear (kN) . 4775 3234 3187
Bending moment (KN.m) 294467 208618 234211
Velocity - V0 (m/s)
150m
35.9 41.1 36.4 37.8 37.8 37.8 37.8
Shear (kN) 5547 4141 3866
Bending moment (KN.m) 402867 334155 351721
Velocity - V0 (m/s)
180m
34.8 36.8 42.0 37.9 37.9 37.9 37.9
Shear (kN) 6448 5317 4775
Bending moment (KN.m) 531868 515097 517061
Velocity - V0 (m/s)
300m
39.0 37.2 37.4 37.9 37.9 37.9 37.9
Shear (kN) 8878 10619 10353
Bending moment (KN.m) 998278 1715997 1874323
Table 2
Summary of resulting shears and moments
Table 2 summarizes the results of the numerical assessment. First, three independent runs of the simulation model (Method TS1) were performed for each building. Then, the wind speed (horizontal component at 10 m height, 3 s, maximum in a 50-year series) and the corresponding shearing forces and bending moments at the building base were determined. Their average values were used in the ensuing comparisons. Finally, the mean wind velocity previously
evaluated, was adopted as design veloc-ity to determine the shear and moment predicted using both the simplified TS
model (Method TS2) and the procedures prescribed by NBR 6123 for static (EPS1) and dynamic (EPS2) analysis, which were developed for synoptic winds only. Once again, the resulting shear forces and bend-ing moments at ground level were deter-mined. To apply the NBR 6123 dynamic procedure (EPS2), a building mass of 1000 kg/m2 for each floor was assumed. The
critical damping ratio was taken equal to
ξ=0.02, the first natural period and the first mode shape were determined by the simplified expressions T1=0.05+0.015h
and x(z)=(z/h)1.2, respectively.
345
as model EPS2, may be regarded as a robust estimate of a standard building response to synoptic wind in Exposure type II. Note that model EPS1 indicates the static wind load determined accord-ing to the same standard, without takaccord-ing into consideration the allowable reduction of the incident velocity due to the build-ing size. The response designated EPS1 does not include the reduction due to size effect because of practical
difficul-ties, since the NBR 6123 code presents the appropriate coefficients in the form of tables. As explained in the text, the computed shear and bending moment at the base constitute upper bounds, which add credibility to the EPS2 results: the dynamic response, for all heights, does not differ much from the upper bound of the static approach. Since both shearing forces and bending moments at ground level predicted by models EPS1 and EPS2
are quite similar, the analysis suggests that, for average buildings with heights within the range considered, the reduc-tion of wind loads due to building size in the static analysis is comparable to the dynamic amplification induced by wind turbulence. The observation, however, valid for type II exposure, should not be extended to other surface roughness conditions without additional studies, but lends support to the results presented.
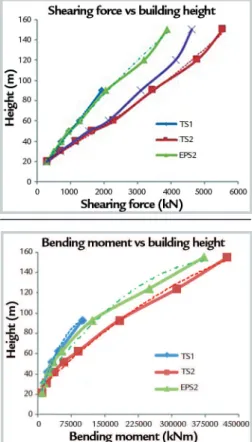
Figure 2 Shearing forces at the building base for building heights up to 150 m, for TS and EPS high intensity winds.
Figure 3 Bending Moment at the building base for building heights up to 150 m, for TS and EPS high intensity winds.
The excitation determined by simulation for non-synoptic wind (TS1), which was employed earlier by the authors to determine the resulting wind pressures for elevations below 50 m (Fadel Miguel & Riera, 2013; Gheno
et al, 2014) leads to smaller values of
both the shearing forces and bending moments for buildings with heights up to 90 m than the proposed model TS2. The difference is attributed to the vertical profile adopted in the latter (Savory et al, 2001), which is judged
to better explain the distribution of
damage observed in recent TS events. Since model TS2 does not take into consideration pressure fluctuations, it is expected to overestimate the predicted non-synoptic wind action, just as model EPS1 overestimates the static synoptic wind action.
5. Conclusions
The need for procedures to deter-mine the response of structures subjected to non-synoptic wind was briefly de-scribed, as an introduction to a simple method to assess the wind velocity field for structural design in those situations. Herein, predictions of the shearing load and bending moment at ground level, for prismatic buildings with average prop-erties (stiffness and mass) and heights extending up to 300 m, were determined both for synoptic and non-synoptic winds, to assess the soundness of various
approaches, aiming for the confirmation or eventual correction of parameters and assumptions adopted in the proposed approach for TS wind action.
These results indicate that the method TS2 is consistent and its pre-dictions compatible with available ex-perimental evidence. Since size effects tend to reduce the total loads when the dimensions of the building increase, present predictions should be conserva-tive. The expected reductions in total shear forces and bending moments in
tall buildings, due to TS winds, as con-sequence of lack of coherence in wind pressures, are shown graphically herein. However, since dynamic amplification has the opposite effect, and none of it was incorporated in the simplified ap-proach; additional research is necessary before introducing correction factors in the method.
the design of structures with heights exceeding approximately 150 m. Con-versely, the structural design of buildings
with heights below about 50 m, should be controlled by non-synoptic winds. Within the range between 50 and 150
m, the excitations due to synoptic and non-synoptic winds should in general be determined for both loading conditions.
Acknowledgements
The writers wish to acknowledge the support of CNPq and CAPES (Brazil)
References
ASSOCIAÇÃO BRASILEIRA DE NORMAS TÉCNICAS – ABNT. NBR – 6123 (1987) Ação do vento nas edificações, Rio de Janeiro, 1987.
ASSOCIAÇÃO BRASILEIRA DE NORMAS TÉCNICAS – ABNT. NBR – 5419 (1991) Proteção de estruturas contra descargas atmosféricas, Rio de Janeiro, 1991.
AUSTRALIAN/NEW ZEALAND STANDARD – AS/NZS 1170.2 (2002) Structural design actions –Part 2 -Wind actions, Sydney, 2002.
AUSTRALIAN/NEW ZEALAND STANDARD – AS/NZS 7000 (2010): Overhead Line Design – Detailed Procedures, Sidney, 2010.
AMERICAN SOCIETY OF CIVIL ENGINEERS – ASCE Manual 74: Guidelines for Electrical Transmission Line Structural Loading, 3rd ed. ASCE manuals and reports on engineering practice no. 74. Reston, VA, USA; 2010.
CARACENA, F., HOLLE, R.L., DOSSWELL, C.A. Microbursts: A
hand-book for visual identification. NOAA, National Severe Storm Laboratories, U.S.A.,
December 1977.
CONSEIL INTERNATIONAL DES GRANDS RESEAUX ÉLECTRIQUES – CIGRÉ SC22 WG16. Meteorology for overhead lines- Draft Report on Current Practices regarding Frequencies and Magnitude of High Intensity Winds- Aug. 2002.
DE GAETANO, P., REPETTO, M.P., REPETTO, T., SOLARI, G. Separation and classification of extreme wind events from anemometric records. Journal of Wind
Engineering Industrial Aerodynamics, v. 126, p. 132-143, 2014.
FADEL MIGUEL, L. F., RIERA, J. D. Loads induced on tall structures by thun-derstorm winds in temperate latitudes. In: INTERNATIONAL CONFERENCE ON STRUCTURAL SAFETY AND RELIABILITY - ICOSSAR, 11. Proceedings... Nova
York, 2013.
GHENO, R.M., MENEZES, R.C.R., RIERA, J.D., FADEL MIGUEL, L.F. Loads induced on cables by convective winds in temperate latitudes, In: INTERNATIONAL CONFERENCE ON WIND ENGINEERING, 14. Proceedings... June 2015, Porto
Alegre, 2015.
GOMES, L., VICKERY, B. J. Extreme wind speeds in mixed wind climates.
Journal of Wind Engineering Industrial Aerodynamics, v. 2, p. 331-344, 1978.
HOLMES, J.D., OLIVER, S.E. An empirical model of a downburst. Engineering
Structures, v. 22, p. 1167–1172, 2000.
LETCHFORD, C.W., LOMBARDO, F.T. Is codification of non-synoptic wind loads possible? In: 14th INTERNATIONAL CONFERENCE ON WIND ENGINEER-ING, 14. Porto Alegre, 2015. (Invited Lecture, Porto Alegre - in CD).
LOMBARDO, F.T. Improved extreme wind speed estimation for wind engineer-ing applications. Journal of Wind Engineering Industrial Aerodynamics, v. 108,
p. 278-284, 2012.
PONTE, J. Modelagem e simulação do campo de velocidades do vento em
tormentas elétricas. Porto Alegre: Universidade Federal do Rio Grande do Sul, 2005.
(Tese de Doutorado).
PONTE Jr, J., RIERA. J.D. Wind Velocity Field during Thunderstorms, Wind and Structures, v. 10, n. 3, 2007.
PONTE Jr., J., RIERA, J.D. Simulation of extreme wind series caused by thun-derstorms in temperate latitudes. Structural Safety, v. 32, p. 131-137, 2010.
RIERA, J. D., VIOLLAZ, A.J., REIMUNDIN, J.C. Some recent results on proba-bilistic models of extreme wind speeds. Journal of Industrial Aerodynamics. Elsevier,
The Netherlands, v. 2, p. 271-287, 1977.
RIERA, J.D., NANNI, L.F. Pilot study of extreme wind velocities in a mixed climate considering wind orientation. Journal of Wind Engineering and Industrial
347
RIERA, J.D., VIEGAS, F.B., SANTOS, M.L.W. Probabilistic assessment of wind loading for structural analysis. In: INTERNATIONAL CONFERENCE ON STRUC-TURAL SAFETY AND RELIABILITY, ICOSSAR´89, 5. Proceedings... Innsbruck,
Austria, A.A. Balkem, Rotterdam, v. 1, p. 55-62, 1989.
RIERA, J.D. Sobre a definição do vento para projeto estrutural na NBR 6123 e outras normas sul-americanas. Revista Sul-Americana de Engenharia Estrutural (ASAEE), v. 13, n. 3, p. 1-27, set/dez 2016.
SAVORY, E., PARKE, G.A.R., ZEINODDINI, M., TOY, N., DISNEY, P. Model-ling of tornado and microburst-induced wind loading and failure of a lattice transmission tower,. Engineering Structures, v. 23, p. 365–375, 2001.
LE, T.H., CARACOGLIA, L. Computer-based model for the transient dynamics of a tall building during digitally simulated Andrews AFB thunderstorm. Computers
and Structures, v. 193, p. 44-72, 2017.
THOM, H.C.S. Toward a universal climatological extreme wind distribution.
Wind Effects on Buildings and Structures. Ottawa, Canada, Univ. of Toronto Press,
v. 1, p 669-684, 1967.