The tracking is updated daily and provides historical and real-time indicators of the state of the epidemic and the economy. As shown in Figure 1, in the early phase of the outbreak, the doubling time of COVID-19 deaths doubled (red line). Source: PET project, using data (by the end of the first quarter of 2020) from the Baidu Mobility Index, National Health Commission of the People's Republic of China and the Wind Economic Database.
Economic sectors vary widely in the extent to which they can operate with limited mobility.

Global pandemic, COVID policies and measures, and mobility
Key Features of The Global Pandemic Economy
Global Mobility and Economic Activity
This means that mobility will increase at a much slower rate than the previous downward trend, as seen in China. Despite some variation in the pace of the epidemic and responses, the struggles against the epidemic across countries still share important commonalities. As shown in Figure 6a, there is a significant, in fact surprisingly high, correlation between the GDP growth rate in the first quarter compared to the fourth quarter of 2019 and the corresponding mobility gap in these countries.
Applying the empirical relationship of the other 18 countries and using China's Q1 mobility data to estimate GDP growth, we get a GDP growth rate (QoQ) of -9.1%, very close to the officially announced figure of -9.8%. China is located in the lower left corner of Figure 6 (Left) due to the 2-month-long economic contraction in the first quarter of 2020, while many others only started contracting from mid-March. China can therefore be expected to move to the right and up and many others to move left and down towards the end of the second quarter, as the economic impact of the pandemic further intensifies.
More than 55% of the change in PMI in these economies can be explained by mobility. Second, to curb the epidemic, a significant part of closed businesses will not resume production and operation activities even with financial incentives. Third, faced with the liquidity shock and great uncertainty about future employment, and the health risks associated with high-contact activities, consumers' mindsets have changed and may not spend immediately after receiving cash assistance.
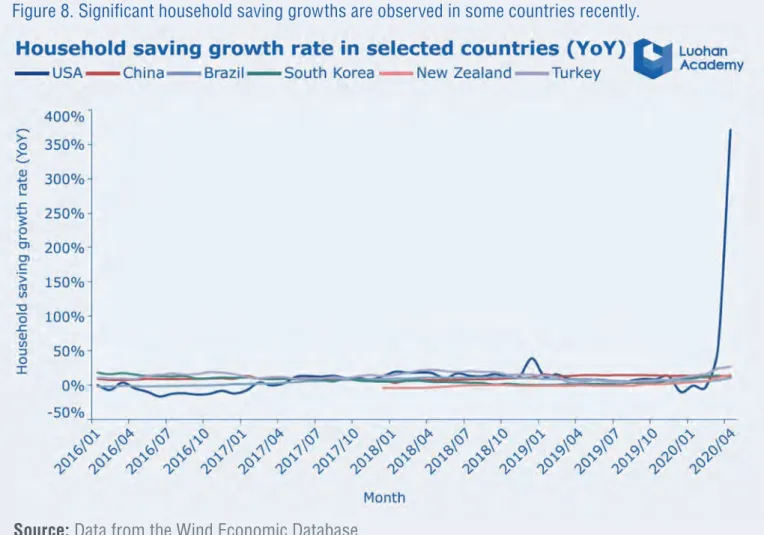
US household savings, for example, rose sharply from 8% in February to 13.1% in March and 33% in April, the highest level since tracking began in the 1960s. Human mobility is a good representation of the extent of the limitation in the availability of factors of production, so it is not surprising that its status is closely related to economic performance.

An Analytical Framework for The Pandemic Economy
Define and Measure Pandemic Economy
The essential feature of the pandemic economy is that the pandemic and the economy form an inevitable agreement, and the initial priority should be to contain the pandemic. Due to the distinct epidemiological characteristics, especially the high transmissibility, of COVID-19, if proactive isolation and quarantine measures are not taken very early, the virus will spread rapidly across high-density population areas. Meanwhile, the death rate from COVID-19 is significantly higher than that of seasonal flu.
Without active policy intervention, it is likely that COVID-19 would cause very high death tolls and disrupt the carrying capacity of health systems in most economies, particularly intensive care unit capacity, further weakening health system capacity. to treat illnesses unrelated to COVID-19 and cause social unrest. Second, the incubation period of COVID-19 is generally no longer than two weeks, with a few days on average. Therefore, in the early phase of an outbreak, the virus can be contained through testing, active interventions such as case isolation and contact tracing to interrupt the routes of transmission of the virus, effectively reduce and keep the number of infections low (effective reproduction number Rt <1).
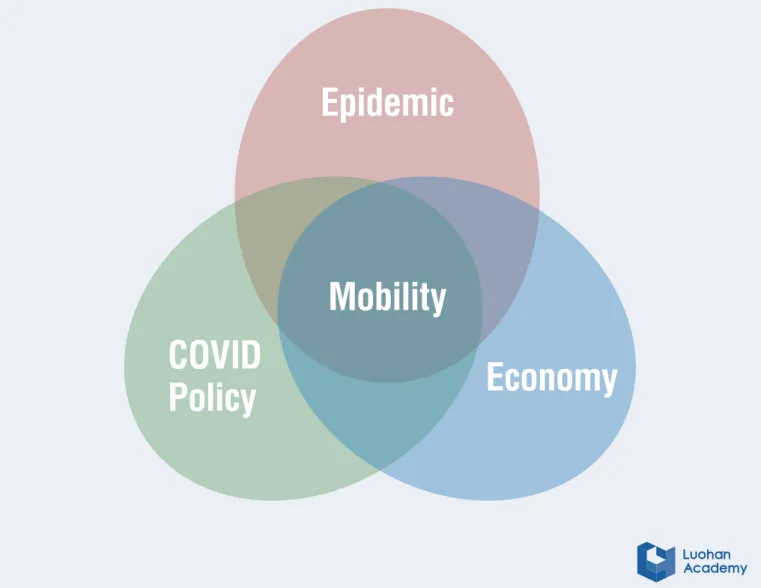
If containment is difficult or if the initial response is delayed, policies will focus on slowing the spread of the virus, reducing the demand for medical supplies due to COVID-19 disease, while protecting those most likely to develop serious illnesses related to the infection. , i.e. "flattening the curve". This way, the infected population can get better treatment without causing widespread social panic. The basic trade-offs of the pandemic economy can be described in the following simple triangular framework (Figure 9), in which mobility, which captures the impact of “distancing”, has become a key state variable for measuring the progress of the pandemic and the economy. Coping with a pandemic economy usually requires going through a painful process of severe reductions in mobility and economic activity before recovery.
The depth and duration of the contraction in economic activity largely depends on the timeliness and effectiveness of policy responses. We further propose that the pandemic economy will unfold in five stages and can be monitored and measured.
Epidemic
Mobility COVID
Early warning and preparation
Emergency response
Trough
Recovery
Vaccination
- Pandemic Economy Tracking (PET) Graphs
- Tracking the First Wave of Global Pandemic Economy
- Tracking the Second Wave of Global Pandemic Economy
- Characteristics of the economies in the third wave
- The Third Wave Of COVID-19
- Different responses and their consequences in the third-wave economies
In each graph, an estimate of the level of economic activity is in verti-. The higher this number, the lower the rate of spread of the virus in the population. The first day number refers to the days between the starting point (point A in Figure 10) and the date when the economy reaches the end of mobility due to the containment policies (Point B in Figure 10), i.e. the length of the reaction phase.
The economic damage in terms of lost revenue and production depends on the depth of the contraction and its duration. The purpose of the charts is to capture how contagious the pandemic is (measured by its doubling days) and how much economic activity is being reduced at each point along its path. And with strong stimulus packages, it is not hard to imagine that China will experience positive growth in the second half of the year.
Source: PET project team using data (as of 20 May 2020) from Google COVID-19 Community Mobility Reports, Apple Mobility Trends Reports and Wind Economic Database, European Center for Disease Prevention and Control, National Health Commission of the People's Republic of China and Johns Hopkins University. With the third wave of the pandemic, public health and economic crises may go hand in hand and develop into humanitarian disasters in these areas. Source: The PET Project Team using data (as of May 20, 2020) from the European Center for Disease Prevention and Control, the National Health Commission of the People's Republic of China, and Johns Hopkins University.
There is a strong possibility that the severity of the pandemic in these economies has been greatly underestimated. The first and second waves of the pandemic caused a deep slump in these revenue sources, and government revenues fell drastically. Many international investors already started withdrawing funds from developing economies in the early stages of the pandemic, leaving them with unprecedented financing gaps.
Due to special political and social conditions, developing economies in the third wave of the pandemic have shown greater diversity in epidemic control policies and their effects, compared to those in the first and second waves.

Asia
Source: PET project, using data (by May 20, 2020) from the Google COVID-19 Community Mobility Reports, the Apple Mobility Trends Reports and the Wind Economic Database, the European Center for Disease Prevention and Control, National Health Commission of the People's Republic of China and Johns Hopkins University. PET graphs of selected economies of selected African countries in the third wave of the COVID-19.
Africa
PET charts of selected economies in Latin America, many of which are at risk of major outbreaks due to the ineffective implementation of social distancing measures.
Latin America
Summary
Note: Sixteen economies with few COVID-19 cases (<150) and no clear trends in the pandemic economy are temporarily classified as Other. Therefore, addressing the pandemic economy urgently requires clarity in defining, measuring and monitoring its evolution. In this report, based on patterns of the pandemic economy revealed in different economies, we propose an analytical framework and the Global Pandemic Economy Tracker platform.
We will continue to monitor and update the global pandemic economy on a daily basis, and will soon add interactive features and elements to enable more stakeholders and experts to track and compare the diverse trends of the pandemic economy around the world on this platform. Imai et al., 2020, "Impact of Non-Pharmaceutical Interventions (NPIs) on Reducing COVID-19 Mortality and Healthcare Demand" [online; cited 2020 Apr 15]. Leung, 2020, "Transmissibility and severity of first-wave COVID-19 in China outside Hubei following control measures and second-wave scenario planning: an assessment of modeling impact," The Lancet, Vol.
Yu et al., 2020, "Estimating the novel coronavirus (COVID-19) reproductive number and potential outbreak size on the Diamond Princess cruise ship: A data-driven analysis." Data from the European Center for Disease Prevention and Control, National Health Commission of the People's Republic of China and Johns Hopkins University. Data from the European Center for Disease Prevention and Control, the National Health Commission of the People's Republic of China, and Johns Hopkins University, and the Wind Economic Database.
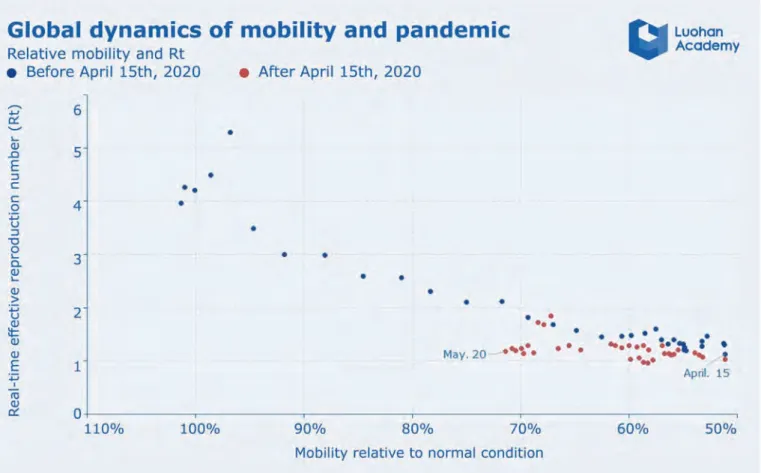
Data from Google COVID-19 Community Mobility Reports, Apple Mobility Trends Reports, Baidu Mobility Index, Gaode Traffic Index and Wind Economic. Based on pandemic data and the parameters of the serial interval distribution of COVID-19 (Zhang et al. 2020), Rt is estimated using the Bayesian framework (Wallinga and Teunis, 2004).
Summary Description of the Pandemic Economy phases along the PET Graphs
Luohan Academy will dedicate itself to collaborating with world-class social scientists and practitioners to jointly explore and shape consensus on how to embrace the social and economic transformations brought about by digital technology. The purpose of Luohan Academy is to serve society as a whole, address the most important global challenges, and keep an eye on the long-term future of humanity.
AGENCY
PRESENTATION