An equation model was used to estimate the load cases applied to each wheel for the entire lifetime of the system. 𝐼𝑡𝑜𝑡𝑎𝑙𝑖 Total inertia of wheel 𝑖 (𝑖 𝑖1 Transmission ratio of the first stage 𝑖2 Transmission ratio of the second stage 𝐼𝐷𝑇 Inertia of the drive train.
Formula Student
State of the art and Motivation
However, his work had the main purpose of helping with the design of the suspension system, and it is not enough to make an objective conclusion about the best powertrain concept. His findings led to the creation of the Wöhler curve (S-N – stress amplitude vs number of cycles to failure).
Objectives
Thesis outline
To comply with the Formula Student rules, Rules 2019, published on the website of Formula Student Germany;. The first was ruled out because it would interfere with the positioning of the car's battery, and the second would interfere with the geometry of the suspension, limiting its design freedom.
Initial concepts
- Concept 1
- Concept 2
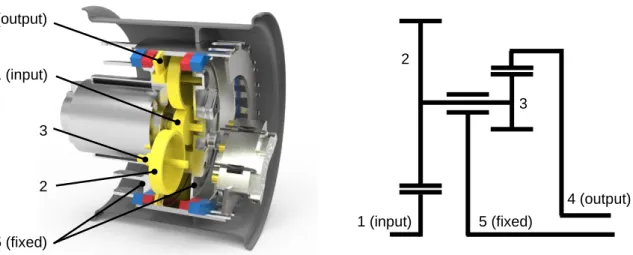
- Concept 3
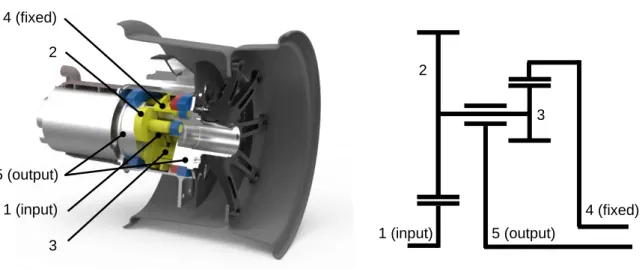
- Concept 4
- Concept 5
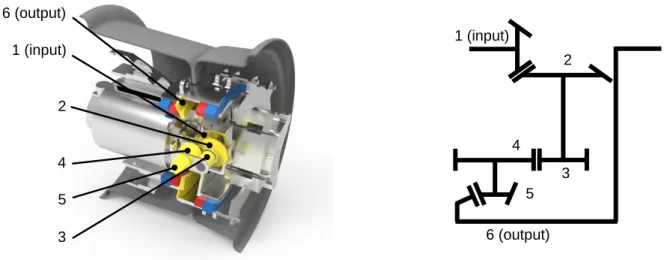
- Concept 6
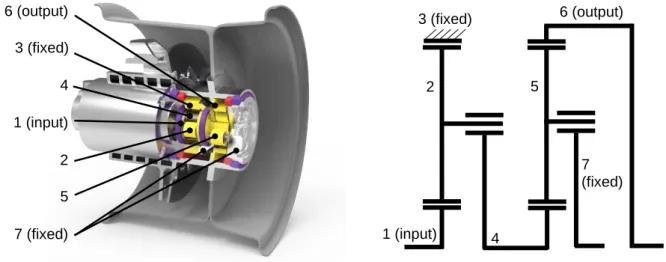
- Concept 7
- Concept 8
The braking system is made of a floating disc mounted on the hub, actuated by a caliper on the inside of the disc, mounted on the legs. The braking system consists of a floating disc mounted on the hub, actuated by a caliper on the outside of the disc, mounted on the fairing.

Transmission efficiency estimation
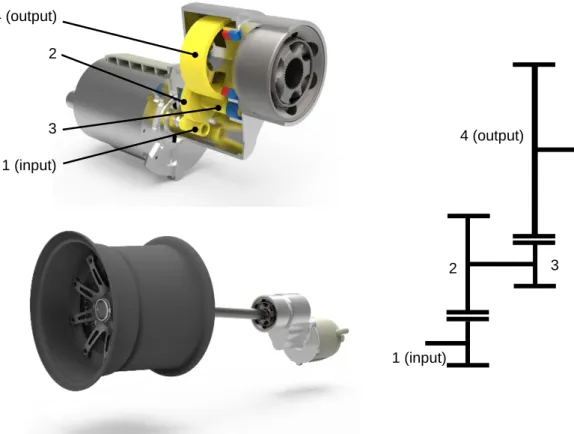
As with Concept 7, the engine is mounted on the lowest part of the chassis, but instead of tilting, the gear train was sized so that the axle could be aligned with both the engine and wheel axles. This equation also applies to helical gears, as long as the characteristic values of those gears are converted to those of the equivalent gear.
Data for simulation
As shown, the angular velocities of each rotating part are related to each other through the total gear ratio, GR, and are also related to the car speed by the tire radius r. It is a complex way to model the dynamics of a car, so in many cases, such as finding the absolute maximum possible performance of a car, simpler steady-state models are preferred.
Transient model
- Overview
- Tires
- Motor
- Vertical model
- Planar model
- Aerodynamics
- Sensors
- Driver inputs
- Validation
- Simulation results
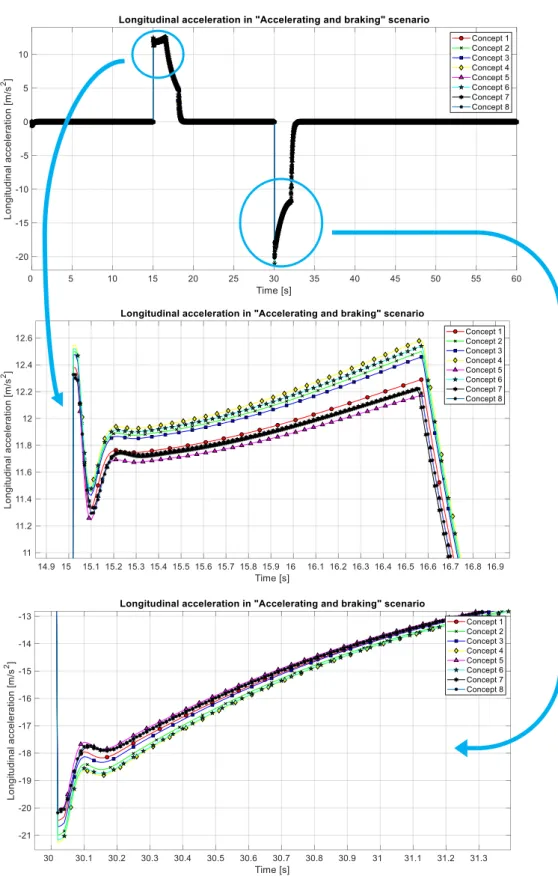
- Accelerating and braking
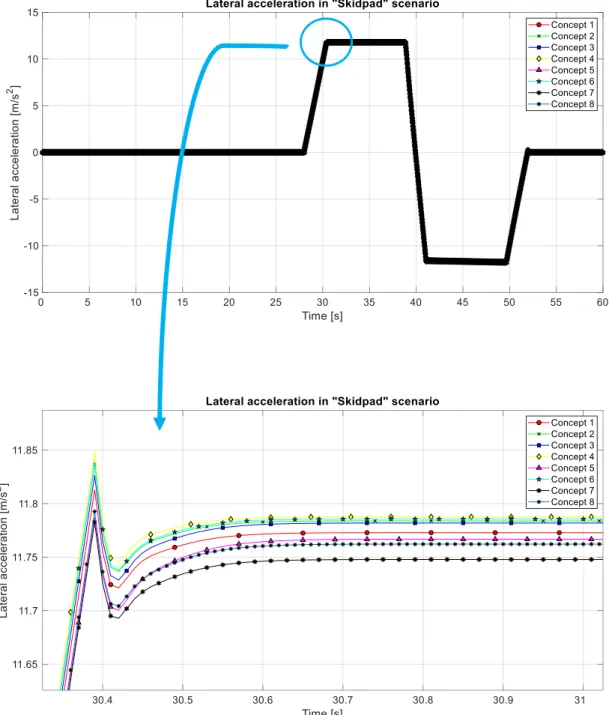
- Skid-pad
- Chicane
- Hairpin
- Slalom
- Simulation conclusions
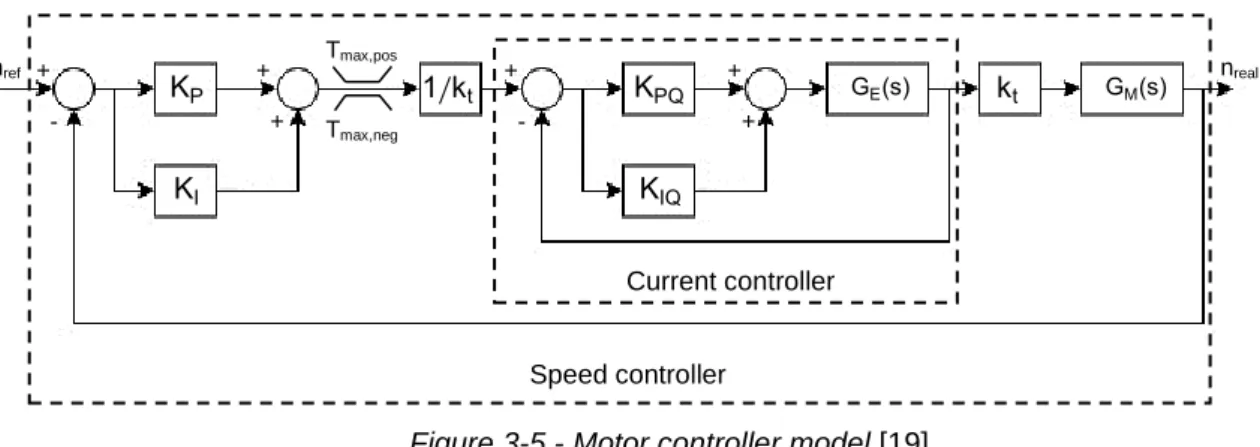
However, there is a variation in the torque limit of the motor, as shown in Figure 3-6. 1Accounts for the efficiency of the Concept 4 and the average efficiency of the battery and inverters. The references for the second stage depend on the transmission ratio of the first stage.
Current flows from the carrier of the first stage to the sun of the second stage.
![Figure 3-2 - Tire coordinate system [13]](https://thumb-eu.123doks.com/thumbv2/123dok_br/19768695.0/37.892.283.613.572.852/figure-3-2-tire-coordinate-system-13.webp)
Stead state model
Software overview
It is a steady-state simulator that uses a point-mass representation of the car, as shown in Figure 3-17. An equality model shows the absolute top performance of the car, as it considers that the car is always performing at its limits, be it the tires or the motors. For these reasons, the results extracted from this simulator represent an upper limit for the performance of the car.
Software inputs
- Motor
- Track layout
Since the software views the car as a simple point mass, the motor curve associated with that point must represent all sets of motors that exist in the actual car. It also lacks a way to limit the maximum available power in the car, as required by the competition rules. A similar map can be created, showing power instead of efficiency, representing the output power Figure 3-20 – Example of the 4th degree approximation, from the first row of the.
In testing, previous FST Lisboa teams have concluded that to have a good balance between lateral and longitudinal performance, the maximum torque of the front motors should be 50% of the maximum torque of the rear ones.
![Figure 3-19 – Efficiency map provided by the motor manufacturer [19]](https://thumb-eu.123doks.com/thumbv2/123dok_br/19768695.0/54.892.108.780.358.523/figure-19-efficiency-map-provided-motor-manufacturer-19.webp)
Results conversion
Where pheat is the heat distribution coefficient and the term √𝑘𝑖𝜌𝑖𝑐𝑖 is the thermal effusivity of the material. In the first stage, the reference torque and speed are 21 Nm and 20000 rpm, corresponding to the engine's limits. Lubrication is of great relevance in the resistance of the gears and must therefore be taken into account in their design.
The information in several tabs of the software is updated with the information calculated in "Rough Sizing".

Temperature estimation
Simulation results
- Converted results
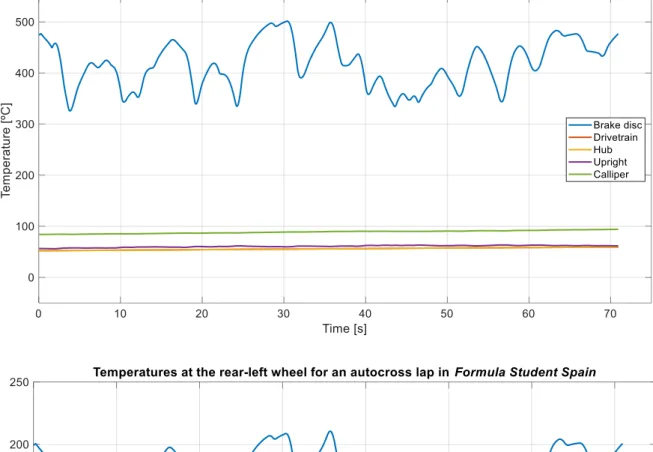
- Temperature
It represents the fourth round in a row, which justifies the high temperatures at the beginning of the plot. The car will then be tested at racing speeds to find the ideal suspension setup and tune the steering systems. Then the car will be exposed to the same types of loads, but in the competition environment.
Finally, there is a testing phase after the races, to help develop next year's car.
Drive train load cases
In the earlier days, it will be subjected to light testing, at low speed and low power, as there are multiple electrical and mechanical systems that need to be checked. To simplify the simulations, the initial phase of testing was neglected, since the expected loads are very small. For the remaining phases, it was assumed that the tests performed represented the dynamic events of the competitions.
With this information, together with the results of the steady state simulations, it is possible to estimate a total expected driving distance of about 760 km, with a total expected operating time of about 55 hours.
Suspension load cases
Although the thermal model of Section 3.2.4 estimates the temperature change over time in each component, the temperatures considered for structural design are the maximum experienced by each part, which are those shown in Table 4-4.

Fatigue
This criterion is represented by a straight line, as shown in figure 4-2, which is a conservative approach, so the consequence of its error is to increase the safety factor. If the maximum applied stress is less than 𝑆𝑒, it is considered that the component will have an infinite life, so fatigue will not be the cause of any failure. When the maximum applied stress is greater than 𝑆𝑒, fatigue will have an impact, which can be estimated by equation (4.4).
Based on previous experience of FST Lisboa, the Pugsley factor of safety model was used to define the factor of safety n for the structural design.
![Figure 4-2 – Fatigue diagram for various criteria of failure. For each criterion, points “above” the respective line indicate failure [5]](https://thumb-eu.123doks.com/thumbv2/123dok_br/19768695.0/69.892.242.642.313.603/figure-fatigue-diagram-various-criteria-criterion-respective-indicate.webp)
Stiffness targets
This tolerance serves two purposes, the first is a tolerance for machining and assembly, and the second is a limit for part deflections. Iterative design is a methodology based on a cyclical process with several successive design steps. Based on the results of the last step of each cycle, changes and improvements are made and the process starts again.
All system components must have sufficient resistance to withstand the applied loads during their expected lifetime.

Transmission design
- Gear material selection
- Gear design
- Lubrication
- Shafts
- Connection between stages
- Bearings
- Transmission FEA
The tooth involute is constructed as shown in Figure 5-2, with the base circle of the gear as reference. In Regime I, the developed oil film has a thickness comparable to the surface roughness of the gear. A high surface resistance is necessary due to the constant rolling of the bearing elements on the shaft, so the material chosen for the shafts is the same as for the gears, as well as the heat and surface treatments.
The outer diameter of those bearings was defined in such a way that there would be no impact on the resistance of the gear.
![Figure 5-3 - Comparison between “nominal” tooth profile with negative shifted (left), and positive shifted (right) profiles [38]](https://thumb-eu.123doks.com/thumbv2/123dok_br/19768695.0/77.892.249.644.105.460/figure-comparison-nominal-profile-negative-shifted-positive-profiles.webp)
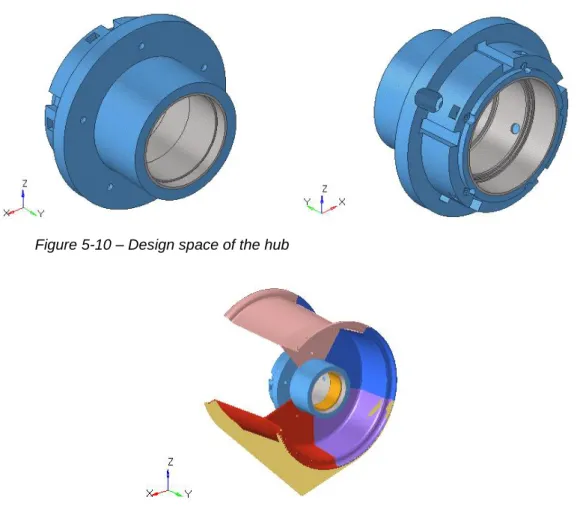
Hub (transmission housing)
The maximum displacement occurs in the second-stage shaft, which at first glance appears to be greater than the defined maximum deformation presented in Section 4.4, but the value shown does not represent the true change in center distance. The hub is subjected to all the load cases specified in Section 4.2, so fatigue must be considered in the analyses. The hub is a rotating part, but since the greatest loads come from the contact surface of the tire, it is difficult to determine the absolute interval of the maximum permissible displacements.
This leads to the choice of ZK60A magnesium alloy for the part, which is the one with the lowest density, resulting in the lightest part, but this choice is only final after checking its suitability in the analysis of section 5.5.
Upright
The allowable displacements presented in section 4.4 and the maximum allowable stresses shown in Table 5-3 were set as the constraints for the topology optimization, and the objective was set to minimize volume fraction, which is equivalent to the mass to minimize. The magnesium alloy was not considered for the upright because its strength is insufficient for this application. However, because there was a displacement constraint, all solutions have similar stiffnesses, which means that aluminum emerges as the best option, as it is the one with the lowest weight, although this choice is only definitive after it is considered in the analysis of section 5.5 has been checked.
The optimal result obtained in the simulation has a very complex shape, so it must be adapted to a solution that can be processed by any of the processes presented at the beginning of this chapter.
Brake system
To design the brake disc, it was divided into two parts (as shown in Figure 5-20): the part where heat is generated (contact with the pads) and the part connected to the hub. That part of the disc that connects to the hub was designed similar to the hub and upright. To ensure that each disc can be mounted on any wheel, they are all the same shape and thickness.
With that size limitation, only the number of pins and their material can be repeated.
Full system FEA analysis
The first was designed to have a large surface area of the disk, increasing the amount of energy dissipated by convection, but without compromising structural integrity, by using holes and slots. Nevertheless, the presented solution is still valid because it is easier to increase the stiffness of the suspension links. After applying this approach to all sectors, it is possible to estimate all stress values for all critical points for the entire load spectrum, allowing the use of the fatigue criterion from Section 4.3.
Although the axles cannot last the entire life of the car, their simple geometry allows for easy manufacturing of several spare parts.
Summary and conclusions
Future work
Based on this figure, Table D-1 shows the thermal constants used in the model of Section 3.2.4. The temperature sensors used in the car were mounted in the positions shown in Figure D-2. In the "Basic data" tab, enter the desired values of the gear module, the number of planets and the degree of accuracy in the corresponding boxes (Figure F-1).
In the “Rating” tab, enter the maximum torque and speed, the required service life, and load the load spectrum presented in Section 4.1 (Figure F-2).