The objective was to obtain the critical angle of attack, maximum lift coefficient, visualization of boundary layer separation flow patterns and swirl frequency. Level and level flights were performed at various speeds to determine the lift coefficient of the aircraft as a function of the angle of attack.
Nomenclature
List of Abbreviations
Introduction
Motivation
- Aim of the thesis
This is due to the complexity of the phenomenon and available tools to understand it. An accurate understanding of an aircraft's stall characteristics from an early design change will prevent later and costly changes to the design.
Thesis Outline
In the present work, the critical angle of attack, maximum lift coefficient, boundary layer flow separation pattern on the upper surface of the wings and swirl frequency were calculated using CFD. Identification of the maximum lift coefficient, critical angle of attack and zero angle of attack using CFD and evaluation of the results with data obtained from the steady and level flight test and an additional test where the critical angle of attack was achieved;
Literature Review
- Stall of an Aircraft
- An overview on Stall
- Stall and Spin definition
- Factors that affect stall behaviour of an aircraft
- Aerofoil Section
- Wing Planform
- Propeller Slipstream
- Unsteady Flow features in stalled wings
- Turbulence
- Stall Mushroom Cells
- Computational Fluid Dynamics
- An Overview on CFD
- CFD in aeronautical industry
- Mesh Generation
- Turbulence modelling
- Cost of Turbulence Modelling
- CFD approaches in the present work
The diagram of the flow separation progression for different wing planforms is shown in Figure 2.10. Nichols and Nelson stated that: “The problem is inherent in the construction of the turbulence models.
![Figure 2.2: Wool tufts flight test experiment [10].](https://thumb-eu.123doks.com/thumbv2/123dok_br/19768468.0/31.892.523.780.467.648/figure-2-wool-tufts-flight-test-experiment-10.webp)
Mathematical Model
Navier-Stokes Equations
Assuming a density-weighted (Favre) time average, where each dependent variable Φ(x, t) is decomposed as Φ = ˜Φ + Φ", the Favre-averaged NSE is defined as follows:
Turbulence Models
- Eddy Viscosity Models
- Two-Equation Models
Detached Eddy Simulation (DES)
This region is never entered by turbulence or vorticity, except when generating shocks. The mesh should not be too fine to not activate LES in this region, as pure RANS calculations are assumed in this region. The VR, in the wall-normal direction, the standard viscous sublayer, buffer layer and log layer are made.
The boundary layer in the OR region is modeled with turbulence, without activating the LES equations. This region is divided into a viscous region (VR), a focus region (FR) and a departure region (DR). LES is activated in the focus region, the separated flow must be resolved and the grid spacing ∆0 must be set.
In the departure area the grid resolution can be higher than ∆0, which returns to a quasi-stable RANS. The last regions are the gray areas, which are the zones between all the regions mentioned above, i.e. the borders between regions. This motivated a relatively profound change in the shielded DES and delayed DES formulation, as the DES length scale limiter now depends on the solution, rather than just the grid [83].
![Figure 3.1: Different flow regions of DES [76].](https://thumb-eu.123doks.com/thumbv2/123dok_br/19768468.0/54.892.275.646.251.508/figure-3-different-flow-regions-of-des-76.webp)
Computational Fluid Dynamics of the Slingsby Firefly
- Geometry preparation for the meshing process
Slingsby CAD Model
A tolerance of 0.001 m was used to close the non-bonded surfaces and to preserve the general features of the model. The aim is for the geometry to have only red and blue curves, this was achieved with the Slingsby Firefly model and is shown in figure 4.2.
Geometry division into parts
This allowed for different mesh sizes on the model and for local refinement, a particularly important feature when the focus of the mesh is only on one part and not on the entire geometry.
Computational Domain
- Meshing Process
- Numerical Solving
- CFD-Quantities of interest
- Flight Tests
- Flight test conditions
- Straight and Level flight test
- Stall angle of attack flight test
- Flow visualisation flight test with wool tufts
- Buffet Frequency flight test
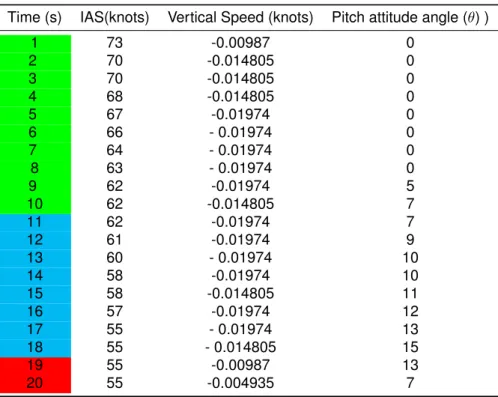
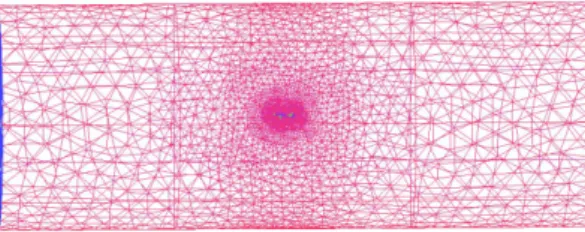
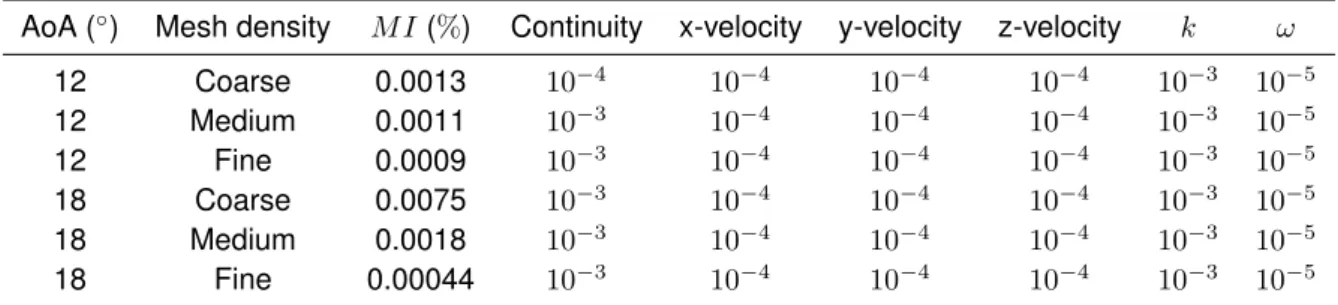
Due to the viscous nature of the flow, prism layers were then calculated to represent the boundary layer. The thickness of the boundary layer was calculated assuming a turbulent boundary layer in a flat plate. The simulations were performed with a flow speed of 31.9 m/s, which is 62 knots of the aircraft's stall speed for a cruise configuration, i.e. flaps and bank angle is 0◦, this is shown in table 4.2.
In the first versions of the ANSYS Fluent software, the criteria for choosing between the two solvers was flow compressibility, i.e. the pressure-based solver for incompressible flows and the density solver for compressible flows. The governing equations can be linearized in an explicit or implicit way, i.e. the unknown value in each cell is calculated with both existing and unknown from the neighboring cells, or the unknown value in each cell is calculated from existing values of the neighboring cells, respectively. In order to obtain a qualitative evaluation of the CFD results, several flight tests were performed.
Thus, lift was calculated by the weight of the aircraft minus the vertical component of thrust. The left wing of the Slingsby Firefly was covered with 5 mm 15 cm thick tufts of fur in a structured pattern, i.e. the tufts were spaced vertically and horizontally 24 cm. The error associated with the measured vertical acceleration is not specified in the technical specifications of the sensor.
Results
Mesh Sensitivity Analysis
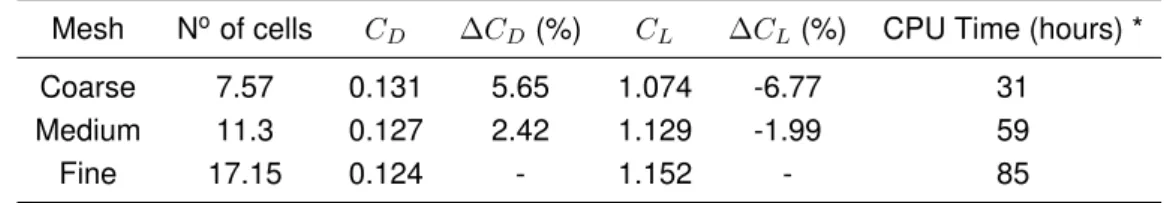
The coefficient of lift (CL) and drag (CD) results and their corresponding deviation on the fine grid for AoA = 12◦ and 18◦ are shown in Tables 5.2, 5.3 respectively. Results from flow calculations with an AoA = 12 ◦ for the drag coefficient show that in general the coarse and medium mesh overpredict the drag coefficient. The lift coefficient has an opposite trend, the coarse and fine mesh underpredict the CL value compared to the fine mesh, however the deviation is higher for the coarse mesh.
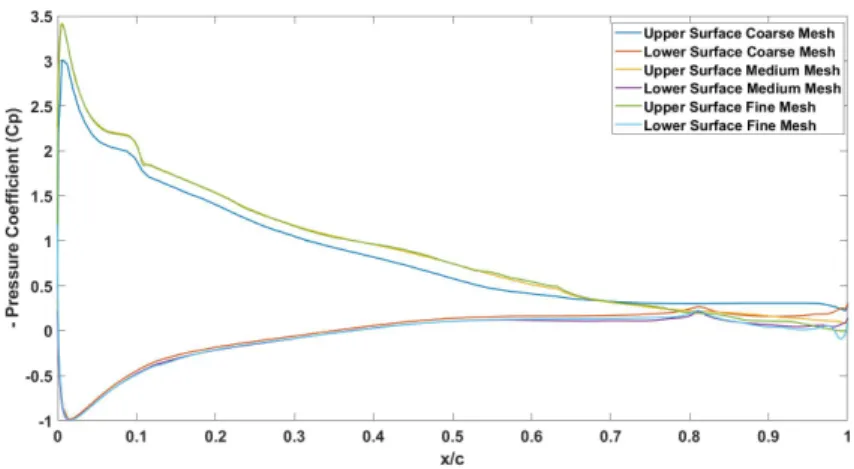
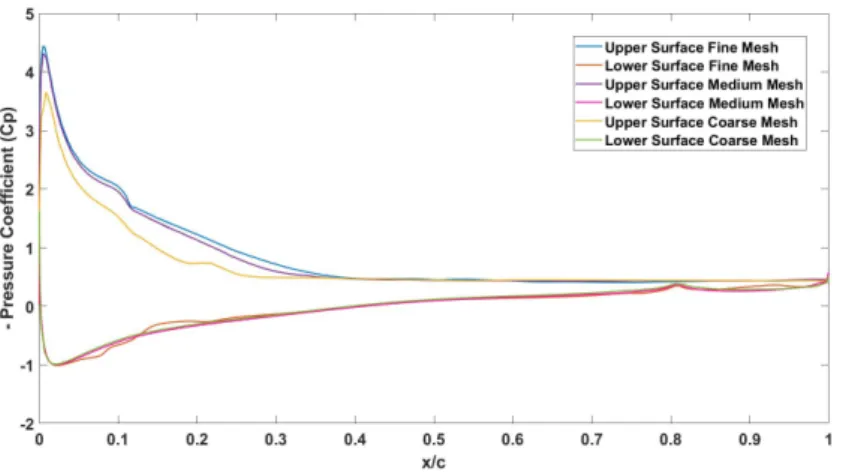
For the CFD solution with AoA = 18◦ the same trend is verified for the drag coefficient. For AoA= 12◦ (see Figure 5.1), the coarse grid predicts the region where flow separation occurs, which is why the lift coefficient was well below predicted. It is noted that the location of this structure has a similar span location for the medium and fine meshes, in contrast to the coarse mesh where this structure occurs further down the span.
Moreover, the area of attached flow is smaller for the coarse mesh than for the medium and fine mesh, this explains why the lift coefficient is lower than the fine mesh. The negative pressure coefficient (−Cp) as a function of the normalized chord (x/c) was calculated for each mesh density for the two different AoA = 12 and 18◦. Not only because of the agreement between said results, but also because of the computational time required for the flow calculation to converge.
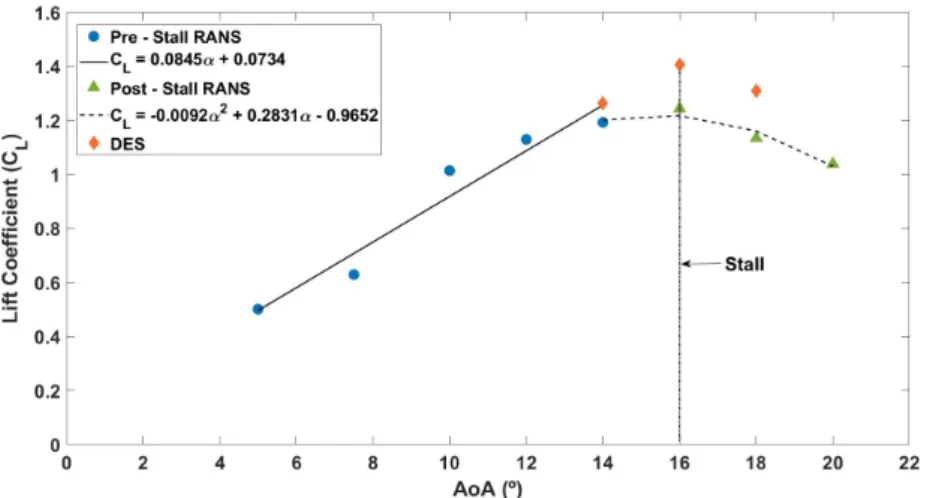
Comparisson between CFD and flight tests
- Lift curve, critical angle of attack and maximum lift coefficient
- Flow Visualization
- Vortex Shedding Frequency
The values of the lift coefficient are higher for the DES than the RANS solutions. Furthermore, an accurate representation of the boundary layer in the engagement process was only performed for the main lifting device, i.e. the wing. The total drag is the sum of the induced drag (Di) and the profile drag (Dprof ile).
Similar boundary layer separation patterns to those obtained from CFD calculations were observed in the flight test. The results obtained from the CFD calculations were compared with the stall frequency of the aircraft when approaching the stall. Therefore, the flap frequency should be similar to the static pressure arm movement frequency (fPstatic) and the lift coefficient.
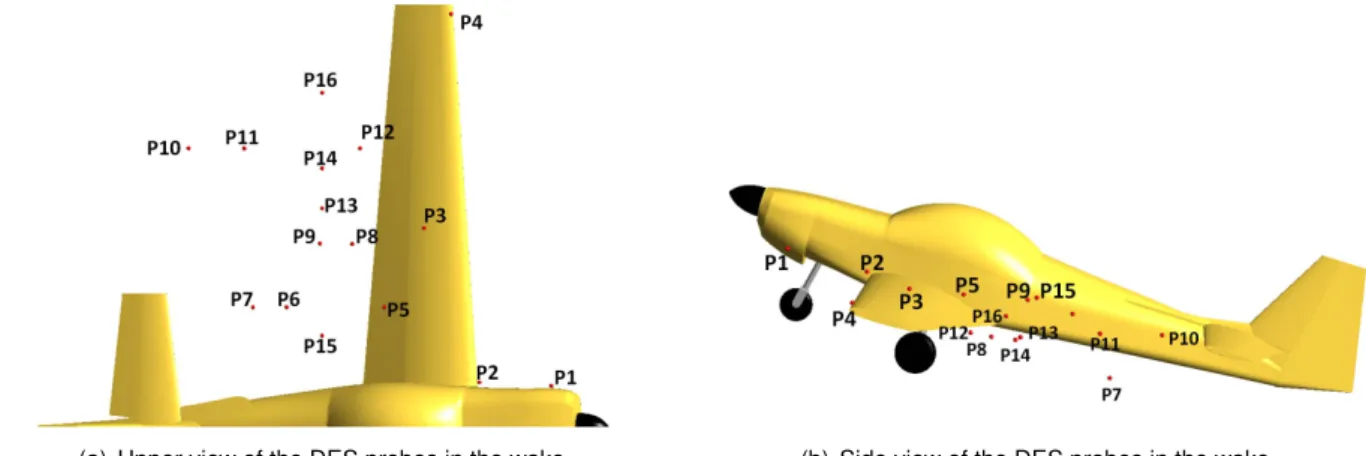
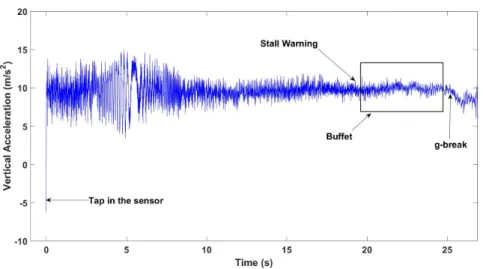
The FFT was applied to the static pressure for the monitored probes and the lift coefficient of the three AoAs studied. The first second of the first stall performed at Slingsby is shown in Figure 5.27. The different peaks in the FFT are due to signal noise from some aircraft vibration sources.
Conclusions
Future Work
Although the objectives of the present thesis have been achieved and the results are promising for a first attempt, the author suggests some improvements that would ultimately yield better overall results. Due to the results obtained from the RANS steady flow calculations, which under predict the lift coefficient, the aircraft model in the future should have the propeller modeled and the rest of the aircraft components accurately represented by a finer mesh. This would determine if the lift coefficient underprediction was due to the selected turbulence model, the lack of a propeller, or both.
In addition, the mesh density should be improved to obtain an accurate representation of the drag of steep bodies, which would allow better drag prediction. It is recommended to use different time steps and grid density in the focus area to understand how sensitive the solution is to changes in these two parameters. The completed flight tests should be repeated and with greater flight volume the errors associated with the tests should be calculated.
The measurement of angles during flight must be accomplished by a method other than the use of an inclinometer, which represents a major source of error. The flow visualization technique using wool cuffs should be repeated but with slightly smaller length to capture more patterns of the boundary layer separation in the upper surface of the wing. Additionally, due to the noisy nature of the signal recorded by the accelerometers, filters must be applied to the signal.
Bibliography
On the development of flight test equipment in connection with the rotation of the aircraft. Advances in Space Sciences. An experimental investigation of the circumstances which determine whether the motion of water will be direct or tortuous, and of the law of resistance in parallel channels. Philosophical Transactions of the Royal Society of London. And International Conference; 1., Advances in DNS/LES: Direct Numerical Simulation and Large Eddy Simulation; 1997; Ruston; LA, pages 137–148.
Unsteady motions and detached eddy simulations of flow around a circular cylinder in ground effect. Journal of Fluids and Structures. Spalart. Physical and Numerical Upgrades in the Detached Eddy Simulation of Complex Turbulent Flows, Part 65, Pages 239–254. Cfd simulation of flow around angle of attack and sideslip angle vanes on a bae jet stream 3102 – part 1.
Unsteady detached-vortex simulation (des) of the jetstream 31 aircraft in one engine inoperative (oi) condition with propeller modeling. Aeronautical Science and Technology. Cfd simulation of flow around angle of attack and sideslip angle fins on a bae jetstream 3102 – part 2. Assessment of grid convergence properties for computing the flow around the kvlcc2 tanker in unstructured grids.
Appendix A
Mesh Sensitivity Analysis
Mesh Size
Mesh Quality
Pressure Distribution
Appendix B
Wool tufts flight test
Vortex Shedding Frequency
![Figure 2.5: Number of stall accidents reported in the AOPA Institute report [28].](https://thumb-eu.123doks.com/thumbv2/123dok_br/19768468.0/33.892.239.656.382.617/figure-number-stall-accidents-reported-aopa-institute-report.webp)
![Figure 2.6: Typical lift and drag curve of an aircraft (Adapted from: [31]).](https://thumb-eu.123doks.com/thumbv2/123dok_br/19768468.0/34.892.222.661.112.365/figure-typical-lift-drag-curve-aircraft-adapted-31.webp)