At the end of the article, all forms of measurement are proposed – current income, consumption mitigation (permanent income), productive. The first section looks for parameters to define the middle class; it compares the level and changes of Brazilian income distribution to those found around the world. The fourth section addresses the sustainability of the Brazilian middle class, with analysis of stocks of productive assets and consumer goods.
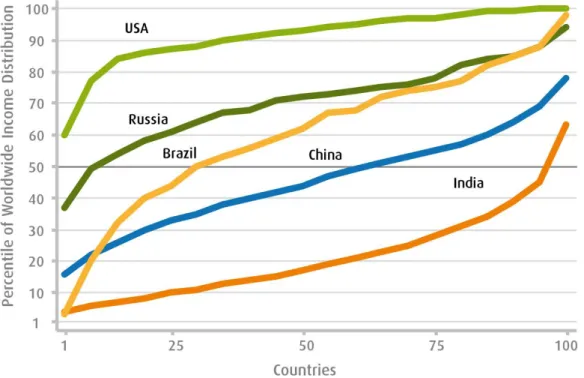
Particular emphasis is given to the main channels of influence of such policies in determining the size, resilience and level of prosperity of the Brazilian middle class. Brazil's Gini coefficient, although one of the eighteen highest among 155 countries in the world, is relatively close to the Gini coefficient, which measures income inequality between countries. In 2012, Brazil's GDP per capita (adjusted for purchasing power parity) was 93.7 percent of the global average.
By comparing current and permanent incomes, we can measure the sustainability aspects of income distribution.
Economic Classes Performance and Forecasts
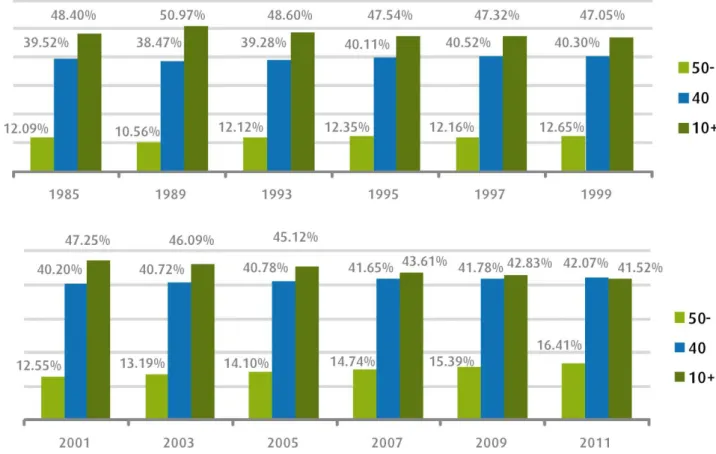
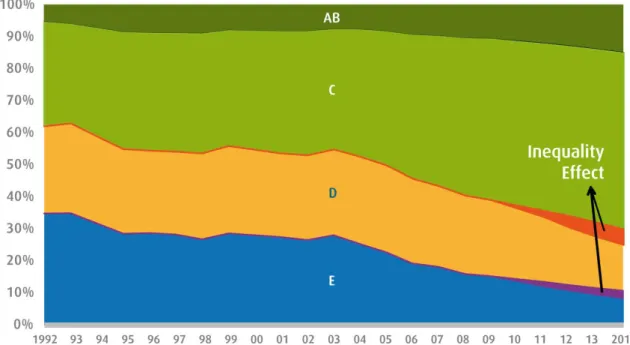
Our forecasts take into account changes in inequality; specifically, we forecast on a differentiated basis growth for each income subgroup and regional trends for each of the 27 Brazilian states. If the state-level rates of inequality reduction observed since 2003 are maintained, the proportion of individuals in class C will have increased from 37.56 percent in 2003 to 56.89 percent in 2012. The observed share of class C after the release of PNAD 2012 it was 55.47 percent (a total of 42 million new Class C members since 2003), a margin of only 1.42 percentage points lower despite the slowdown in GDP growth, which leads to a revision of predictions for the future.
In a neutral scenario with no changes in the income distribution conditions within the states, the middle class will increase to 56.22 percent of the population in 2014. However, if growth in income were to go hand in hand with the decrease in inequality, the new middle class would reach 58.68% of the population. There were also changes in the sampling weights in PNAD and revision of the population forecasts by IBGE.
Note that the growth rates of the AB class are already higher than those of the C class and we predict that this difference will increase in the future. In the coming years we will discuss the new AB class, just as we discuss the new C class today. The figure shows the composition of economic classes from 1992 to 2014, adjusted for changes in inequality.
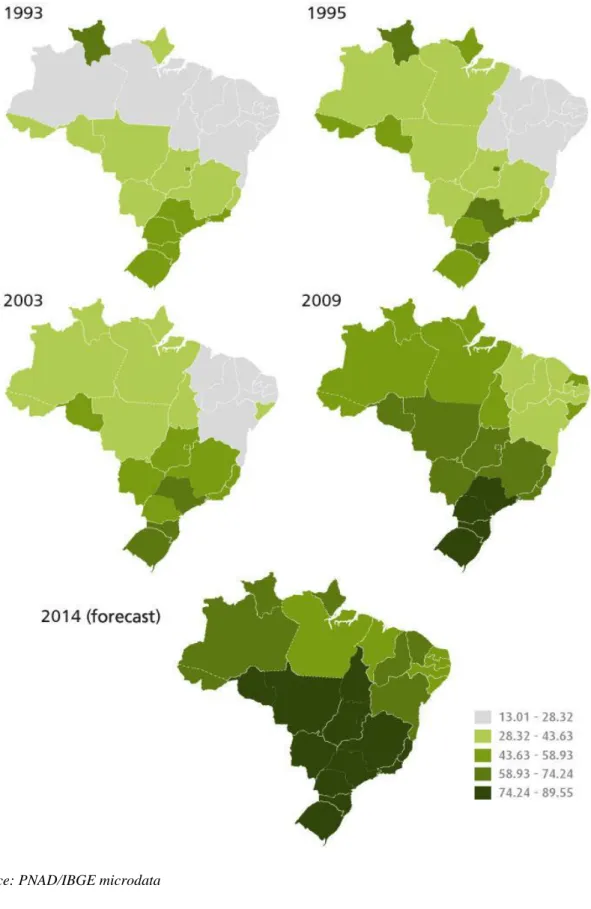
In the same figure, we show the same predictions accompanied by a darker area, which indicates the specific effect of maintaining the level of inequality within states maintaining the growth rates among Brazilian states. That is, we contrast the scenario of uniform income variation within states with one that predicts changes in inequality within states. The 2014 forecast showed that in all states south of the northeastern and northern regions, at least three-quarters of the population is in the new middle class or above.

Sustainability of Living Conditions
Choice of variables - We examined the wide range of information related to the ownership and use of assets based on PNAD data, using a model of variable selection based on the level of statistical significance in explaining household income per head of the population. This assumption therefore excludes elements of intra-household inequality that are certainly important for the well-being of many individual Brazilians. In terms of statistical significance and explanatory power, the number of toilets, followed by access to mobile phones, comes well ahead of the reference person's years of education – typically the highest explanatory power in studies of income inequality and poverty.
In our interpretation, we will identify variables that are more related to generating income. The exercise helps to measure the structure of the model that assigns the concept of equivalent income and its elements in terms of consumption potential and income generation capacity. Results show that despite the strong growth in income from social programs and pension payments linked to the minimum wage, the growth in labor income is close to the significant growth in total income (4.72 per cent) in the period 2003-2009: average labor income increased 4.61 percent per year per Brazilian, equivalent to 76 percent of the average income in the country, providing a sustainable basis for living conditions beyond official income transfers.
The first component extracted from a principal component analysis would account for a maximum amount of the total variance of the observable variables. The second extracted component would account for a maximum variance of the group of data not derived from the first component. Under ideal conditions, this means that the second component would be correlated with some of the observable variables that do not show strong relationships with the first component.
The vector captures two items that we also linked to the production as education of the household head and his/her spouse and the possession of goods linked to ICT such as landline, mobile phones and computer connected to the Internet. The second vector consists of variables about the housing quality such as the per capita number of rooms, bedrooms and toilets, the number of members in the household and the presence of teenagers as well as variables such as education quality of the children between 7 to 14. years old and 15 to 17 years old, as well as the type of family structure. Finally, the third factor can be interpreted as effective generation of income, consisting of the participation of income from work in the total income, the type of social security/insurance (public and private, etc.) and work status (private employee, unemployed), self-employed , etc.) of the household head.
Class Resilience: Updates and Volatility
Recalculation of real GDP growth using people's cost of living captured by the National Consumer Price Index (INPC) would give an average GDP growth of 4.4 percent per year instead of the 2.6 percent for the period 2003 -2013. Particularly relevant to the study of the middle class, referring to the median income is a simple and direct way to summarize the effects of changes in average income and income inequality. In other words, in this period the 'median Joe' in the middle of the Brazilian income distribution experienced growth rates similar to those of the Indian economy.
Quantile Regression - We provide an update of the aggregate movements across the per capita income distribution between the years of and 2014, characterized by a discrete variable from each year using PME data. The objective was to separate the macroeconomic effects captured by the year variables of the changes across the income distribution from specific socio-demographic characteristics observed. The cumulative real growth rate per capita peaks with a value of 17.8 percent at the bottom 5% and reaches values above 14.7 percent for the bottom half of the income distribution;.
To better understand the nature of the new Brazilian economy after significant social progress in the last decade, we diagnose details of the life of different economic classes. The profile of the middle class in terms of youth and gender corresponds to the general population. The perceived quality of private aspects of life, such as the perceived level of income, the quality of food consumed and the conditions of the household, are higher for the middle class than in the general population.
However, the perception of the middle class about the problems of infrastructure and public services such as transport, sports and recreation, education and health, is more on quality than on coverage of these services. The self-perception of the entire middle class by Brazilians is 62.76 percent, higher than the 58.68 percent in the 2014 forecast. In the latter, the C class would reach 58.68 percent of the Brazilian population in 2014, number closer to the subjective forecast number, while 66.49 percent of the population together would be in B and C classes.

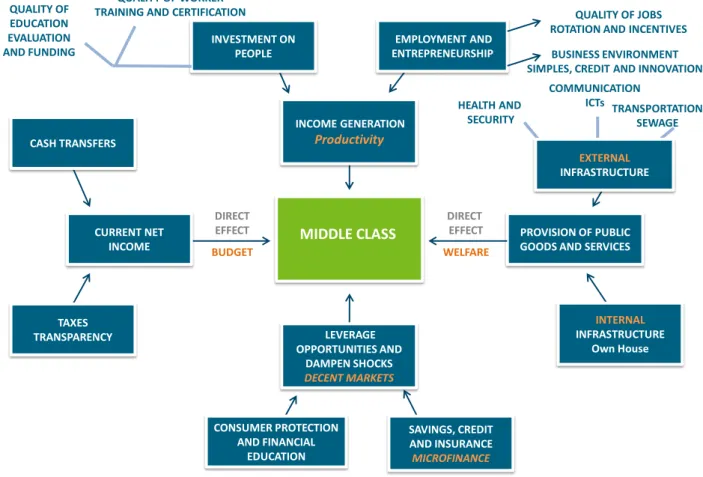
Public Policies for the New Middle Class
There is a specific lesson about the labor income increasing with the productivity (efficiency wage) in the case of the loan officers, who can even triple their salary depending on the portfolio performance. Social goals complement this movement, which includes efficiency from the private sector to the public sector through a mock market, since there are no prices. The education goals of the Brazilian Education Development Index (Índice de Desenvolvimento da Educação Básica - IDEB), of the Movement All For Education (Movimento Todos Pela Educação) and of Dakar are good examples.
Consumer credit and social benefits are part of the scene of Brazil's new middle class, but play a secondary role. Indifference to education policies in the past has put our economic elite in the worst possible world. On the other hand, the middle class perceives coverage problems in public infrastructure and public services, such as transport, sports and leisure, education and health, usually less than the lack of good quality perceived in the same services in question.
Consolidating decent markets where private decisions are made is another goal of public action. 17In relation to the colors of the Brazilian flag, this is the interpretation of playful meanings. An evaluation of the measurement of income and expenditure in Brazilian household surveys: POF X PNAD.
The same does not happen with the educational variable of the reference person, because every family has at least one reference person.). Among those currently attending school, 73.4 percent of the elite attend private institutions versus 3.33 percent of the poor. The gradient in the case of having a health plan and a credit card is 4493 percent and 102 percent, respectively.
The elite are 1139 percent more likely to have incomes than the poor by the end of the month. There are problems with coverage and perceived quality in health services, which are at the top of Brazilians' list of concerns18.