For the analysis of timetable quality, an adaptation of a methodology from Souza et al. This section will present a brief description of the significance of this work, explaining its rationale, objectives, methodology used and a schematic framework of the main tasks.
MOTIVATION
The importance of public transport in nowadays society
With recent laws affecting levels of pollution and also with the levels of congestion verified in larger cities, an efficient public transport system can be one of the most crucial factors in reducing both pollution and congestion. If public transport covers the whole city, with adequate timetables, and with appropriate opening and closing hours, people will be increasingly inclined to leave cars at home, reducing congestion and pollution.
ITS as a mean of improving public transport operation
According to Giuliano and O'Brien, public transportation funders and providers see ITS technology as a way to improve efficiency, increase service quality, and ultimately attract more choice riders. Public transport agencies also lack the profit motive that often drives the adoption of innovation in the private sector (Giuliano and O'Brien, 2004).
The need of having performance assessment of ITS applications
Over the past 30 years, public transit agencies have used software, hardware, and communications technology to improve service. The expected benefits of ITS for public transport are great, but public transport has some inherent barriers to successful implementation.
OBJECTIVE
Performance assessment is a type of analysis carried out after the project is already in use and consists of an overview of the main differences between a scenario with ITS and another without ITS. In other words, comparing a scenario with ITS and a scenario without ITS will enable conclusions about the performance of the ITS, which is the purpose of this thesis.
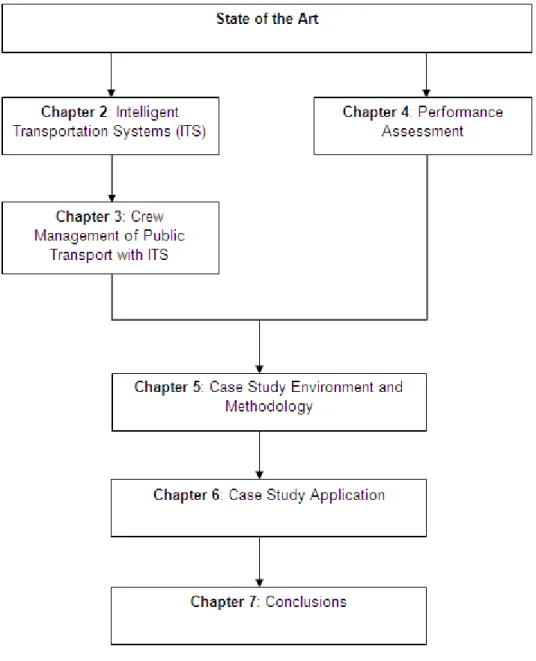
STRUCTURE OF THE DISSERTATION
By comparing the results obtained on key performance indicators related to the crew list problem on both months analyzed, and taking into account the respective importance of the respective indicators considered, one will be able to conclude on the quality of schedules with and without the ITS.
INTRODUCTION
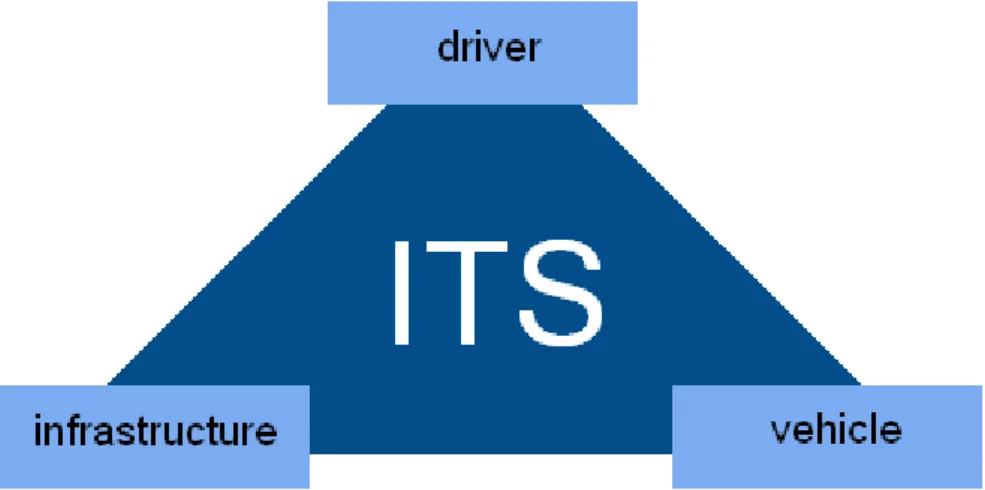
DEFINITION OF ITS
Also interesting is the fact that ITS has different definitions depending on the country they refer to. China – ITS has been defined as ―based on electronics, information, communication, computers, GIS (Geographic Information Systems) and GPS (Global Positioning Systems).
TYPES OF ITS
Intelligent infrastructure
- Roadways
- Public Transport
- Management and Operations
- Freight
Some of these techniques can also be used to address operations during planned special events, as referred to in the highway management section (section 2.3.1.1.2). With these systems, we help to increase the speed of goods delivery (and patient transport, in the case of the example with the ambulance fleet), with a reduction of operating costs.

Intelligent Vehicles
- Collision Avoidance
- Driver Assistance
- Collision Notification
On the terminal side, ITS cargo terminal processes can be applied to improve operations at cargo transfer stations, "using information technology to expedite procedures often performed using paper records" (U.S. DOT, 2008, p. 171). Driver assistance systems are used to assist the driver with multiple tasks on the road, such as driving tasks, navigation, speed control or parking. A table like the one in the collision avoidance section is shown below for driver assistance systems, also based on information from the US.

PURPOSE OF INTELLIGENT TRANSPORTATION SYSTEMS
In the same letter he also writes about the benefits of deploying ITS systems, which can also be associated with their objectives. Mitretek Systems goes for a broader definition of ITS objectives, but focused on the same 3 items mentioned above. In fact, the two definitions presented earlier are a bit limiting for the variety of ITS available, a limitation that is not verified in the definition of objectives by Mitretek Systems.
RESUME OF THE CHAPTER
Improving road safety by reducing the risk of road accidents (reduction of potential accidents). Therefore, this definition should be kept in mind for the development of this thesis when the goals of ITS are mentioned. Finally, the main objectives of ITS were presented according to the opinions of three authors, being the most correctly defined by Mitretek Systems, which divides the ITS objectives into six main themes, from increasing productivity to improving traffic safety.
MANAGEMENT OF PUBLIC TRANSPORT WITH ITS
SCHEDULLING OF VEHICLES (AND DRIVERS)
In other words, the main objective of a scheduling problem is to construct vehicle and crew schedules, satisfying a certain set of problem constraints, optimizing some operational criteria such as the number of vehicles, the size of crews (or the number of drivers), or extra minutes of duty (Rodrigues, de Souza and Moura, 2006). In a case study paper on a limousine rental company, Laurent and Hao defined the objectives of the scheduling problem as the efficient use of both types of resources, crews and vehicles, which has been the subject of ongoing research since the 1950s. (Laurent and Hao, 2007). However, it should not be forgotten that a number of conditions and constraints must be met when working on planning problems, which are obviously different from case to case.
CREW MANAGEMENT
- Crew Scheduling and Crew Rostering
- Benefits of Crew Management applications
- Restrictions
- Methods and Models
- Examples of application
The latter takes the solution of the crew assignment problem to build another work schedule for a longer period, for example a month. For the crew scheduling problem, a hybrid column generation model was developed using both techniques. On the airline side, the airline crew scheduling problem (CSP) is one of the most difficult combinatorial problems known.
IMPORTANCE OF ASSESSMENT ON ITS PROJECTS
The first is an inventory of the system that has been deployed, which is called "deployment tracking" and assesses the actual level of implementation against the plan. The second type of evaluation is an assessment of the changes in impacts, such as travel time and accident rates, of selected characteristics relative to pre-deployment conditions. In other words, this second type of evaluation is an overview of the main differences between a scenario with and without ITS.
MEASURING PERFORMANCE
Benefits of measuring performance
Performance measurement benefits a variety of entities, from the business to the potential user. Monitoring processes, identifying existing problems and enabling process improvements in the organization;
Some approaches to the performance measurement problem
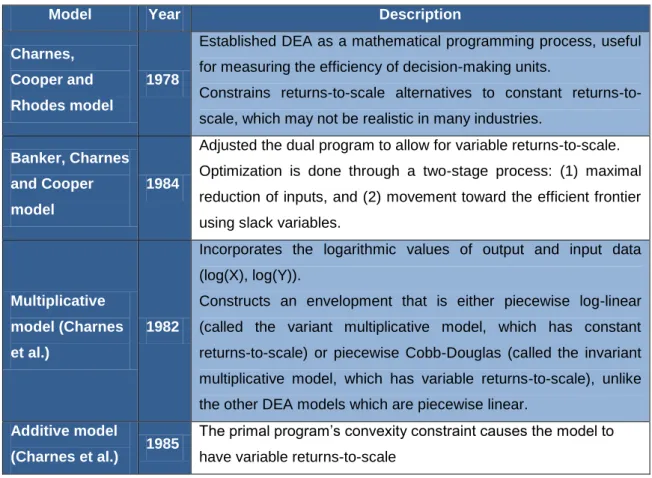
The scheduling model attempts to maximize the efficiency of a service unit by comparing it with the performance of a group of similar service units providing the same service (Husain, Abdullah and Kuman, 2000). Comparison of individual agencies to best practice agencies – unlike regression analysis that compares each agency to the average agency, DEA compares each agency to the best practice agency;. If all these agencies happen to be poor performers, then the comparison will not be close to the optimal performance for that area (Nakanishi and Falcocchio, 2004).
MEASURING PERFORMANCE ON PUBLIC TRANSPORT SYSTEMS
Measuring performance of crew management systems
Public transport performance assessment is divided into efficiency (do things right) and effectiveness (do the right things) components (Yu and Fan, 2009). Acceptability is related to the qualitative aspect of the schedule, referring to the likelihood that the resulting schedule will be accepted by the drivers. Performance assessment is usually made to assess the performance of the whole public transport system and not just the assessment of a part of it, such as crew scheduling and scheduling.
CARRIS
History
In 1900, the implementation process of the new system began with the new track construction and the construction of an electricity plant capable of supplying the energy necessary for its normal operation. A further renovation of the bus fleet took place between 2004 and 2005, purchasing a total of more than 300 vehicles, which allowed the average age of the fleet to be reduced to 7.4 years. Most recently, in 2008, the company achieved 64.6% on a customer satisfaction survey, which shows that the majority of passengers are satisfied with the service provided (CARRIS, 2011).

ITS at Carris
Ticket prices, a network map, information about waiting times, ticket sales points and other information are also provided on the company's website (CARRIS, 2011). This system also records all ticket sales made and transmits them to the center, enabling better management of the ticketing system. Most of the company's buses are equipped with video cameras that are used to identify possible situations where help is needed in a faster way, offering a high-quality security system.
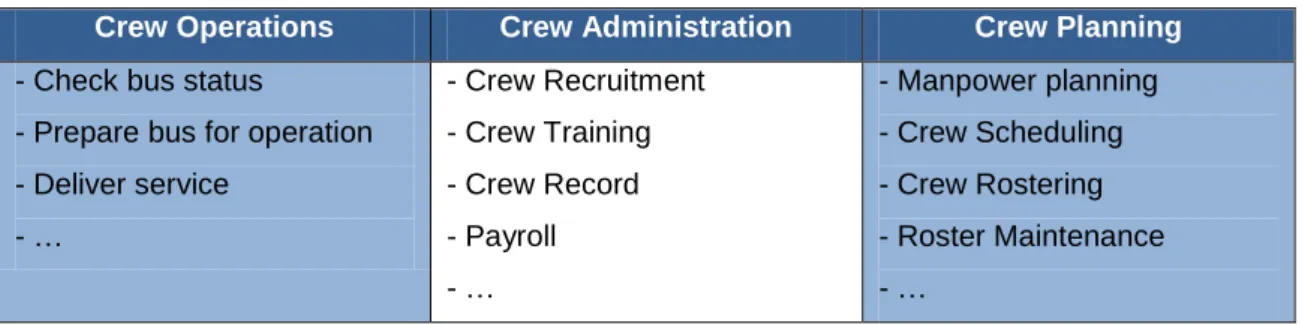
CREW MANAGEMENT AT CARRIS
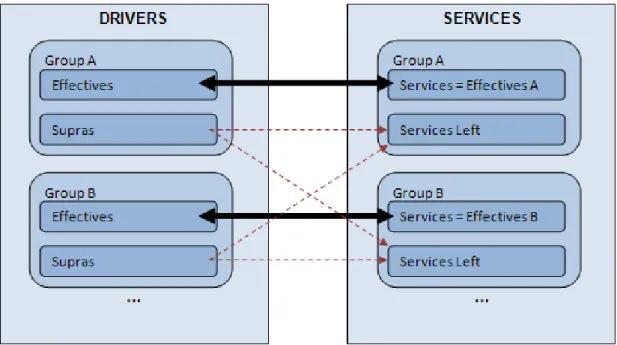
One of the most important parts of the GIST system is the crew scheduling module, which schedules drivers or crews by vehicle for each type of day (weekdays, Saturdays and Sundays/holidays). On the other hand, the opposite can also happen, a certain group does not have enough drivers to perform all the services of the correspondence group, resulting in services without an assigned driver. So the preferences of the drivers are given on the PF form, where the first preference is the driver, the second and the third.
FORMULATION OF THE METHODOLOGY
Description of methodology by Souza et al
R1 – the sum of the number of missing or excess days off in relation to the minimum and maximum number of days off imposed, for each driver. R5 – the sum of the number of times each driver changes journey on working days (Monday to Friday);. R7 – the sum of the number of times each driver changes journeys only taking into account Sundays and public holidays.
Adaptations of the methodology to the Carris case
Carris believes that this will not impact the quality of the schedule, so it will not be measured in this way. Overtime is paid at a higher rate, so it is important for Carris to understand whether the implementation of this new system had a significant impact on the amount of extra hours that had to be paid. There is no way to determine the impact of the ITS on the extra hours, as it experiences a large amount of manual changes after the ITS implementation, according to Carris.
Final formulation of the methodology
Another modification of the method was made to make each indicator represented by a dimensionless value, always taking into account the universe of hypothesis of failure for each indicator (it must be remembered that the method is always performed negatively, or in other words, the higher the values the worse results). The subscript "" on each indicator stands for "formula", which means that this value is the dimensionless factor described in the last paragraph of Section 5.3.2. By comparing the results obtained on the indicators for both months, one will be able to conclude about the performance of the ITS being analyzed.
DATA FOR THE CASE STUDY
APPLICATION OF THE METHODOLOGY
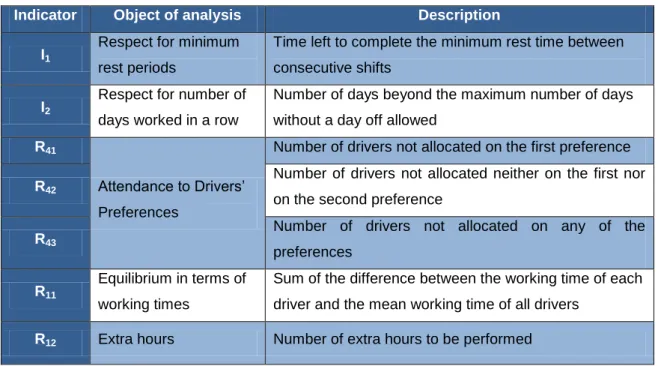
- Determination of I 1
- Determination of I 2
- Determination of R 41 , R 42 and R 43
- Determination of R 11
- Determination of R 12
- Relative importance of the indicators
- Resume of the results obtained for the indicators
As can be seen, excluding this minority of situations, a greater improvement is verified with the introduction of the crew list application, as the verified decrease in the number of time remaining to complete the minimum rest is greater (a decrease of almost 2500 minutes . is verified). R43 the number of times the drivers did not share any of the stated preferences. As can be seen, there is a marked improvement with the introduction of the crew list software, which comes from the R12 drop in February 2010.
GENERAL CONCLUSIONS OF THE CASE STUDY
It was observed that the most important indicators had shorter contributions to the final value of the objective function, the less important indicators being the most responsible for the improvements introduced by ITS. This may indicate that ITS is doing its best to improve the important indicators, resulting in higher contributions from the less important indicators due to the lack of opportunity to respect them by introducing higher rated indicators. In other words, to improve the more important indicators, the others may be left behind, resulting in higher contributions of the latest ones.
CONCLUSIONS
APPLICABILITY AND CONTRIBUTIONS OF THIS WORK
DIRECTIONS TO FUTURE INVESTIGATIONS
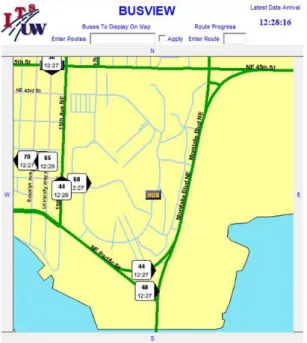
Deploying the ITS Infrastructure in California, IEEE Intelligent Transportation Systems Conference Proceedings, Oakland, California, USA, August 2001. Intelligent Transportation Systems Research University of Washington, website URL http://busview.its.washington.edu/busview_help. html, accessed 25 June 2011. Towards the Development of Intelligent Transportation Systems, IEEE Intelligent Transportation Systems Conference Proceedings, Oakland, California, USA, August 2001.
ANNEX 1 – Simulated Annealing (SA) Proceding
ANNEX 2 – Iterated Local Search Proceding
ANNEX 3 – Excerpt of the drivers’ preferences table provided by Carris
ANNEX 4 – Excerpt of the schedules provided by Carris
ANNEX 5 – Excerpt of the schedules provided by Carris for extra time