Maximum P(3HB) concentration and biomass content of 22.3 g,L and 31.9 % respectively were obtained at a dilution rate of 0.1 h-1 corresponding to a maximum overall P(3HB) productivity and yield of polymer on glucose and xylose of 0.90 g/(L.h) and 0.10 gP(3HB)/glucose+xylose, respectively.
INTRODUCTION
Context
Objectives
STATE-OF-THE-ART
Biodegradable Plastics
- PHAs
- P(3HB) production
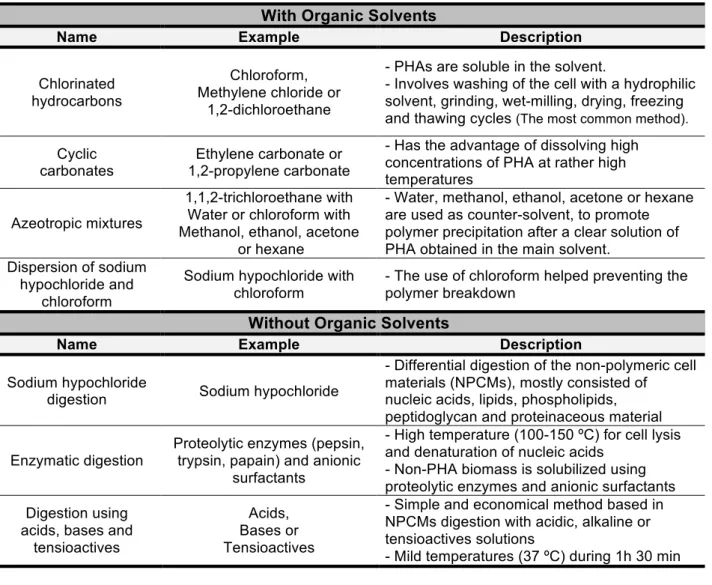
- P(3HB) Extraction
- PHA Applications
- PHA Commercialization
In the early 1960s, the production of P(3HB) was explored on a commercial scale by the pioneering work of Baptist and Werber in the USA, which aimed to use this polymer to fabricate sutures and prosthetic devices [12]. Other applications in the health sector include not only pharmacological devices, such as matrix for enzyme immobilization and controlled release devices, but also therapeutic devices, such as temporary prostheses, porous structure for tissue engineering [16]. The area of drug delivery has been greatly influenced by the range of polymeric biomaterials that have been processed into micro- and nano-spheres, as well as capsules with the specific purpose of encapsulating or combining pharmacologically active substances [12].
![Figure 2 – Representation of monomer unit of P(3HB) adapted from [13].](https://thumb-eu.123doks.com/thumbv2/123dok_br/19783217.0/18.892.319.570.528.764/figure-representation-monomer-unit-p-3hb-adapted-13.webp)
Lignocellulosic Hydrolysates
Finally, biological pretreatment uses microorganisms to treat lignocellulosic biomass and improve enzymatic hydrolysis [5]. The main limitations related to a pretreatment method are, in general: 1) high capital and operational costs related to the need for energy or chemicals; 2) material losses due to degradation; 3) the hazardous chemicals used and the environmental issues associated with their use, and finally 4) the formation of inhibitors that will negatively affect the production of PHA [34].
Approaches to P(3HB) Production
- Fed-Batch Production
- Continuous Production
- Fed-Batch vs Continuous Production
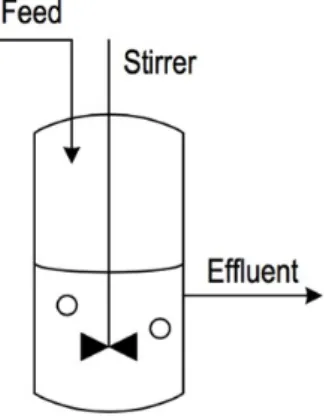
It is also assumed that in an ideal CSTR the properties of the outlet stream are the same as those inside the bioreactor [36]. Steady state in continuous cultures is a constant physiological state controlled by varying residence time (in relation to working volume and substrate feed flow, D=F/V); Some of the advantages of this system are that the microbial population in the vessel grows at a constant rate, in a constant environment, and assumes a "steady state".
Cell growth on the internal walls or other surfaces (eg, scratches, probes, etc.) of the bioreactor during long-term operation. Thus, improved product quality can be expected in a CSTR cascade from the high uniformity of the physiological state of the cell, caused by the narrow residence time distribution [36]. The limited productivity is mainly caused by the "dead time" required for the preparation and post-treatment ("reconditioning") of the bioreactor.
Objective of the study: Continuous production of P(3HB) using simulated lignocellulosic hydrolysates as a carbon source.
Aim of the study: Continuous Production of P(3HB) using simulated
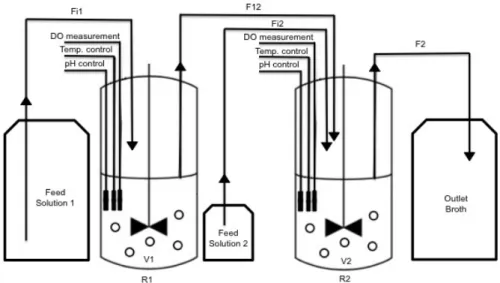
Regarding glucose assimilation G6P, glucose-6-phosphate, an intermediate of glucose metabolism, is converted to acetyl-coenzyme A via the Entner-Doudoroff pathway and finally to P3HB when accumulating conditions are provided (phosphate or nitrogen starvation) . This mechanism slows down xylose consumption when glucose is present in the medium at high concentrations. The dose of carbon source (glucose) must therefore be well balanced with the dose of the other nutrients, especially phosphorus (the limiting nutrient), in order to result in very low residual nutrient levels in the effluent of the first stage.
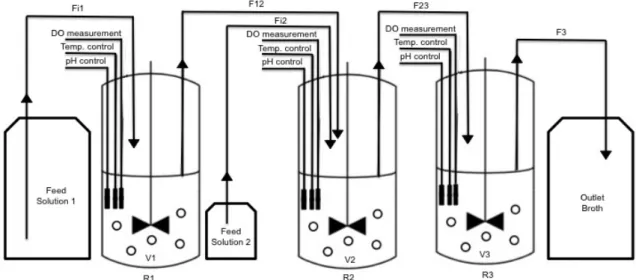
The goal of the second bioreactor (fed with a mixture of glucose and xylose) is the accumulation of P(3HB). Finally, further synthesis of xylose-based P(3HB) leaving the second stage bioreactor is expected in the third bioreactor. Before the continuous three-stage bioreactor tests, a study will be carried out with only two-stage bioreactors and glucose as the carbon source, in order to gain knowledge of the continuous system and to be able to determine the dilution level at which the maximum P(3HB) production is achieved.
Based on the kinetic parameters, a mathematical model for the two-phase bioreactor system was constructed in order to predict the optimal conditions to achieve the maximum productivity of P(3HB).
![Figure 8 – Transmission electronic microscope image of Burkholderia sacchari containing 70 % of P(3HB) (of cell dry weight), from [5]](https://thumb-eu.123doks.com/thumbv2/123dok_br/19783217.0/29.892.289.629.116.385/figure-transmission-electronic-microscope-burkholderia-sacchari-containing-weight.webp)
MATERIALS AND METHODS
- Microorganism
- Culture Storage and Preparation
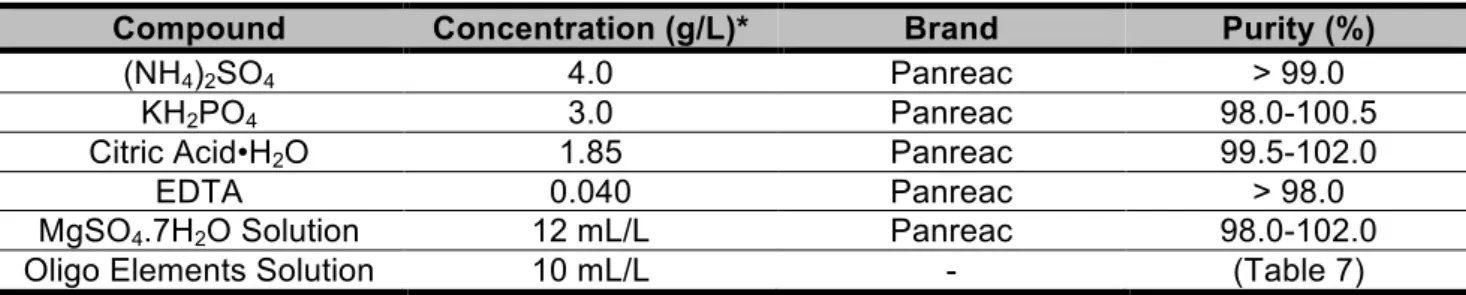
- Culture Media
- Seeding Medium
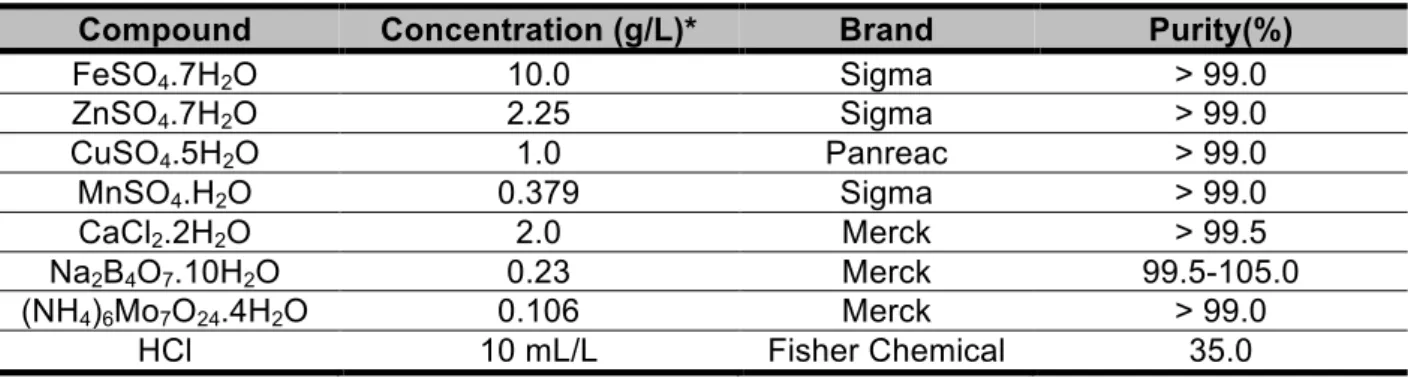
- Oligo Elements Solution
- Initial medium composition
- Carbon Sources
- Feed Solution 1
- Feed Solution 2
- Culture Conditions
- Inoculum Preparation
- Description of the Two-Stage and Three-Stage Cascade bioreactor series
- Culture Samples
- Strain Determination Test
- Analytical Procedures
- Optical Density Measurements
- Dry Weight Determination
- Carbon Source, Xylitol and Phosphate Quantification
- Polyhydroxyalkanoates Quantification
At a phosphate concentration of 2 g/L, the phosphate concentration at the outlet of the first bioreactor was zero, which could indicate that the first stage was under phosphate-limited conditions. The second stage was also fed by feed solution 2 with a flow that allowed a glucose concentration in the effluent of the second bioreactor of about 20 g/L. In the case of three-stage continuous experiments, the concentration of xylitol was also analyzed.
Typically, 10 ml of the culture was harvested manually using a device that incorporated a check valve to maintain asseptia. Before the OD determination, an aliquot of the culture sample was diluted with distilled water to obtain an absorbance value in the range between 0.05 and 0.6. The weight difference between the eppendorf with the dried pellet and the same previously dried eppendorf was used to calculate the total dry weight of the culture.
To perform the P(3HB) quantification, 1.2 ml aliquots of the culture sample were centrifuged in a Sigma 1-15 P microcentrifuge.
RESULTS AND DISCUSSION
Two-Stage Continuous Production of poly-3-hydroxybutyrate
- Effect of the dilution rate in the first-stage
- Effect of the dilution rate in the second-stage bioreactor
A range of dilution rates between 0.10 and 0.32 h-1 were studied under phosphate-rich conditions in the first-stage bioreactor (Table 9). Analogously, the volumetric productivity of the residual biomass in the first bioreactor was calculated from Eq. Where biomass and P(3HB) produced and glucose consumed in the first bioreactor, (g/h), were calculated from equations and (13). 13) The influence of dilution rate on residual biomass yields and P(3HB) on total glucose consumption in the first bioreactor is shown in Figure 17.
In the second stage bioreactor, biomass and P(3HB) concentrations tend to decrease with the increase in dilution rate. 30 one in the second stage, it was observed that the residual biomass in the second stage was higher than that in the first (Figure 21). As shown in Figure 22, a general increase of the residual biomass production rate in the second stage of the continuous cultivation system is proposed with the increase of the dilution rate.
The influence of dilution rate on the yield of residual biomass and P(3HB) on glucose in the second bioreactor is shown in Figure 24.

Kinetics Studies for the Two-Stage Continuous System
- Growth Kinetic Parameters
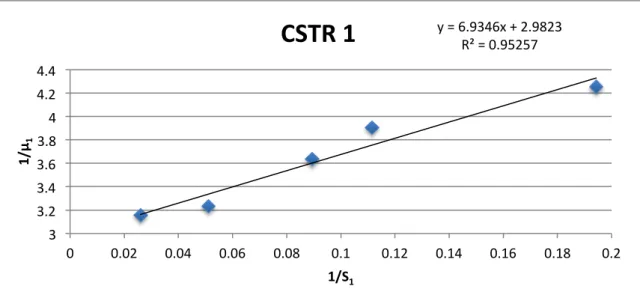
- Determination of µ max and K s
- Determination of µmax of B. sacchari (In Batch)
- Determination of Y G and m s
- PHB Production Kinetic Parameters
Unfortunately, this study could not be performed due to the total consumption of phosphate in another bioreactor. Under steady state conditions, equation 38) gives the specific growth rate of cells in the second bioreactor, µ2. The phosphate consumption rate in the second bioreactor was calculated using Eq. 39) The variation of µ2, qp2 and phosphate consumption rate with the dilution rate in the second stage is presented in Figure 30.
From the results so far, it appears that cell growth is dominant in the first phase, while product formation is dominant in the second phase. To clarify this point, the specific rates of growth and production in both phases are shown in the same graph (Figure 31). The specific growth rate in the first stage was always higher than that in the second reactor on the other hand, the specific P(3HB) production rate of the first bioreactor, calculated from Eq. 8), was much lower than qp2 for lower dilution rates, when less phosphate enters the second bioreactor.
Thus, it is possible to conclude that cell growth was of great importance in the first bioreactor and that P(3HB) production was more important in the second bioreactor, which allows to investigate P(3HB) accumulation in the first bioreactor and cell growth in the second negligible. phase, in order to be able to construct a simplified mathematical model that predicts the performance of the two-stage continuous system.
Mathematical Model for Two-Stage Continuous System
- Mathematical Model applied on the first-stage bioreactor
- Mathematical Model applied on the second-stage bioreactor
- Validation of the Mathematical Model
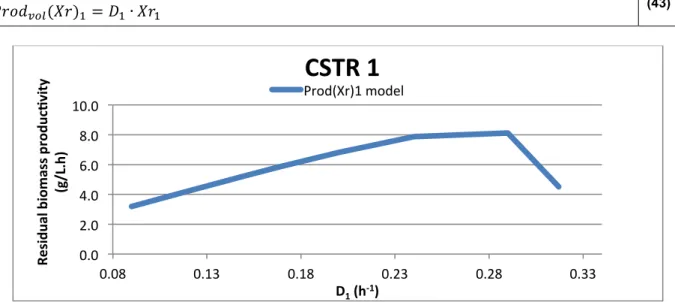
To calculate the volumetric productivity of the remaining biomass in the first bioreactor Eq. Figure 33 - The relationship between the residual biomass volumetric productivity and the dilution rate in the first bioreactor predicted by the mathematical model. The relationship between the residual biomass volumetric productivity and the dilution rate in the first bioreactor suggested by the mathematical model is shown in figure 33. The relationship between the concentration of P(3HB) and the dilution rate in the second bioreactor suggested by the mathematical model is shown in figure 34. The concentration of P(3HB) decreased with increasing dilution rate and for the lowest dilution rate studied it reached a maximum value of 37.2 g/L.
In general, the experimental residual biomass in the first bioreactor was generally lower than the residual biomass predicted by the model. 44 The relationship between the remaining biomass productivity in the first phase, predicted by the mathematical model, and that calculated based on the experimental results, is shown in Figure 38. The experimental Xr2 was higher than the Xr2 from the model due to the cell growth present in the second bioreactor that the mathematical model did not take into account.
Regarding the P(3HB) accumulation, Figure 40 demonstrates the relationship between the P(3HB) concentration obtained in the second bioreactor by the mathematical model and in the experimental results.
Three-Stage Continuous Production of poly-3-hydroxybutyrate
- Performance of the three-stage continuous system over time
- Effect of the dilution rate in the first-stage bioreactor
- Effect of the dilution rate in the second-stage bioreactor
- Effect of the dilution rate in the third-stage bioreactor
The effect of the dilution rate in the first stage bioreactor is shown in Figure 51. It can be seen that all the glucose (and also some xylose) was consumed in the second bioreactor. The concentration of residual biomass reached a value of 50 g/L, which is almost twice the concentration in the first bioreactor, which proves that cell growth also took place in the second bioreactor.
The effect of the dilution rate on the third bioreactor of the system is shown in Figure 57. A near-zero P(3HB) production rate is expected in the first bioreactor, although the same is not true for the third. Also, glucose consumption in the second bioreactor was higher (approximately doubled) than that of xylose in the same phase.
Regarding the P(3HB) content, compared to Du et al., it is possible to conclude that the P(3HB) content achieved in the two-stage continuous system of this work was lower, although it is important on to note that the dilution rate used in that work was lower than that used in this study.

CONCLUSIONS
FUTURE WORK
Nurettin, “Accumulation of poly-β-hydroxybutyrate in Streptomyces species during growth with different nitrogen sources”, Turkish J. Nuttha, “Free batch fed cultivation for high production of poly(3-hydroxybutyrate) from a new isolate of Bacillus megaterium”. . Ramsay, "Fed Group Production of Compositionally Controlled Medium Chain Unsaturated Polyhydroxyalkanoates by Pseudomonas putida KT2440.", Appl.
Lee, “Poly(3-Hydroxybutyrate) Production with High Productivity and High Polymer Content by a Fed-Batch Culture of Alcaligenes latus under Nitrogen Limitation.,” Appl. Egli, “Accumulation of poly[(R)-3-hydroxyalkanoates] in Pseudomonas oleovorans during growth with octanoate in continuous culture at different dilution rates,” Appl. Cavalheiro, "MSc thesis: Optimization of poly-(3-hydroxybutyrate) production by Cupriavidus necator using waste glycerol Dissertação para obtenção do Grau de Mestre em Biotecnologia," Technical University of Lisbon, 2007.
Freire, “Production of polyhydroxyalkanoates (PHAs) from waste materials and by-products by submerged and solid-state fermentation,” Bioresour.
![Figure 3 – Pathway of P(3HB) synthesis in Cupriavidus necator, adapted from [27].](https://thumb-eu.123doks.com/thumbv2/123dok_br/19783217.0/20.892.226.678.237.763/figure-pathway-p-3hb-synthesis-cupriavidus-necator-adapted.webp)
![Figure 7 - Neighbour-joining phylogenetic tree of Burkholderia sacchari and related bacteria based on 16S rRNA sequence comparisons from [41]](https://thumb-eu.123doks.com/thumbv2/123dok_br/19783217.0/28.892.123.756.533.1041/figure-neighbour-phylogenetic-burkholderia-sacchari-bacteria-sequence-comparisons.webp)