It presents an overview of the state of the art of education in the country and points out the main challenges for the government to be able to fulfill the goal set by the federal constitution, which is to provide quality education for all Brazilians, regardless of race, ethnicity, gender, religion or income.1 The report begins with the issue of illiteracy in Brazil and shows that it is a structurally inextricable problem that is part of the very fabric of Brazilian society and reflects deep inequalities. which dominates in Brazil.2. The second part deals with the access and participation of the Brazilian population in the education system. This confirms Brazil's commitment to overcoming the inefficiencies of the public education system, strengthening education and introducing changes for the better education desired by Brazilian society.
Illiteracy
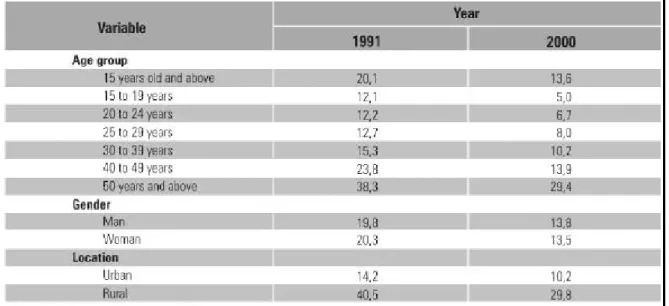
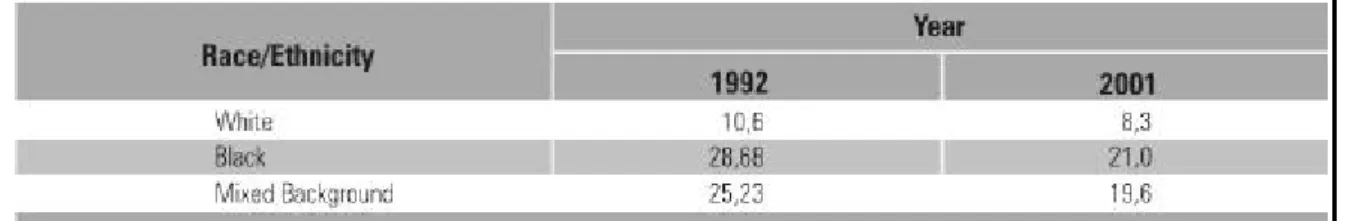
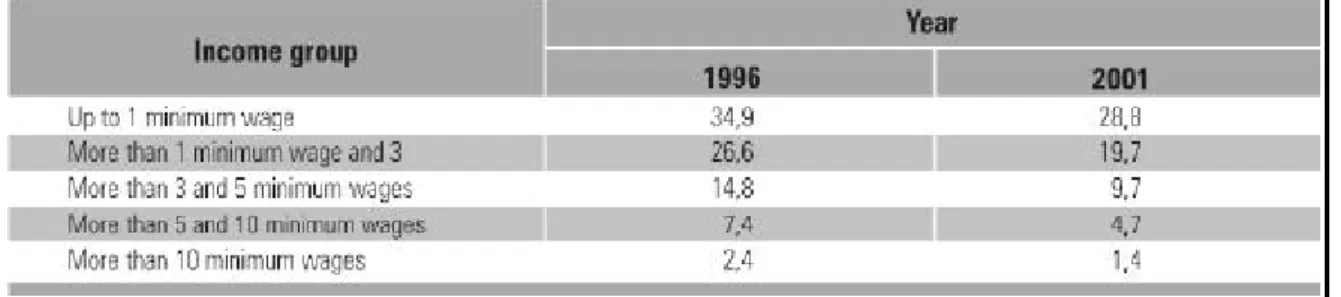
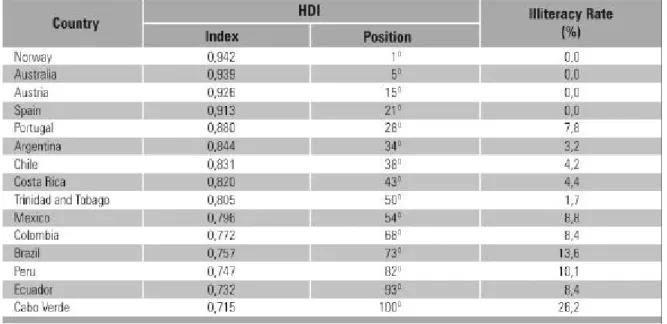
For example, the illiteracy rate of the rural population is three times higher than that of urban areas, a ratio that has not changed significantly since the early 1990s. Despite the mixed racial/ethnic characteristics of the Brazilian population, the illiteracy rate among Afro-Brazilians is almost twice that of whites, and this ratio is closely related to the socioeconomic levels of these residents. While the illiteracy rate among the richest is only 1.4 percent, it is 28 percent among the poorest.
Access and participation
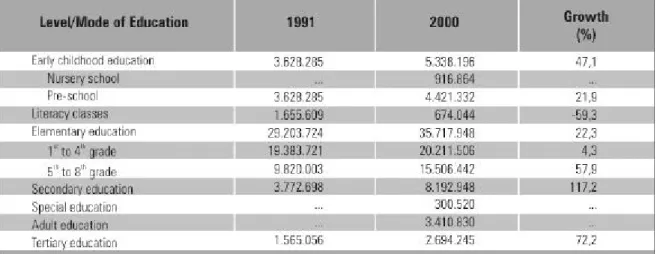
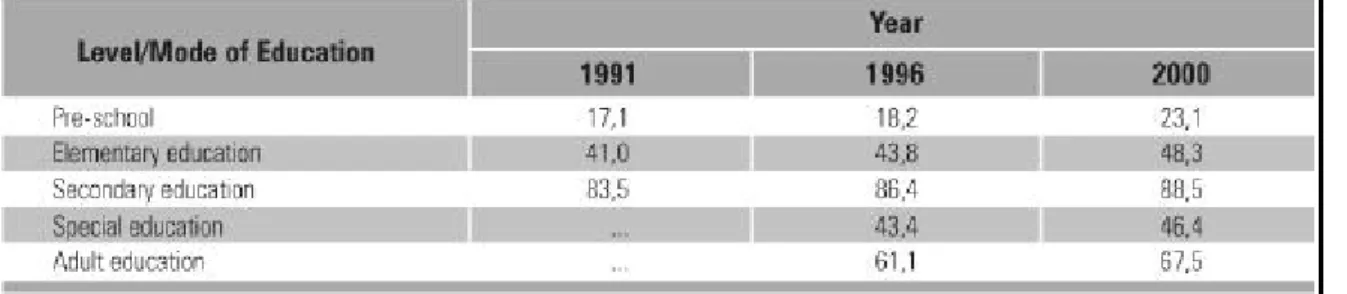
However, in the field of early childhood education, Brazil needs improvements so that the country can guarantee that everyone who wants it has access to education, as guaranteed by legislation. This is a principle enshrined in the Federal Constitution and in the Law for Guidelines and Basis of National Education and which requires cooperation and coordination between the three levels of government. Secondary education is the level of education that has grown the most over the past decade, reflecting the improvement in student flow; In other words: more students complete primary education.
While the number of students in the first cycle (grades 1 to 4) at this level has grown by only 4.3% in a decade, the number of students in the second cycle (grades 5 to 8) was 57.9% . Similarly, the higher education system has grown very significantly in recent years, especially the private sector. At present, this sector corresponds to approx. 70% of the total number of registrations for higher education.
However, the participation rate in tertiary education in the country is still one of the lowest in Latin America (12% of the population between 18 and 24). Since the supply conditions of the private sector have reached their limits, with a large number of vacancies unattended, the way out must be through the growth of the public sector, which is the one that offers the best quality education. However, it is the private sector, through philanthropic institutions, that gets the biggest share: 56.1% of special education students study in these schools.
The inclusion of special education students in the regular classroom has become part of daily life in many schools in Brazil, and nowadays there are more than 30 thousand students attending regular classrooms.
Supply of quality education
In the field of tertiary education, the policy is aimed at obtaining master's and doctorate degrees. In 1991, only 35% of university teachers had a university degree, and in 2000, 52% of all university teachers had a university degree. In order to meet the needs of the education system, we need adequate training of teaching staff and investment in school infrastructure.
However, despite the improvement in infrastructure, 6% of students still attend schools without electricity. The TV School, a government policy offering a TV channel for teachers and students, is available to 54% of primary school students.
Permanence and progression indicators
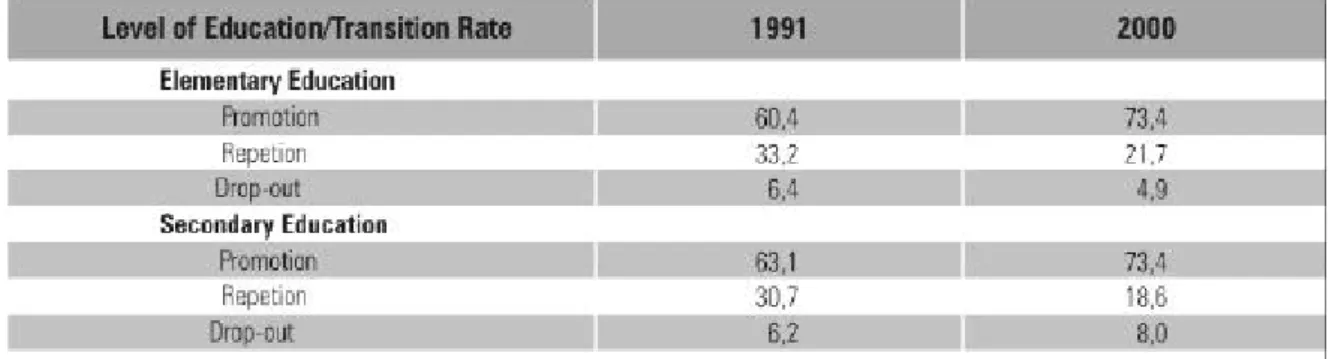
Due to high repetition rates, the gap between age groups is one of the main problems in Brazilian education.7 In 2000, for every 100 students enrolled in primary school, there were 42 students who were not enrolled in the class of their age group. Although at a low rate, a significant reduction in the levels of age differences can be observed in each grade of primary education. The improvement in student flow had a significant impact on the age gap indicator.
One of the consequences of the smaller number of repeaters is reflected in the growth in the number of students who achieve higher grades in primary school. The decrease in the total number of enrollments in primary school and at the same time the growth in the number of students who complete this school level and enroll in secondary education is also a consequence of a more efficient system. The result of this is an improvement in student flow and a decrease in dropout rates.
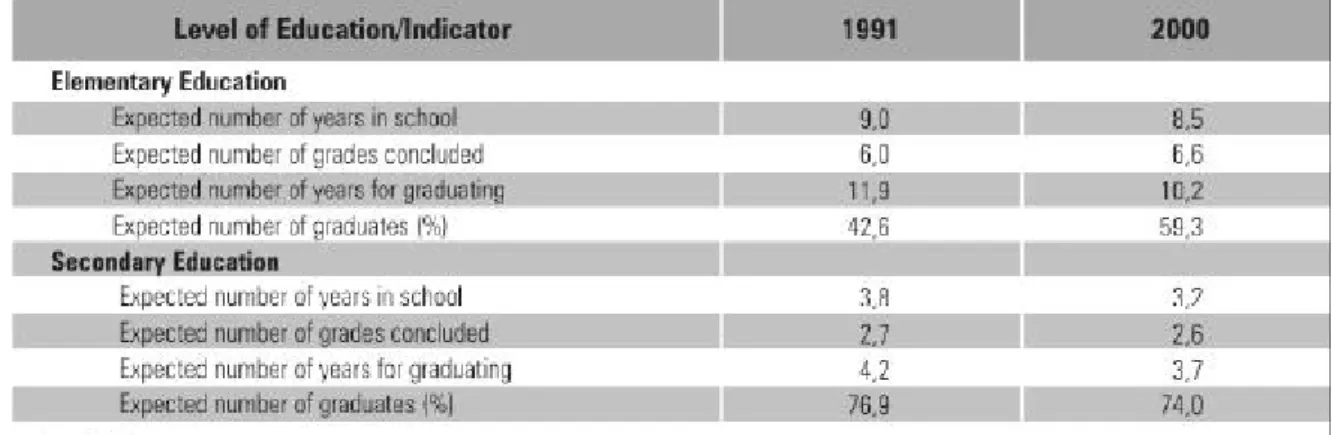
However, these numbers are still high, on average a student takes 8.5 years to complete 6.6 grades due to the high repetition rates. It is estimated that for every group of 100 pupils enrolled in the first year of primary school in 2000, 59 will manage to finish this school level. For every 100 students enrolled in the first class at this level in 2000, it is estimated that 74 will manage to graduate, taking an average of 3.7 years to complete 3 grades.
So what we can conclude is that the country is undoubtedly making significant progress in terms of drop-out and progression indicators: however, there is still a long way to go to ensure the completion of primary school for all those enrolled in it and an even longer way to go to provide universal secondary education.
Student’s assessment results
On the other hand, less than 7% of the students showed a performance that is considered sufficient for the 4th grade.
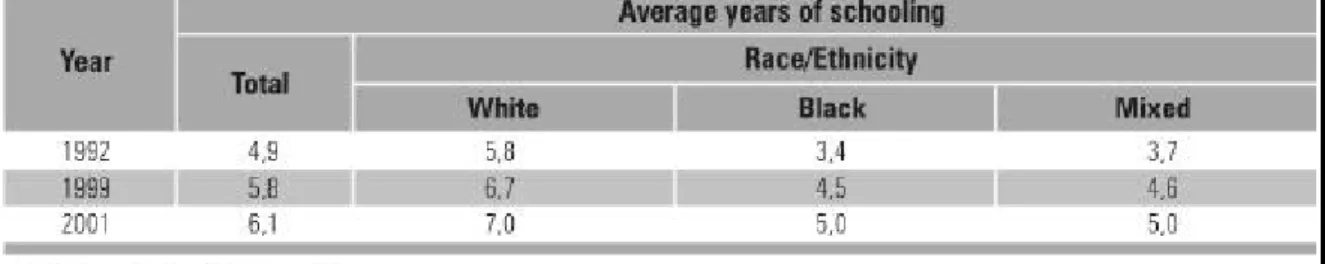
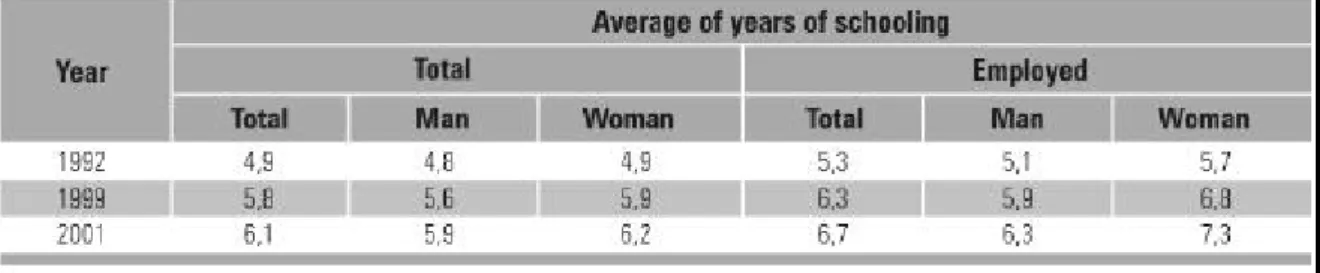
Educational profile of the population
The white population has an average of 7 years of schooling, while blacks and mixed-races have an average of 5 years of schooling. When the median income of the population is combined with the factor of race/ethnicity, this issue becomes even more obvious. Among the working population, the average education of blacks and mixed-race people does not reach 6 years of schooling, with an average monthly income of about twice the minimum wage.
According to the data above and although structural changes do not occur in the economy, it is important to emphasize the adoption of compensatory public policies as Bolsa-escola program (grants to low-income families that enable children to stay in school instead of the labor market and street) and School Meal Program, among others, which favors the permanence of the students in the school.
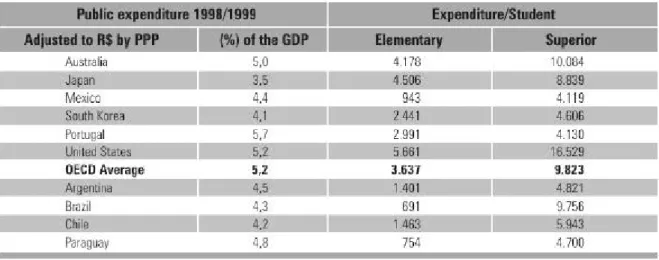
Financing education
Although Brazil's education expenditure relative to GDP does not differ from the listed countries, given the low value of Brazil's GDP per capita, expenditure/pupil in primary school is one of the lowest. Expenditure/student is higher in tertiary education because the public tertiary education system, while spending up to 21% of all funds spent on education, comprises a much smaller number of students than those attending primary school education. This ensures a different quality and explains why public universities concentrate the largest part of scientific production and master's and doctoral studies in the country, or why the ratio of candidate/.
But this behavior ended up causing a lack of interest in investment in early childhood education and secondary education, sectors where there is a huge unmet demand in the country. Finally, the implementation of this fund failed, in fact, to improve salary levels and career paths for teachers, nor to reduce disparities between counties in the country. In table 21 it can be seen that teachers, compared to a large number of professions, are the ones who receive the lowest salaries, or even that, regardless of Fundef, a teacher from the northeast earns less than half the salary of one of his colleagues his from the Southeast.
It is expected that up to 7% of GDP would be needed to fulfill the National Education Plan.
Challenges for quality education for all
Major goals of the National Education Plan (from 2001)
Ensure, at least, all the teachers of early childhood education with secondary education qualification provided by Teacher Training Schools, within 5 years;. Ensure, at least, all the teachers of early childhood education with tertiary education qualification, within 10 years;. Ensuring the program of minimal income for low-income families (grants to low-income families that enable children to stay in classrooms and playgrounds and stay off the labor market and streets);
Promote the annual increase in the number of master's and doctoral graduates in at least 5%. Ensure the offer of Adult Education for the 1st to the 4th grade of primary school to 50% of the population aged 15 and over, within 5 years;. Ensure the offer of Adult Education the 5th to 8th grade of primary school for 100% of the population aged 15 and over who complete the 4th grade within 10 years;.
Quadruple the capacity to offer adult education at the secondary education level within 10 years; To implement in all prison units and in all institutions where problem youth and juvenile offenders are treated, adult education programs for primary and secondary level and qualifications for the labor market. Increasing the funds dedicated to special education so that they can reach 5% of the funds needed for education within 10 years.