ES.1 Rates and estimated welfare gains have fallen over the life of the report.
ACRONYMS
ACRONYMS—Continued
Executive Summary
Effects of Significant Import Restraints
S. and Global Supply Chains
Services such as transport, warehousing and logistics are an integral part of the smooth operation of global supply chains. As the world's largest provider of services, the United States stands to gain significantly by growing international trade in business, financial and technical services in global supply chains.

Introduction
Scope and Organization of the Report
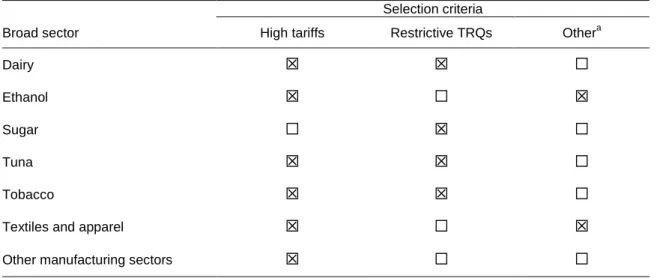
In fact, three of the four main sectors listed in this seventh update as providing the greatest potential benefits from liberalization also ranked first in the first update in 1995 (table 1.1).5 Two notable changes are the rapid growth in the ranking of ethanol in this list and significant decline in the ranking of textiles and clothing. The first section describes the nature of global supply chains and the economic forces that have contributed to their growth.
Approach
Estimates of the impacts of liberalization of each sector are presented relative to the changes expected to occur between 2005 and 2015 in the baseline projection. Source: Commission estimates based on tariffs and tariff quotas in the USAGE 2015 model projection.

Bibliography
Effects of Removing Significant Import Restraints
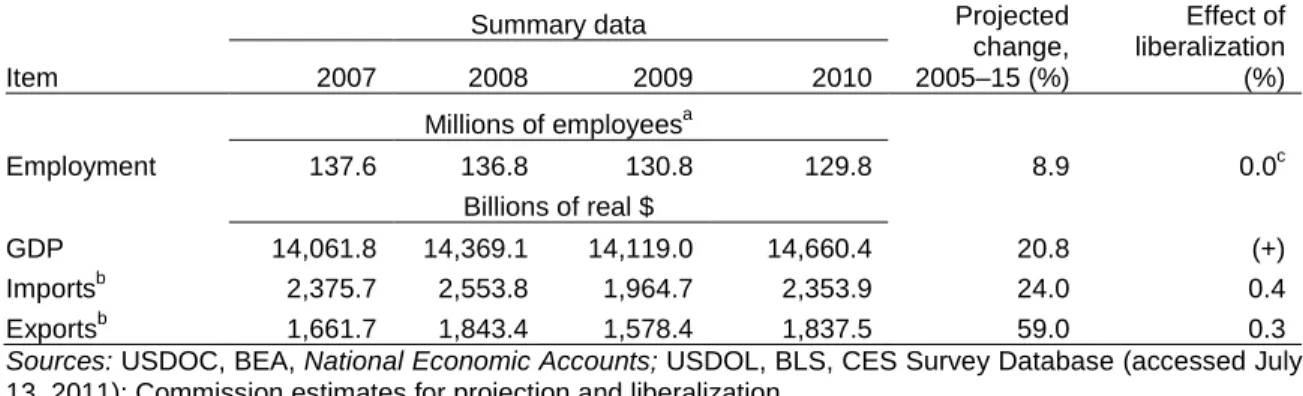
Effects of Removing All Significant Import Restraints
The results in this table may differ from those in later tables in this chapter, which show the effects of liberalization per sector.
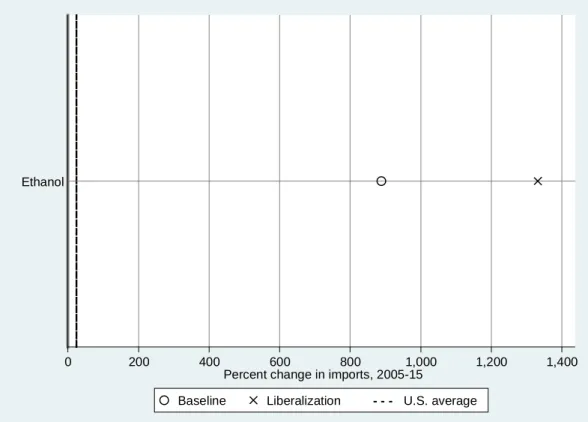
Ethanol
On a policy level, the requirements of the RFS and the future of the VEETC and the ODC after their scheduled expiration at the end of 2011 have important implications for the restrictiveness of import restrictions on imported ethanol. Abolishing the origin quota would reduce ethanol import prices by 15 percent, compared to 25 percent in the previous update of this report.23 The abolition of the origin quota represents approximately 84 percent of the welfare gain as a result of liberalization.
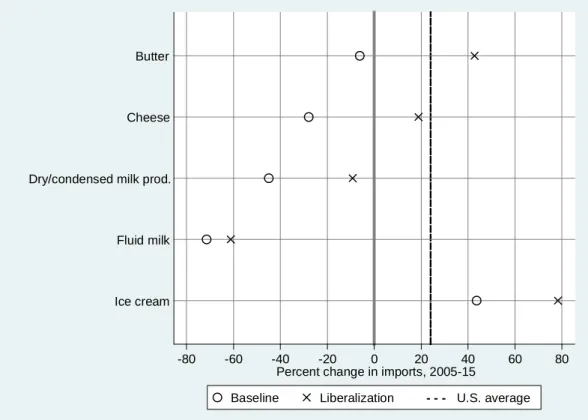
Dairy Products
These price declines lead to increases in imports, led by condensed and evaporated dairy products, cheese and dry dairy products (up 76 percent, 65 percent, and 58 percent, respectively). As a result of increased imports, domestic production would decline, led by condensed and evaporated dairy products (-5 percent), dry dairy products (-2 percent), and butter (-2 percent) (Appendix Table E.5); employment would fall by roughly the same proportions.

Tobacco and Tobacco Products
For additional information on establishing a tariff rate quota for tobacco, see USITC, Import Restrictions, Third Update. A calculated duty of 10 percent of the AVE applies to in-quota imports of unprocessed tobacco—most tobacco subject to a tariff quota.40 All imports in excess of the quota are subject to a 350 percent ad valorem duty.

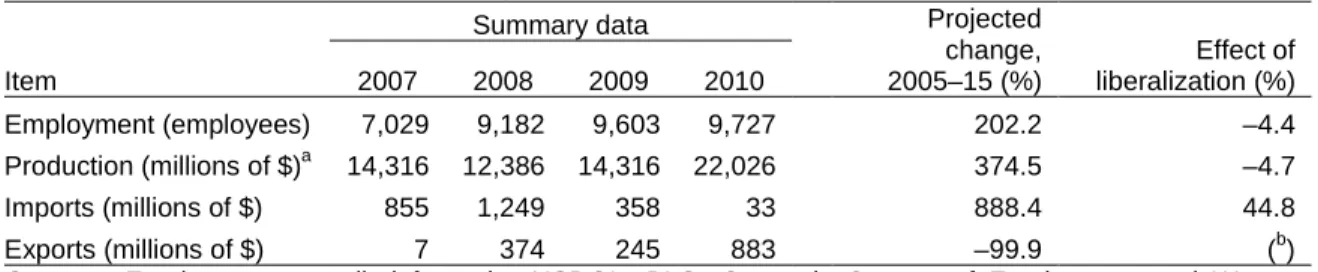
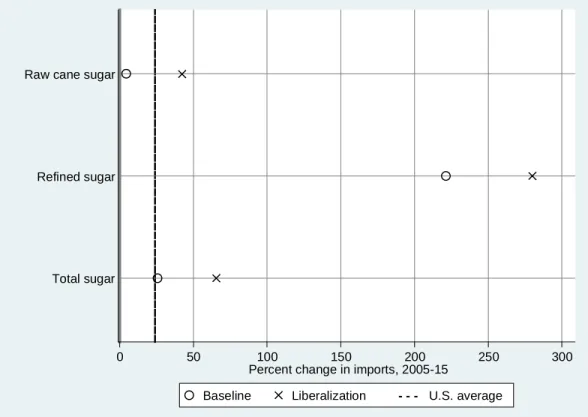
Sugar and Sugar-Containing Products
60 The FTA with Australia did not provide for preferential treatment under the tariff quotas for raw cane sugar and refined sugar. Lifting restrictions on sugar imports would result in an estimated increase in the US.
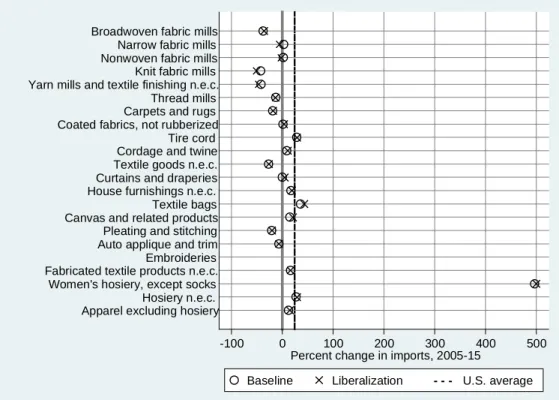
Textiles and Apparel
In 1995, the WTO Agreement on Textiles and Apparel replaced the MFA and established a 10-year phase-out of textile and apparel quotas that ended on January 1, 2005. 92 USITC, Hearing Transcript, December Testimony of Julia Hughes, President, on behalf of United States Association of Importers of Textiles and Apparel [USA-ITA]). The size of the reduction in each sector depends on the amount of textile and apparel materials that the United States exports to preferential trading partners, which are subsequently exported back to the United States in finished garments.95.
95 A fuller discussion of the approach used can be found in Fox et al., “Textile and Apparel Barriers and Rules of Origin”, 2008.

Other Sectors with Significant Import Restraints
Source: USITC DataWeb/USDOC data; USDOC, Census, Annual Survey of Manufactures 2009 (see February Commission estimates for projection and liberalization. Although the elimination of tariffs has a minimal effect on leather goods not elsewhere classified (n.e.c.), the elimination of tariffs on all other footwear and leather products import prices by 8 to 11 percent; the largest output declines for products in this group are in luggage, which is down 6 percent from the projected 2015 baseline, and personal leather goods n.e.c., which is down about 5 percent. Employment for this two sectors fall by similar amounts, while average output across the group of footwear and leather products falls by around 2 percent and average imports rise by 4 percent.
For pesticides and glass and glass products, however, the decline in production and employment outweigh the benefits of reduced import prices to produce a small net welfare loss of $3 million and $1 million, respectively.
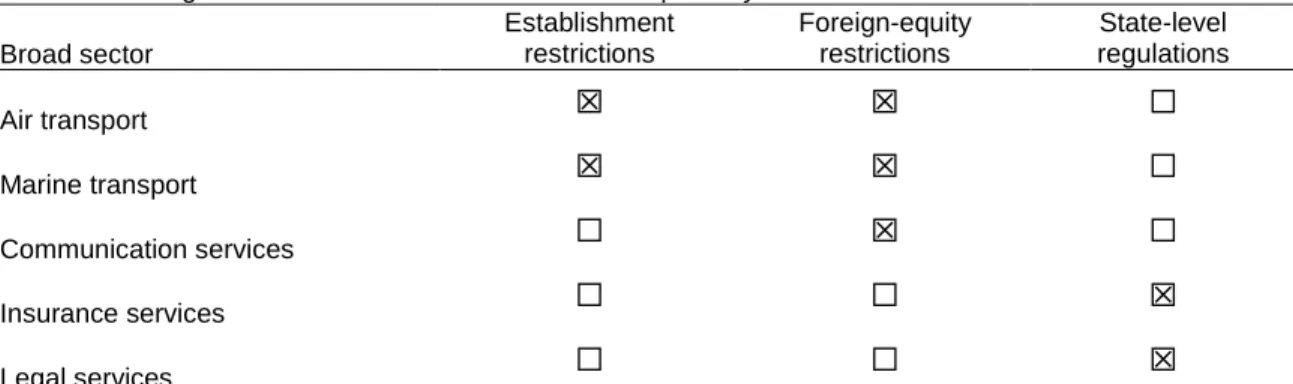
Services Import Restraints
Services performed abroad by US-owned foreign affiliates were valued at $1.1 trillion in 2008, while services provided in the United States by foreign-owned affiliates totaled $727.4 billion (table 2.15). Aircraft serving domestic routes within the United States must also be staffed in accordance with US multilateral, regional, and bilateral trade policy options for the United States.” World Economy 26, no.
Tuna: Report of Investigation Conducted Pursuant to a Resolution of the United States Senate Finance Committee Dated August 20, 1957.
Global Supply Chains
Development of Global Supply Chains
Global supply chains have brought about important changes in the nature and volume of global trade. In the mid-1990s, the increased speed of communication via the Internet allowed the Indian software industry to become a key player in global chains. Using data on these programs provides a more direct measure of global supply chain trade, as all trade in the components and products affected by the programs moves through a supply chain.
Second, this new pattern of specialization led to a change in the nature of trade flows.

Evolving U.S. Position in Global Supply Chains
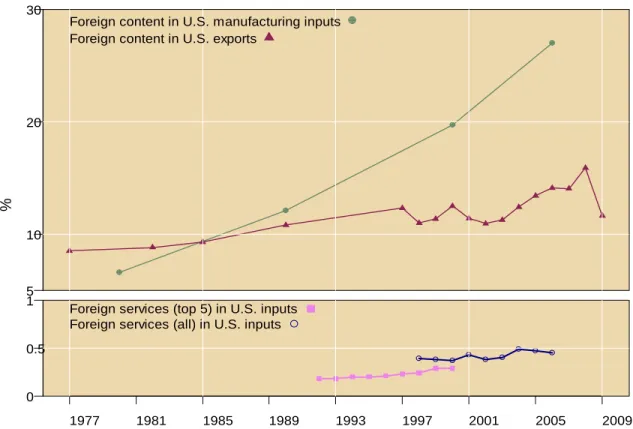
S. Participation in Global Supply Chains Has Increased Since the 1980s
The estimates in the following sections based on value added flow are thus better estimates of foreign content in the US. Information on value added shows that the US participates in supply chains with a number of countries69. Among all countries, the United States has the highest share of its own value-added exports returned home in its imports.72 This high share reflects both the large size of the U.S.
Japan's higher share of value-added imports indicates that a significant portion of Japan's exports (26 percent) first travel to other countries and undergo additional processing before being exported to the United States.
Effects of Global Supply Chains on the U.S. Economy
S. Multinational Firms, Now Acting as Coordinators of Networks
Thus, companies around the world tend to source some of the skilled services they need from the United States. An early study of this effect estimated that outsourcing was responsible for 15 to 40 percent of the wage decline for manufacturing workers (such as mechanics, repair workers, and maintenance workers) compared to non-production workers (such as managers, salespeople, and professionals). about. The effect of global production fragmentation on wage inequality in the United States and elsewhere continues to be actively explored.
127 This effect is not specific to supply chains—imports from developing countries could exert downward pressure on the wages of less-skilled workers in the United States, even in a world in which production fragmentation did not exist.

Industry Case Studies
S. Participation in the Global Supply Chain
None of the Vizio employees, in the United States or elsewhere, would be considered production workers. 198 In the US, as in the global market, leading 3PLs are mainly composed of transportation service companies that have over time added logistics and supply chain management capabilities to their core business. Electronic data exchange systems, which allow 3PLs to "connect" their customers' operations, let both sides track inventory and shipments in real time.203 The networks of large logistics companies are global in scope, with each company's primary U.S.
The China Syndrome: The Effects of Import Competition on the Local Labor Market in the United States.” School of International Relations and Pacific Studies (IRPS) Working Paper.

APPENDIX A Request Letters
As the Commission begins work on the seventh update of its report, and in light of the high degree of openness in the US, I therefore ask the Commission to provide an overview of these supply chains and the economic forces behind them in this seventh update. As stated in the original 1992 request letter, subsequent updates to the report must be provided at approximately two-year intervals thereafter.
USTR intends to make the Commission's report available in its entirety to the general public.
APPENDIX B
The Commission published a notice of initiation of the investigation in the Federal Register of June FR 27063). All written submissions must comply with the provisions of section 201.8 of the Commission's Rules of Practice and Procedure (19 CFR 201.8). Environmental Protection Agency, the U.S. Department of the Interior, and the National Oceanic and Atmospheric Administration.
The consent decrees may be examined at the Office of the United States Attorney, Western District of Louisiana, 800 Lafayette Street, Suite.
APPENDIX C
Calendar of Public Hearing
Kraemer, research professor at the Paul Merage School of Business and the Donald Bren School of Information and Computer Science; and co-director of the Personal Computing Industry Center;
APPENDIX D
Positions of Interested Parties
Introduction
S. Association of Importers of Textiles and Apparel 28
Association of Importers of Textiles and Apparel (USA-ITA), in testimony before the Commission, said that USA-ITA represents more than 200 apparel manufacturers and brands, retailers, distributors, importers and related service providers. Hughes stated that apparel retailers and importers have faced the United States' most onerous restrictions on the import of manufactured goods for decades, particularly quotas that raise prices and limit consumer choices.29 In its written statement, USA-ITA the expressed the view that since the elimination of such quantitative restrictions, the most recent of which was the expiration of the US-China Apparel Protection Quota Agreement at the end of 2008, the US Accordingly, she said that the US-ITA member states strongly support efforts to to harmonize rules of origin and customs regulations among trading partners in the US
In its written submission, USA-ITA offered several reasons to explain why China did not become the single dominant supplier of textiles and apparel after the quotas expired, and why a diverse supply chain is important: (1) retailers and apparel brands are willing to reward reliable, high-quality factories regardless of location and reluctant to end business with reliable manufacturing partners for small, short-term savings; (2) China is not the low-cost producer of textiles or clothing it once was because its labor costs are rising; (3) speed to market is an important sourcing factor that encourages retailers and brands to source from the Western Hemisphere, with several Western Hemisphere apparel manufacturers benefiting from the resurgence in the US.
APPENDIX E
Model Projections and Additional Results
Overview of the Modeling Framework
These equations indicate three general conditions that together determine the general equilibrium solution.5 First, activities are characterized by constant returns, so firms must earn zero real economic profit at the margin, and all production technologies and preferences derive from theoretical formulations constrained by these conditions zero profit.6 Second, the quantity supplied must equal the quantity demanded of each good and service in the economy.
Model Projections
The final component of the USAGE framework is the system of equations that model the US. The baseline incorporates trade policy adjustments expected to be made by 2015, such as changes to tariff rates and tariff-tariff quota (TRQ) quantity allocations contained in the tariff-setting schedules for U.S. These agreements provide the projected path of trade policy variables during the time horizon of the projection.
Values for these components of the USAGE baseline come from simulation analysis of a historical period.

Additional Data and Results
For countries that do not have such agreements with the United States, the 2015 tariff rates and tariff quotas are the same as their 2010 values. Some key model inputs, such as changes in consumer preferences, cannot be observed in the reported data or projections. In addition to preferences, such variables include detailed information on technical change, shifts in preferences between domestic and imported goods and services, and shifts in the export demand and import supply functions.