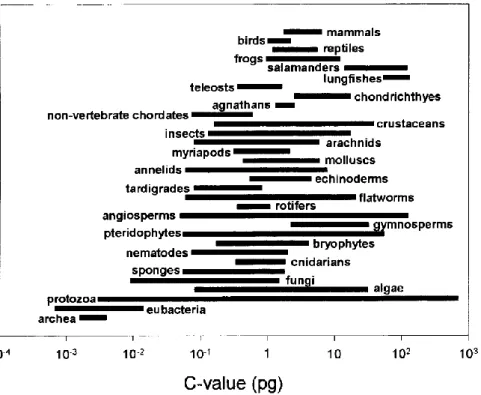
However, even from early studies of genome size (Mirsky and Ris 1951), it became apparent that this variation did not reflect the biological complexity of organisms (Thomas 1971). This is supported by the fact that genome size correlates with the most fundamental traits. A strong positive correlation between genome size and cell size has been observed in eukaryotic organisms (Gregory 2001b; Beaulieu et al. 2008).
As a consequence, the genome size is significantly reflected, for example, in the physiology and ecology of organisms (Veselý et al. Furthermore, genome size analysis enables the detection of intraspecific ploidy level diversity, different cell cycle or life cycle stages (Vaulot et al.) al. In addition, it is possible to distinguish taxa and identify cryptic species on the basis of genome size differences (Figueroa et al. 2010).
Aims and model group
They are also known as golden brown algae due to the presence of photosynthetic pigment fucoxanthin, which gives them their brownish color (Jeffrey et al. 2011). The chrysophytes are unicellular or colonial flagellates, found mainly in freshwater phytoplankton (but see Shi et al. 2011; Jeong et al. 2019). Although they lack a cell wall, silica-scaled chrysophytes (e.g. the representatives of the genera Synura or Chrysosphaerella) incorporate silicic acid and form species-specific silicic scales on their plasmatic membrane (Kristiansen and Škaloud 2017).
The silica-scaled chrysophytes are often used as bioindicators, including fossil taxa, as their scales can remain preserved in the environment. This variation has been shown to correlate with nutritional status, as the phototrophic species have larger genomes compared to their heterotrophic counterparts (Olefeld et al. 2018). Further, the variation in genome size is accompanied by several instances of greater intraspecific variability (Olefeld et al. 2018; Majda et al., which was partially attributed to polyploidization events (Majda et al. 2021).

Methods
Key results and conclusions
Other possible sources of variation in genome size in culture include aneuploidy or meiosis, which introduce variation in DNA amount (Quijano-scheggia et al. 2009). Unlike other groups of microorganisms, fungal genome size data are listed in their own database (Kullman et al. 2005). Therefore, genome size variation (via cell size) may be subject to natural selection in populations of protists (Cavalier-Smith 2005).
For example, genome size diversity in the diatom Thalassiosira weissflogii was attributed to polyploidization, aneuploidization, and gene duplications (von Dassow et al. 2008). A unique insight into mechanisms that maintain intraspecific genome size variation was recently documented in one rotifer species (Stelzer et al. 2019). Regardless of the genome size difference, individuals were able to interbreed and produce viable offspring, underscoring their identity as one species (Stelzer et al. 2019).
Literature cited
In many areas of biodiversity research, nuclear DNA content is an essential parameter of the study organism (individual, cell type), allowing for example ploidy determination, cell cycle analysis or selection of suitable organisms and optimal strategy for whole genome sequencing (WGS). Not surprisingly, most DNA content estimates available for small genomes are derived from WGS data. Currently, the most suitable method for this task is flow cytometry (FCM), a fast and easy-to-perform technique, using which the DNA content is estimated from the average fluorescence intensity of an acid-binding dye nucleic (eg propidium iodide, ethidium bromide).
Although the complexity of organisms is not directly related to the amount of their nuclear DNA, the small genomes are very often found among microorganisms, especially in nano/picoplankton, unicellular parasites and most fungi, as a consequence of the positive genome size–cell size correlation (Cavalier-Smith 1985). In fungi, the smallest nuclear DNA content measured (2.2 Mbp in Encephalitozoon romaleae; (Pombert et al. . . 2012) also reaches the lowest end of known DNA content among all eukaryotes. Moreover, the DNA content of other fungal species is generally not much higher (with a median value <40 Mbp; Kullman et al. 2005).
However, limited research of microorganisms has resulted in low numbers of DNA content data, especially pronounced in contrast to their estimated diversity. However, simultaneous analysis may not be suitable for organisms that differ substantially in their genome size. To reduce autofluorescence or adverse effect of secondary metabolites, sample can be fixed with various fixatives (ethanol, methanol, methanol:acetic acid mixture, formaldehyde, paraformaldehyde or acetone), although the chemical fixation may not be suitable for precise genome size estimation ( Doležel et al. 2007b).
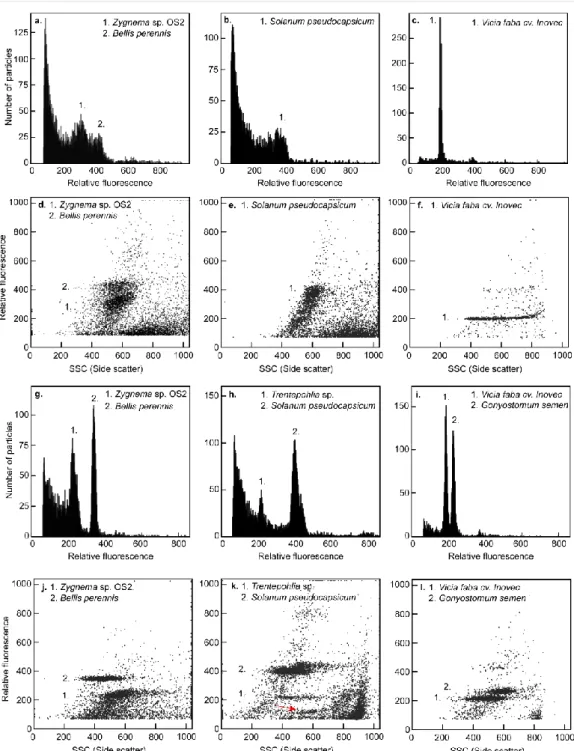
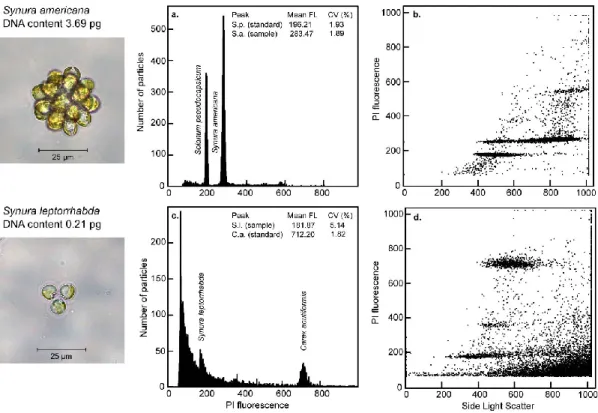
Conversely, the highest amount of debris is present in the second sample analyzed (c) with the DNA content of the sample approaching the resolution limits for the CyFlow instrument, yet with the peaks still sufficiently separated in fluorescence vs. DNA content data are available for only a fraction of microorganisms and thus the range of genome size variation is largely unknown, but often more diverse than expected. Similar interesting associations with genome size were also found in different groups of microorganisms, for example, correlation of genome size with growth rate and feeding modes in chrysophytes (Olefeld et al. 2018; Čertnerová and Škaloud 2020).
Nuclear isolation protocols for flow cytometry enabling nuclear DNA content estimation in problematic microalgal groups.
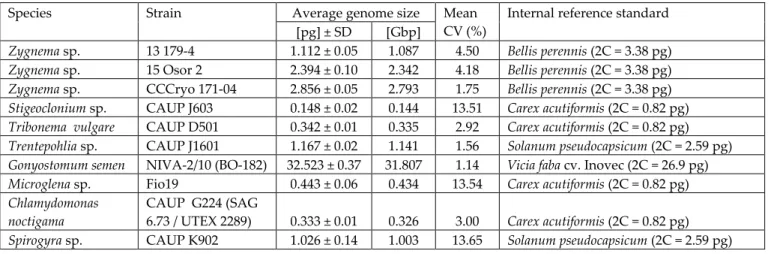
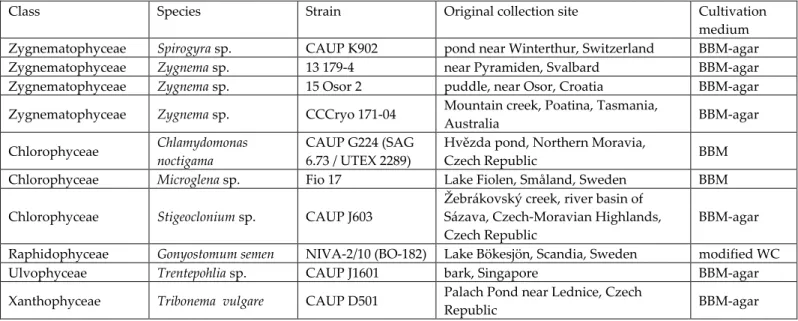
The most suitable method for precise and rapid nuclear DNA content estimation is flow cytometry (FCM). The enzymatic mixture was mainly developed for Streptophyte algae (eg the genus Zygnema), but also worked with some Chlorophyta (Chloroidium ellipsoideum, Tetraselmis subcordiformis) and Ochrophyta (Tribonema vulgare). The nuclear DNA content of studied microalgal strains is given in pg of absolute nuclear DNA per cell with equivalent values in Gbp (1 pg 0.978 Gbp; Doležel et al. 2003).
On the other hand, the lowest quality of DNA content estimates was documented for Stigeoclonium sp., Microglena sp. Beating cells in LB01 buffer (Protocol 6) is also the only method that obtained any estimates of DNA content for C. On the other hand, the highest DNA content measured in this study belongs to the raphidophyte G.
The only representative of the class Raphidophyceae so far analyzed for DNA content was the marine Heterosigma carterae, which had a genome five times smaller in pg Gbp; Veldhuis et al. 1997). The only available DNA content data for the genera Trentepohlia and Spirogyra come from DAPI microdensitometry (Kapraun López-Bautista et al. 2006). For both genera, the DNA content estimates in this study were the first to be acquired using FCM.
Comparison of three DNA fluorochromes for flow cytometric estimation of nuclear DNA content in plants. Flow cytometric and microscopic analysis of the effect of tannic acid on plant kernels and estimation of DNA content. Quantification of DNA content in freshwater microalgae using flow cytometry: A modified protocol for selected green microalgae.
DNA content variation and its significance in the evolution of the genus Micrasterias (desmidiales, streptophyta).
The lack of data is particularly pronounced when it comes to intraspecific variation in genome size. Genome size was positively correlated with cell size and negatively correlated with growth rate. Conclusions: This study represents the most comprehensive intraspecific genome size survey performed on a protist to date.
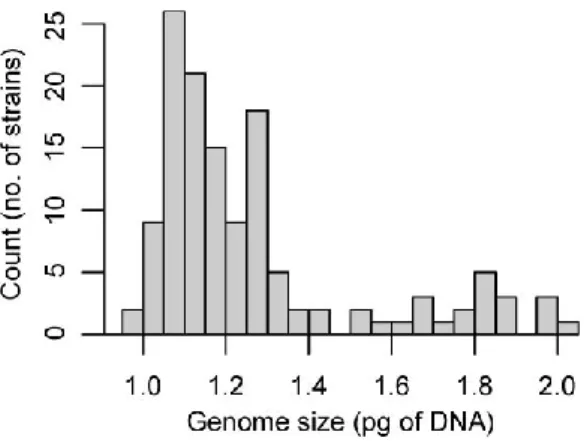
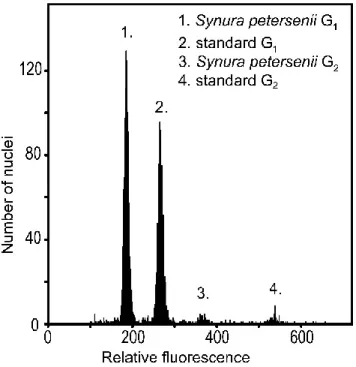
The lack of data is particularly pronounced when it comes to intraspecific genome size variation in unicellular eukaryotes. During our pilot FCM analysis, we detected intraspecific variation in genome size between strains of S. petersenii. To estimate the nuclear genome size of our strains, we used propidium iodide flow cytometry (FCM).
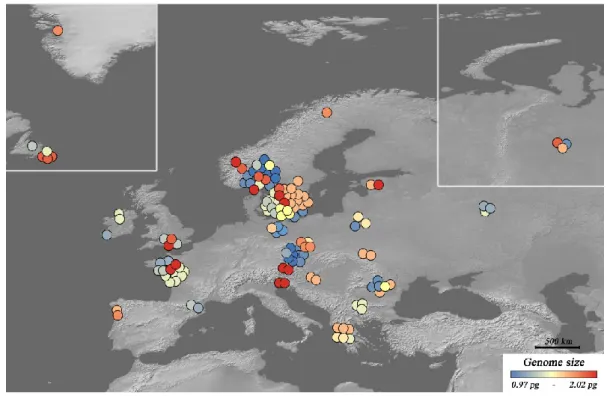
Geographical distribution of the genome size diversity in Synura was visualized on a map using ArcGIS 10.0 (ESRI, Redlands, CA, USA). There are several possible scenarios for what could be the source of genome size diversity observed among S. Three genomic and phenotypic traits associated with intraspecific genome size diversity in Synura petersenii: cell size (A), relative growth rate (B) and genomic GC content (C) .
Theoretically, there are two non-mutually exclusive evolutionary scenarios that would result in intraspecific variation in genome size.
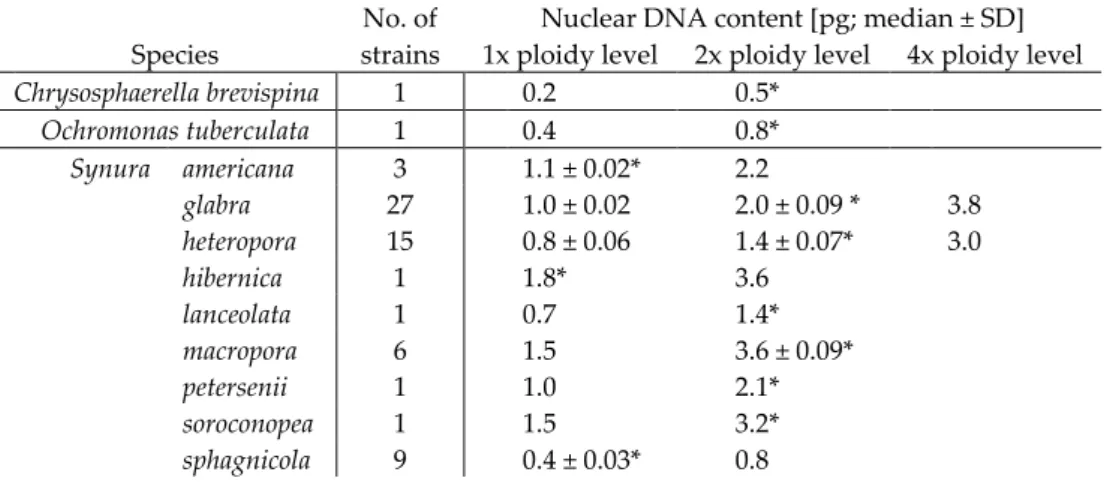
Varying nuclear DNA content in chrysophytes provides evidence of their isomorphic haploid-diploid life cycle. An alternation of two ploidy levels has been revealed in the life cycle of chrysophytes with both life cycle stages capable of mitotic growth and long-term survival in cultivation. With the exception of a small increase in cell size with higher ploidy, both life cycle stages shared the same phenotype and also had highly similar genomic GC content.
The haploid life cycle has evolved in stone mosses (charophytes) and in some other green algae (Mable and Otto 1998). This isomorphic haploid-diploid life cycle can be found, for example, in sea lettuce (Ulva lactuca; Wichard et al. 2015). Here we try to overcome the problem by measuring nuclear DNA content and looking for shifts in a ploidy level that should be associated with the life cycle transitions.
The absolute content of nuclear DNA (C-value) was calculated as the mean fluorescence of the peak of sample G1 / mean fluorescence of the peak of standard G1 × standard DNA content 2C (according to Doležel 2005). An increase in ploidy level (i.e. a doubling of nuclear DNA content) was associated with larger cell size in the studied chrysophyte taxa (Table 2). Fold differences in nuclear DNA content captured by time series of flow cytometry measurements on seven species of chrysophyte taxa alternating between haploid (white) and diploid (grey) life cycle phases.
Our flow cytometry data clearly showed that the life cycle of chrysophytes involves an alternation between lower and higher ploidy. Different life cycle stages of the cryptophyte Cryptomonas were even previously described as two separate genera, Cryptomonas and Campylomonas (Hoef-Emden and Melkonian 2003). This does not appear to be the case in chrysophytes, and the different stages of the life cycle do not differ morphologically.
Although it is best practice to apply closely related species as FCM standards (Temsch et al. 2021), our findings show that the use of chrysophyte FCM standards should be strongly discouraged due to their isomorphic haploid-diploid life cycle and the resulting DNA content instability. The two life cycle stages are morphologically indistinguishable apart from a small increase in cell size with the higher level of ploidy. This is the first report of an isomorphic haploid-diploid life cycle in unicellular algae.