Renewable Energy Futures:
Targets, Scenarios, and Pathways
Eric Martinot,
1Carmen Dienst,
3Liu Weiliang,
2and Chai Qimin
21Tsinghua-BP Clean Energy Research and Education Center,2Institute for Nuclear and New Energy Technology, Tsinghua University, Beijing 100084, People’s Republic of China; email: [email protected], [email protected], [email protected]
3Wuppertal Institute, 42103 Wuppertal, Germany;
email: [email protected]
Annu. Rev. Environ. Resour. 2007. 32:205–39 First published online as a Review in Advance on August 23, 2007
TheAnnual Review of Environment and Resources is online at http://environ.annualreviews.org This article’s doi:
10.1146/annurev.energy.32.080106.133554 Copyright c2007 by Annual Reviews.
All rights reserved
1543-5938/07/1121-0205$20.00
Key Words
electricity, emissions scenarios, distributed generation, primary energy, sustainable energy
Abstract
Scenarios for the future of renewable energy through 2050 are re- viewed to explore how much renewable energy is considered possible or desirable and to inform policymaking. Existing policy targets for 2010 and 2020 are also reviewed for comparison. Common indica- tors are shares of primary energy, electricity, heat, and transport fuels from renewables. Global, Europe-wide, and country-specific scenar- ios show 10% to 50% shares of primary energy from renewables by 2050. By 2020, many targets and scenarios show 20% to 35% share of electricity from renewables, increasing to the range 50% to 80%
by 2050 under the highest scenarios. Carbon-constrained scenarios for stabilization of emissions or atmospheric concentration depict trade-offs between renewables, nuclear power, and carbon capture and storage (CCS) from coal, most with high energy efficiency. Sce- nario outcomes differ depending on degree of future policy action, fuel prices, carbon prices, technology cost reductions, and aggregate energy demand, with resource constraints mainly for biomass and biofuels.
Annu. Rev. Environ. Resourc. 2007.32:205-239. Downloaded from arjournals.annualreviews.org by UB Wuppertal on 07/16/08. For personal use only.
Primary energy:
energy available from coal, oil, gas, and biomass before burning or conversion to other forms; heat from nuclear fuel
Contents
INTRODUCTION. . . 206
SCENARIOS, MODELS, AND PARAMETERS . . . 207
Scenario Parameters . . . 208
CURRENT AND FUTURE SHARES OF RENEWABLE ENERGY . . . 210
GLOBAL SCENARIOS. . . 215
EUROPE TARGETS AND SCENARIOS . . . 218
COUNTRY-SPECIFIC TARGETS AND SCENARIOS . . . 221
Country Policy Targets . . . 221
United States. . . 222
Japan . . . 222
China . . . 223
Other Developing Countries . . . 223
Country “100% Scenarios” . . . 224
MUNICIPAL POLICY TARGETS AND SCENARIOS . . . 225
TECHNOLOGY PATHWAYS. . . 226
Long-Term Potentials and Growth Rates . . . 226
Distributed Power Generation . . . . 227
Hydrogen Combined with Renewables . . . 228
Electric Vehicle Technology . . . 229
Advanced Storage Technologies . . . 229
Nuclear Power and Carbon Capture and Storage . . . 230
CONCLUSIONS . . . 230
INTRODUCTION
Renewable energy has grown rapidly in recent years. Overall, renewables produced 16.5% of world primary energy in 2005. The share of world electricity from renewables was 19%, mostly from large hydropower (hydro) and the rest from other sources such as wind, biomass, solar, geothermal, and small hydro.
In addition, biomass and solar energy con- tribute to hot water and heating, and biofuels provide transportation fuels. Although large
hydro is growing at modest rates of 1% to 2%
annually, most other renewable technologies have been growing at rates of 15% to 60%
annually since the late 1990s. It is this group of technologies that is projected to grow the fastest in the coming decades, making renew- ables a highly significant and potentially ma- jority share of world energy (1–4).
Attention has become more focused on the future of renewables for a variety of en- vironmental, economic, social, and security reasons. There is a growing body of litera- ture describing that future, including policy targets, socioeconomic and technology sce- narios, carbon-constrained scenarios, and fu- ture social visions. Policy targets for future shares of renewable energy are described for regions, specific countries, states or provinces, and cities. Shares of renewable energy are also described in scenarios that show future en- ergy consumption on the basis of analytical models or projections. Some scenarios project forward using assumed growth rates or fu- ture technology shares on the basis of pol- icy, technology, economic, or resource factors.
Other scenarios project backward from spec- ified future conditions or constraints, such as limits to global carbon emissions, stabiliza- tion of atmospheric CO2concentration, min- imum or maximum energy consumption per capita, and sustainable land use. Scenarios can explore technologies, costs, policies, invest- ments, emissions, time frames, social appro- priateness, and shares relative to fossil fuels and nuclear energy.
Scenarios are part of the broader literature on renewable energy, which includes current technical-economic opportunities, resources, constraints and barriers of many forms, inte- gration strategies, policy experience, and rec- ommendations for the future (5–17). Many of the policy prescriptions found in this broader literature are common to policy frameworks or road maps that accompany renewable en- ergy scenarios. Most studies show that geo- graphic resources do not constrain aggregate amounts of renewables, with the possible ex- ception of biomass and biofuels. “Renewable Annu. Rev. Environ. Resourc. 2007.32:205-239. Downloaded from arjournals.annualreviews.org by UB Wuppertal on 07/16/08. For personal use only.
energy flows are very large in comparison with humankind’s use of energy. Therefore, in principle, all our energy needs, both now and into the future, can be met by energy from renewable sources” assert Johansson &
Turkenberg (18). Rather, cited constraints to renewables commonly include (a) costs rela- tive to conventional fuels; (b) intermittent and variable output relative to society’s need for constant energy flows; (c) the geography of where energy is needed versus where renew- able energy is most available; and (d) an array of institutional, social, and economic barriers.
This review focuses on global energy sce- narios (19–36); Europe-wide energy scenarios (37–48); and scenarios for individual coun- tries, including the United States (49–55), Japan (56, 57), and China (58–62); and other developing countries (63–69). Some global scenarios also give individual country cases.
European scenarios show the largest amount of future renewables, which is no surprise, because Europe currently leads the world in most metrics of renewables development, in- cluding investment, installed capacity, indus- try size, policy action, and use of policy tar- gets (3, 4). Chinese targets and scenarios also project high growth and large amounts. Some of the reviewed studies focus primarily on the role of renewables, but most are not renew- ables specific. Some works provide broader perspectives from which to understand the future (70–72). Also relevant is literature on emissions scenarios, including the Intergov- ermental Panel on Climate Change (IPCC) Special Report on Emissions Scenarios(73) and a greenhouse-gas emissions database with over 700 scenarios (74).
The approach of this review is exploratory.
It uses the scenario literature to ask the question: How much renewable energy can we expect or plan to have in the future?
The scenarios presented were selected be- cause they are the most recent, prominent, and comprehensive, although length and lan- guage limitations preclude many country- specific scenarios. The focus is on the re- sults of scenarios—the lowest, moderate, and
highest levels of the renewables use in com- ing decades. By broadly examining both pol- icy targets and scenarios together, something that is rare in the literature, targets can appear as “stepping stones” to scenario futures, and conversely scenarios can inform target setting.
SCENARIOS, MODELS, AND PARAMETERS
McDowall & Eames (75) offer a typology of energy future studies, categorizing them as either descriptive or normative. Under descriptive studies, “forecasts” predict likely futures from current trends, using extrap- olation and modeling; “exploratory scenar- ios” emphasize the drivers of possible fu- tures, without specifying a predetermined end state; and “technical scenarios” explore technology possibilities and configurations, emphasizing the feasibility and implications of different options. Under normative stud- ies, “visions” elaborate desirable and plausi- ble futures, emphasizing benefits; “backcasts”
start with a predetermined end point—a de- sirable (or constrained) future—and then in- vestigate the pathways and technology con- figurations leading there; and “road maps”
prescribe sequences of policies and measures.
Most of the studies reviewed here are sim- ply called scenarios, although they represent a balance among primarily technical scenarios, backcasts, and visions according to the typol- ogy of McDowall & Eames.
Scenarios are an important tool for dealing with complexity and uncertainty about the fu- ture. They allow exploring alternative futures and can “provide insights to energy planners, influence the perceptions of the public and the energy policy community, capture cur- rent understanding of underlying physical and economic principles, or highlight key emerg- ing social or economic trends,” note Craig et al. (76). However, scenarios are not predic- tions. Attempts to forecast energy futures have historically underestimated the importance of surprise and uncertainties. Rather, scenar- ios could be seen as “if. . .then” queries: If Annu. Rev. Environ. Resourc. 2007.32:205-239. Downloaded from arjournals.annualreviews.org by UB Wuppertal on 07/16/08. For personal use only.
policies accelerate the growth of renewables, what is the difference between situations with and without policies? If renewables’ costs decline, how will markets shift investment patterns? If CO2emissions should be stabi- lized, what combinations of renewables and other technologies will achieve stabilization?
These questions must be answered under a set of conditions, interrelationships, and/or con- straints for population, economic growth, en- ergy demand, technology changes, technol- ogy and fuel costs, environmental emissions, and changes in the structure of the economy.
Modeling tools are commonly used to carry out scenario analysis, with a range of software tools available (77–79). Categories of models include techno-economic, partial and general equilibrium, simulation, opti- mization, and end-use accounting (78, 79).
The entire economy may be modeled, or just the energy system or energy demand. The International Energy Agency (IEA) World Energy Model, used for theWorld Energy Out- look (WEO) (21, 26), has been refined over more than a decade and comprises 16000 equations defining interrelationships among energy, economy, technology, investment, re- sources, and environment. MARKAL is a common cost-optimization tool that iden- tifies least-cost mixes of energy technolo- gies and fuels to meet energy demand within specified constraints (22, 66, 68). LEAP is a common accounting tool for energy plan- ning that tracks energy consumption, con- version, and production under a range of as- sumptions (62, 80). European Commission (EC) studies use the energy modeling tools Green-X, PRIMES, and POLES, among oth- ers (20, 37–39, 46). Four U.S. studies use the NEMS modeling tool and variants (51–
55). Greenpeace & European Renewable En- ergy Council (EREC) (19) scenarios use the MESAP/PlaNet and MESSAGE modeling tools together. The IPCC (73) uses AIM, MINICAM, MESSAGE, MARIA, ASF, and IMAGE modeling tools, and reports sep- arately on the results of each applied to common “story lines,” with different results
depending on the model used. In general, the modeling approach has a significant impact on both data requirements and results (but these are not within the scope of this article).
Beyond the models themselves, many consider scenario construction to be some- thing of an art, requiring skill at making good simplifying representations of social and economic dynamics and not just writ- ing energy-balance equations or characteriz- ing technological change (81). From this per- spective, scenario construction is best done collectively, drawing upon diverse perspec- tives as Shell and the World Business Council for Sustainable Development (WBCSD) have done (25, 27, 32, 35).
Scenario Parameters
Most scenarios use parameters that include some combination of population, gross do- mestic product (GDP), energy intensity and demand, fuel costs, carbon prices, technology costs, and degree of policy action. These pa- rameters could be considered the drivers for renewable energy and other energy technolo- gies. Parameters may be based on story lines of socioeconomic conditions, expectations about technological change, policy drivers, pro- jected growth rates, or other considerations.
Below are some parameters from the global and European scenarios.
Population. The IEA WEO (21) projects 8.1 billion people by 2030, with an average population growth of 1% each year through 2030, although population growth is expected to increase faster at 1.1% in earlier years (2004–2015) and to slow down to 0.8% in later years (2015–2030). Many studies use and ex- tend these figures to 2050. By 2050, a com- mon projection in several studies is about 9 billion (19, 22, 25, 27). IPCC (73) scenarios give a range from 8.3 to 11.3 billion in 2050, with most scenarios projecting about 9 billion.
For Europe, most recent scenarios share sim- ilar assumptions, with population constant or marginally increasing to 470 million by 2030, Annu. Rev. Environ. Resourc. 2007.32:205-239. Downloaded from arjournals.annualreviews.org by UB Wuppertal on 07/16/08. For personal use only.
up from 453 million in 2000 (38). After 2030, some scenarios show a decrease to 430 million in 2050 (20, 45).
Gross domestic product. The IEA WEO (21) projects world GDP will grow an aver- age 3.4% per year from 2004 to 2030, com- pared with 3.2% from 1980 to 2004. An- nual GDP growth is projected in two stages:
4% from 2004 to 2015 and then 2.9% from 2015 to 2030. China, India, and other devel- oping countries are expected to continue to grow faster than these averages. Per capita GDP grows from $9250 to $17,200 and total GDP increases 2.4-fold from $58 to $140 tril- lion (2004 to 2030), using 2005 dollars on a purchasing-power parity basis.1Many other energy scenarios use the IEA projections.
Greenpeace & EREC (19) assume a 3.4-fold increase to 2050 (using a 2.7% per year aver- age). IPCC (73) scenarios show world GDP increasing between 1.5-fold and 4.8-fold from 1990 to 2050. For Europe, most scenarios project continued modest growth of ∼2%
(20, 38).
Energy demand and intensity. Energy in- tensity reflects both changes in the structure of the economy and improvements in en- ergy efficiency. In the IEA’s Energy Technol- ogy Perspectives(ETP) (22) “ACT Map” sce- nario, energy-efficient technologies reduce global energy consumption by 24% in 2050 compared to the reference scenario. The Global Wind Energy Council (GWEC) &
Greenpeace (23) “high-efficiency” scenario projects 39% lower electricity consumption in 2050 compared to a reference scenario. In the Greenpeace & EREC (19) “revolution”
scenario, energy intensity decreases threefold owing to energy efficiency, and world en- ergy demand in 2050 is about the same as in 2003 despite economic growth. The German Advisory Council (28) scenario also shows global energy intensity falling threefold but
1All money amounts are in U.S. dollars.
Exajoule (EJ or 1018joules):
measures large quantities of primary energy; million tons oil equivalent (mtoe=0.042 EJ) is also a common unit still results in a doubling of energy demand by
2050. Other studies show energy intensity de- clines of twofold to 4.8-fold by 2050 (25, 73).
Overall, projected world energy consumption by 2050 ranges from 560 to 1600 exajoules (EJ), compared to 480 EJ in 2004. In Eu- ropean scenarios, projected energy growth is lower, with primary energy 55–90 EJ by 2030, compared to 73 EJ in 2005.
Fossil fuel and carbon prices. Scenarios differ in assumptions about fossil fuel prices.
IEA scenarios show oil prices remaining in the $48–$62 (per barrel) range through 2030, with natural gas prices tracking due to con- tinued oil-price indexation. In contrast, the Greenpeace & EREC (19) scenario expects oil prices to reach $95 by 2030 and $110 by 2050. EIA projects $54 in 2025, revised from $33 projected a year earlier (51). Sce- narios also differ in assumptions about carbon prices with common values $7 to $15 (per ton CO2) in 2050 and higher values up to $50 (19, 22). European scenarios show a wide range of carbon prices under the European Emission Trading Scheme, from 5 to 20 (per ton CO2) under low- or least-cost scenarios (37, 38, 44) and up to 65 under another predic- tion (44). Thus carbon prices have become a wild card in European scenarios, particu- larly because prices were fluctuating greatly in Europe in 2005/2006. (All preceding prices are given in 2004–2005 dollars or euros.) Renewable energy technology costs. IEA studies have projected renewable energy tech- nology cost reductions to 2010 and 2025 (13–15). Most policy-intensive scenarios show continued cost reductions through 2050.
IEA’s ETP (22) projects that solar photo- voltaic (PV) electricity costs will decline to 6–30 cents per kWh (from 18–50 cents to- day); onshore wind, to 3.5–20 cents (from 4–
22 cents); and offshore wind, to 6–18 cents (from 6.6–22 cents). Small and large hy- dro, biomass, and geothermal decline slightly.
Others project declines of wind power to 3.5–
5 cents per kWh, solar PV to 5–9 cents, Annu. Rev. Environ. Resourc. 2007.32:205-239. Downloaded from arjournals.annualreviews.org by UB Wuppertal on 07/16/08. For personal use only.
Carbon stabilization:
leveling of atmospheric concentration of CO2, CO2 equivalents, or annual CO2
emissions by a future year
and concentrating solar thermal power (CSP) to 5–8 cents (19, 23). The European Solar Thermal Technology Platform (ESTTP) (41) shows solar heating capital costs per kW- thermal of capacity declining almost threefold from 1100 to 400 (2005–2030). IEA’s ETP (22) shows reduced biofuel costs from the introduction of cellulose-to-ethanol technol- ogy and increased crop yields under one sce- nario. Some scenarios include learning curves in their models, which project future cost re- ductions on the basis of past history and cumu- lative technology production over time (82).
Carbon stabilization and emissions con- straints. A number of scenarios set atmo- spheric CO2 stabilization levels of either 450 ppm (19, 28), 500 ppm (20), or 550 ppm by 2050 (25, 30). Other scenarios constrain cumulative CO2 emissions by 2050, starting from a base year, or reduce annual emis- sions relative to 1990 levels. For example, one Chinese scenario constrains cumulative car- bon emissions from China to 66 gigatons (Gt) between 1995 and 2050 (59). The Greenpeace
& EREC (19) scenario constrains global an- nual carbon emissions to 11 Gt CO2by 2050.
A carbon constraint of 80% of 1990 emis- sions by 2050 appears in German and Dutch scenarios (83, 84).
Policy action. There is wide recognition that policies have underpinned renewable energy development over the past decades and that the need for policies will continue well into the future. Therefore, both the degree of pol- icy action and the description of policies are central to scenarios. Reference scenarios typ- ically envision low levels of policy action. The IEA’s WEO (21) reference scenario “does not take into account possible, potential, or even likely future policy actions” and thus shows
“how energy markets would evolve if govern- ments do nothing beyond what they have al- ready committed.” In contrast, the “alterna- tive policy” scenario “analyses the impact of a range of policies and measures that coun- tries are considering adopting or might rea-
sonably be expected to adopt” (21). Existing policy targets can serve as points of departure for higher levels of policy action and higher future targets. This is particularly true in sce- narios for Europe, where considerable politi- cal attention is currently directed to policy tar- gets. Reference scenarios tend to project less than full implementation of targets, whereas policy scenarios envision full implementation and more as well as continued increases in tar- gets and mandates.
Scenarios envision a wide range of new and strengthened policies (8–11). Electric power policies include feed-in laws, port- folio standards, guaranteed grid access, net metering, and distributed generation poli- cies. Biofuel policies include blending man- dates and tax exemptions. Building policies include integration of solar hot water and solar PV into new construction. Economic incentives include tax credits, subsidies, and tax exemptions. Research and development policies (leading to reduced technology costs) include direct funding, technology coopera- tion agreements, joint ventures, and demon- stration programs. Financing policies include loans and grants. Other policies include di- recting international development assistance to renewables, reducing subsidies for fossil fu- els and nuclear power, incorporating external costs into energy prices, removing market and institutional barriers, strengthening human resources, restructuring or liberalizing en- ergy markets, and enacting appliance, build- ing, and vehicle efficiency standards and other efficiency measures. Some European scenar- ios also envision strengthening the European Emission Trading Scheme and carbon pric- ing as well as enacting post-Kyoto emission reduction targets.
CURRENT AND FUTURE SHARES OF RENEWABLE ENERGY
Targets and scenarios tend to be summarized in terms of the share of primary energy, elec- tricity, or transport fuels from renewables, Annu. Rev. Environ. Resourc. 2007.32:205-239. Downloaded from arjournals.annualreviews.org by UB Wuppertal on 07/16/08. For personal use only.
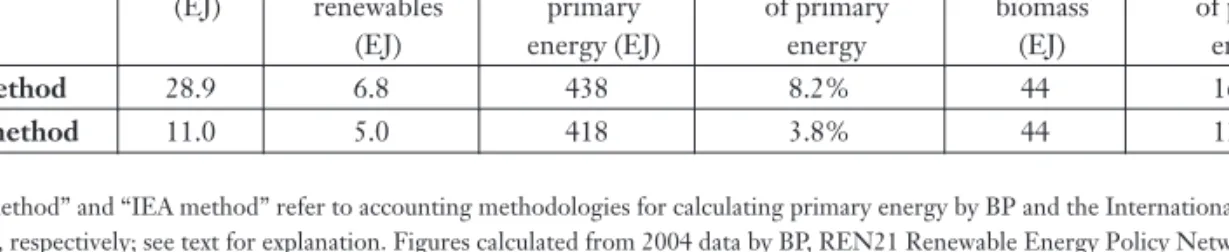
Table 1 Share of world primary energy from renewables—four types of accounting (2004)a Excluding traditional biomass
Including traditional biomass Hydro
(EJ)
Nonhydro renewables
(EJ)
World primary energy (EJ)
Renewables share of primary
energy
Traditional biomass
(EJ)
Renewables share of primary
energyb
BP method 28.9 6.8 438 8.2% 44 16.5%
IEA method 11.0 5.0 418 3.8% 44 13.0%
a“BP method” and “IEA method” refer to accounting methodologies for calculating primary energy by BP and the International Energy Agency, respectively; see text for explanation. Figures calculated from 2004 data by BP, REN21 Renewable Energy Policy Network for the 21st Century, and IEA (1–4, 21). Total renewables equal hydro plus nonhydro renewables plus traditional biomass.
bBoth total world primary energy and total renewables increase by the amount of traditional biomass.
although there are alternative indicators and portrayals found in the literature; some are discussed below. However, one quickly con- fronts a fundamental but mostly unacknowl- edged problem: The term “share of primary energy from renewables” is ambiguous and causes confusion because there are actually four different ways to define the phrase (see Table 1). Each way is legitimate but uses a different accounting method. In 2004, re- newables provided 80 EJ of global primary energy (16.5% share) according to the “BP method” but only 60 EJ (13% share) accord- ing to the “IEA method” if traditional biomass is included. Excluding traditional biomass, the numbers become 36 EJ (8.2% share) ac- cording to the BP method and 16 EJ (3.8%
share) according to the IEA method. (There are also other accounting differences be- tween BP and IEA statistics of world primary energy.)
BP uses its method in its annualStatistical Review of World Energy(1). The BP method is also used in the REN21 Renewable Energy Policy Network for the 21stCentury (REN21) Renewables Global Status Report(3, 4) and in other prominent portrayals of renewables in the global energy balance, such as the 2000 World Energy Assessment(6) by the UN Devel- opment Programme [which later changed to the IEA method for its 2004 update (5)], and it has been used by analysts in the literature for at least the past decade (55, 67, 85). Most agencies and governments around the world
Traditional biomass:
unprocessed agricultural residues, fuel wood, and animal dung burned in stoves or furnaces, typically in rural areas
now use the IEA method. Although the IEA method appears to be much more common in the scenario literature, authors often do not explain which method is used. This causes in- compatibility across scenarios and makes reli- able comparisons difficult if not impossible. It also distorts the numbers. The share of renew- ables for a scenario using the IEA method will become significantly higher if the BP method is applied.
The basic accounting problem is how to count the primary energy associated with re- newable electricity. For electricity from fossil fuels, primary energy is the energy input to a power plant to generate the electricity. For electricity from nuclear, the convention has been to count the nuclear heat input (equiv- alent to fossil fuel primary input) to gener- ate the electricity. Because renewables (except biomass) do not require a power plant, the IEA method simply counts the electricity it- self as primary energy. The BP method counts the “equivalent primary energy” of fossil fuels needed to generate the electricity. The dif- ference between the two methods is the en- ergy loss (waste) in a power plant, which is usually about two thirds of the energy input.
The correction required is to multiply renew- able electricity by the inverse of typical power plant efficiency to get equivalent primary en- ergy; BP uses a correction factor of (1/0.38), or 2.6.
A simple way to understand the issue is to compare hydro and nuclear in the reported Annu. Rev. Environ. Resourc. 2007.32:205-239. Downloaded from arjournals.annualreviews.org by UB Wuppertal on 07/16/08. For personal use only.
Terawatt-hour (TWh): measures large quantities of electricity, equal to one billion kilowatt hours (kWh); kWh more commonly measures consumption Final energy:
energy consumed by a building, factory, or car, counting the energy value of actual electricity, gasoline, coal, or gas used
share of primary energy. In 2004, hydro and nuclear produced roughly equal amounts of electricity worldwide, 2740 terawatt-hours (TWh) for nuclear and 2810 TWh for hydro (86). BP reports the share of world primary energy from nuclear as 6.1% and from hydro as 6.2%. The IEA reports the share of primary energy from nuclear as 6.5%, equivalent to BP given other accounting differences (e.g., different assumed conversion efficiencies and inclusion of traditional biomass). But the IEA reports the share from hydro as only 2.2%.
This 2.2% share for hydro is cited widely (5, 87). When compared with 6.5% from nuclear, it appears that nuclear contributes three times as much useful value to the energy system as hydro, when in fact the useful value (kWh pro- duced) of nuclear and hydro is exactly equal.
Thus, the IEA method perceptually distorts the contribution of hydro to the world energy system. This is also true for wind and solar, which fall into the same analytical category, but not for biomass where physical energy in- puts can be counted in a way similar to that for fossil fuels. Geothermal is sometimes treated like nuclear. (This review reports renewables’
shares as given in source material without cor- rection or notation as to whether they are based on the IEA or BP method. A reader may discern the method used in some scenar- ios with a close reading and may presume the IEA method in ambiguous scenarios.)
Another problem in reporting primary energy shares of renewables concerns the treatment of traditional biomass in develop- ing countries. Worldwide, traditional biomass represents about 9% of primary energy con- sumption (3), yet many scenarios do not spec- ify whether traditional biomass is included or excluded, making it difficult to judge the share and growth of other forms of renew- ables. Further complicating the picture is that IEA statistics do not separate traditional biomass from modern biomass (for large-scale power and heat, gasification), so primary en- ergy shares of renewables reported by the IEA either include traditional biomass or ex- clude all forms of biomass (called combustible
renewables and waste) (88). Some authors have advocated future targets and scenarios for new renewables only, excluding traditional biomass by arguing that at least a portion of traditional biomass is not sustainable (because it can lead to deforestation and can also be a major cause of indoor air pollution, among other things) and therefore should not be con- sidered renewable (89). (This review reports renewables’ shares as given in source material without any correction for traditional biomass and mostly without notation as to whether tra- ditional biomass is included.)
Share of primary energy remains the dom- inant indicator for most scenarios (Table 2).
Four alternative indicators are gaining in- creased use in studies and policy discus- sions.
1. Share of final energy. Few statistics are available for this indicator, and few sce- narios use it. (Scenarios often show share of final energy by end-use sector and sometimes by final biomass or solar heat use, but not by renewable shares of final electricity consumption.) This in- dicator counts the energy value of elec- tricity equally for all forms—fossil, nu- clear, and renewables, but in statistical practice, this is difficult to do.
2. Share of electricity. This indicator is common in many scenarios, and statis- tics are available for many countries (Table 3). In 2005, renewables pro- vided about 19.5% of world electric- ity production of 17500 TWh (1–4).
Large hydro accounted for about 16.2%
and other renewables about 3.3%. Some scenarios separate large hydro from new renewables, allowing sharper focus on future increments of new renewables, which are growing much faster than large hydro (66, 80).
3. Share of low-temperature heat. This in- dicator is rarely used in scenarios but is becoming more important as biomass, solar, and geothermal increase their contributions to heating and hot wa- ter. A surrogate is the thermal capacity Annu. Rev. Environ. Resourc. 2007.32:205-239. Downloaded from arjournals.annualreviews.org by UB Wuppertal on 07/16/08. For personal use only.
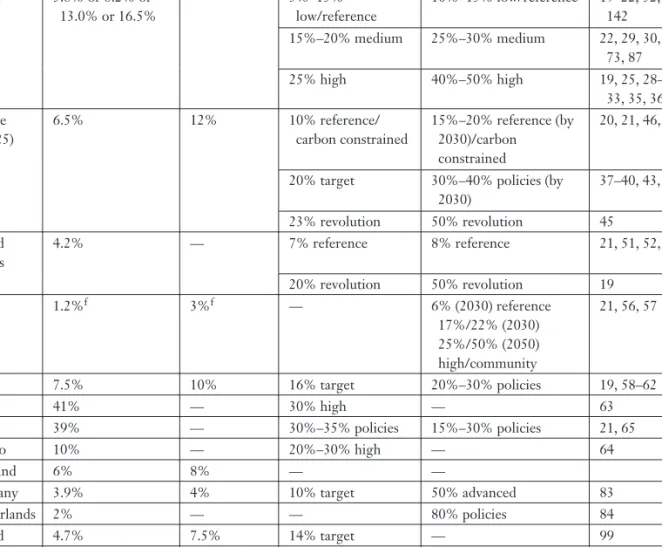
Table 2 Share of primary energy from renewables—policy targets and scenariosa Region/
country 2004 actualb
2010 policy targetsc
2020 policy targets
or scenariosd Up to 2050 scenariose
References for scenarios World 3.8% or 8.2% or
13.0% or 16.5%
— 5%–15%
low/reference
10%–15% low/reference 19–22, 32, 73, 87, 142
15%–20% medium 25%–30% medium 22, 29, 30, 32, 33, 73, 87
25% high 40%–50% high 19, 25, 28–30, 31,
33, 35, 36 Europe
(EU25)
6.5% 12% 10% reference/
carbon constrained
15%–20% reference (by 2030)/carbon constrained
20, 21, 46, 47
20% target 30%–40% policies (by 2030)
37–40, 43, 46–48
23% revolution 50% revolution 45
United States
4.2% — 7% reference 8% reference 21, 51, 52, 54, 55
20% revolution 50% revolution 19
Japan 1.2%f 3%f — 6% (2030) reference
17%/22% (2030) 25%/50% (2050) high/community
21, 56, 57
China 7.5% 10% 16% target 20%–30% policies 19, 58–62
Brazil 41% — 30% high — 63
India 39% — 30%–35% policies 15%–30% policies 21, 65
Mexico 10% — 20%–30% high — 64
Thailand 6% 8% — —
Germany 3.9% 4% 10% target 50% advanced 83
Netherlands 2% — — 80% policies 84
Poland 4.7% 7.5% 14% target — 99
Spain 6.2% 12.1% — —
aPolicy targets and 2004 actual are from International Energy Agency (IEA), REN21 Renewable Energy Policy Network for the 21st Century, and European Commission publications (2–4, 12, 63, 88, 93–94), supplemented by data from scenarios cited. Most targets and scenarios count (or are presumed to count) renewable electricity according to the IEA method (see text); but the numbers would be higher if the BP method were applied.
Targets or scenarios may not specify which method is used. Most global scenarios include traditional biomass, but some country targets and scenarios do not (e.g., the numbers shown for Thailand and China exclude traditional biomass). “Policies” means policy-intensive; “reference” also means “baseline.”
bWorld actual 2004 depends on the accounting method used; seeTable 1and the text. For comparison with most targets and scenarios, the 13%
actual (IEA method with traditional biomass) should be used. Estimates for Europe actual 2004 vary from 5.6% to 7.5%.
cThailand target for 2011.
dNo world policy targets exist; the Mexico scenario is for 2025.
eMost scenarios in this column are for 2050, except the world (29) for 2040; and the following are for 2030: world (21), Europe (21, 38–40, 43), United States (21, 51), and Japan (21, 56).
fJapan’s 1.2% share in 2004 and 3% target in 2010 exclude large hydro and geothermal. The share in 2004 including those sources has been reported as either 3.4% or 5.2%.
Annu. Rev. Environ. Resourc. 2007.32:205-239. Downloaded from arjournals.annualreviews.org by UB Wuppertal on 07/16/08. For personal use only.
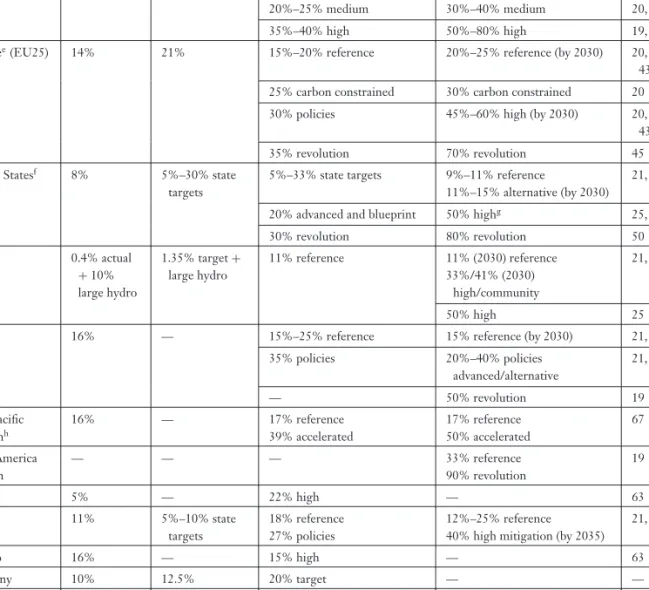
Table 3 Share of electricity from renewables—policy targets and scenariosa Region/
country
2005 actualb
2010 policy targets
2020 scenarios or policy
targetsc Up to 2050 scenariosd
References for scenarios
World 19% — 15%–20% low/reference 15%–25% low/reference 19, 22
20%–25% medium 30%–40% medium 20, 22, 23
35%–40% high 50%–80% high 19, 25, 29
Europee(EU25) 14% 21% 15%–20% reference 20%–25% reference (by 2030) 20, 21, 38–40,
43, 47 25% carbon constrained 30% carbon constrained 20
30% policies 45%–60% high (by 2030) 20, 25, 38–40,
43, 46, 47
35% revolution 70% revolution 45
United Statesf 8% 5%–30% state
targets
5%–33% state targets 9%–11% reference
11%–15% alternative (by 2030) 21, 51
20% advanced and blueprint 50% highg 25, 49, 52, 53, 55
30% revolution 80% revolution 50
Japana 0.4% actual
+10%
large hydro
1.35% target+ large hydro
11% reference 11% (2030) reference 33%/41% (2030)
high/community
21, 56
50% high 25
China 16% — 15%–25% reference 15% reference (by 2030) 21, 60
35% policies 20%–40% policies
advanced/alternative
21, 25, 58–62
— 50% revolution 19
Asia-Pacific regionh
16% — 17% reference
39% accelerated
17% reference 50% accelerated
67
Latin America region
— — — 33% reference
90% revolution
19
Brazila 5% — 22% high — 63
Indiai 11% 5%–10% state
targets
18% reference 27% policies
12%–25% reference 40% high mitigation (by 2035)
21, 61, 66, 67
Mexico 16% — 15% high — 63
Germany 10% 12.5% 20% target — —
South Korea 1% 7% — — —
aPolicy targets and 2005 actual figures are from International Energy Agency (IEA), REN21 Renewable Energy Policy Network for the 21st Century (REN21), and European Commission (EC) publications (2–4, 12, 63, 88, 93, 94), supplemented by data from scenarios cited. Most targets and scenarios include large hydro, but some may not. The scenarios for Brazil and Japan’s target of 1.35% by 2010 exclude large hydro.
bThe Europe actual is for 2004. The Asia-Pacific region actual is for 2000. Figures are rounded to nearest whole percent.
cThe Asia-Pacific region scenario is for 2025.
dMost scenarios are for 2050, except world (29) for 2040, and the following are for 2030: Europe (21, 38–40, 43), United States (21, 51), and Japan (21, 56).
eThe EC in 2006 anticipated an actual 18% share of electricity by 2010.
fPolicy targets are given equivalent to state-level renewable portfolio standards (RPS) policies in most U.S. states; no national-level target exists.
California in 2005 proposed 33% share by 2020, up from 20% RPS by 2017 (http://www.newrules.org, viewed 1/31/07).
gThe World Business Council for Sustainable Development (25) scenario for 2050 of 50% is for Canada and United States combined.
hAsia-Pacific region includes Australia, Brunei Darussalam, Canada, Chile, China, Chinese Taipei, Hong Kong, Indonesia, Japan, Korea, Malaysia, Mexico, New Zealand, Papua New Guinea, Peru, Philippines, Russia, Singapore, Thailand, United States, and Vietnam.
iIndia has national policy targets of 10% of new capacity added from 2003 to 2010, 15% of total capacity by 2032, plus RPS policies in several states that serve as state targets.
Annu. Rev. Environ. Resourc. 2007.32:205-239. Downloaded from arjournals.annualreviews.org by UB Wuppertal on 07/16/08. For personal use only.
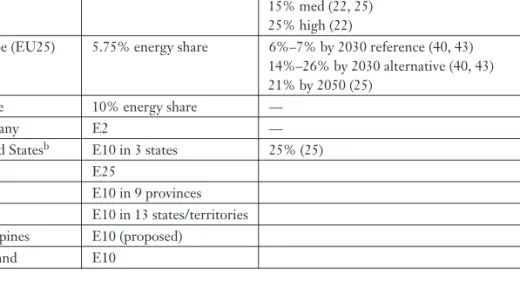
Table 4 Share of transport energy from renewables (biofuels)—policy targets and scenarios
Region/country
2008–2015 policy targetsa
Up to 2050 scenarios with references in parentheses
World — 3% low (22)
15% med (22, 25) 25% high (22)
Europe (EU25) 5.75% energy share 6%–7% by 2030 reference (40, 43) 14%–26% by 2030 alternative (40, 43) 21% by 2050 (25)
France 10% energy share —
Germany E2 —
United Statesb E10 in 3 states 25% (25)
Brazil E25
China E10 in 9 provinces
India E10 in 13 states/territories Philippines E10 (proposed)
Thailand E10
aSource for policy targets: Renewable Energy Policy Network for the 21st Century (REN21) (3–4). E2, E10, and E25 refer to a blending mandate for blending all gasoline with 2%, 10%, or 25%, respectively, ethanol, which would result in a smaller share of transport fuels, taking into account other fuels not affected by the mandate, such as diesel and aviation fuel. Data on transport energy shares of biofuels implied by these blending requirements are often not readily available. Blending requirements for biodiesel are also appearing in several countries, typically B2 or B5; see REN21 (3–4).
b2050 scenario is for the United States and Canada combined.
installed, expressed as GWth. No statis- tics are available for a world total, and this indicator exists only for a few coun- tries. Europe’s share is about 7%.
4. Share of transport energy from renew- able fuels. This indicator is becoming more common in scenarios as biofuels production has grown rapidly in recent years and new policy targets and man- dates have been enacted (Table 4). No statistics are available for a world total.
Europe’s share is about 1%.
GLOBAL SCENARIOS
Ten of the most prominent and recent global scenarios are described below. These are sum- marized in Tables 2–4 along with several other global scenarios reviewed (29–31, 36).
1. The IEA’s World Energy Outlook 2006 (21) provides an often-cited reference scenario for 2030 that predicts 720-
EJ world primary energy supply (up from 480 EJ in 2004) of which renew- ables are 100 EJ (14%). Electricity in 2030 is 33,800 TWh (up from 18,200 TWh in 2005) of which renewables are 7100 TWh (21%). The alternative pol- icy scenario includes additional policies to support renewables that are con- templated or expected but not yet en- acted. This scenario shows renewables achieving 16% of primary energy and 26% of electricity by 2030 with gains in biomass, wind, solar, and geothermal.
2. The IEA’sEnergy Technology Perspectives (22) gives several scenarios that go be- yond theWorld Energy Outlookand that differ on pace of cost reductions and technology development. The ACT Map scenario shows aggressive pol- icy action, energy intensity reductions, and technology cost reductions through deployment and learning. Biofuels Annu. Rev. Environ. Resourc. 2007.32:205-239. Downloaded from arjournals.annualreviews.org by UB Wuppertal on 07/16/08. For personal use only.
Carbon capture and storage (CCS):
removal of carbon from power plant emissions or fuel and injection into geological
formations or oceans
becomes a viable transportation fuel with increased crop yields and commer- cial cellulose-to-ethanol technology.
Carbon capture and storage (CCS) becomes viable, and nuclear power increases significantly. Three variations of ACT Map are a low-renewables case with slower cost reductions, a low- nuclear case, and a no-CCS case that as- sumes CCS remains commercially un- available. Under ACT Map, the share of primary energy for renewables is 24% by 2050, compared to 11% in the reference scenario, and the share of electricity is 31%, compared to a 15%
reference. A separate “TECH Plus” sce- nario envisions even higher technology progress for renewables, nuclear, hy- drogen fuel cells, and advanced biofuels with renewables’ share of primary en- ergy reaching 30% by 2050.
3. The German Advisory Council on Global Change’s (28) “exemplary path”
scenario achieves 450 ppm CO2 at- mospheric stabilization. The scenario places several additional constraints on energy beyond carbon, including re- strictions on land use for biomass en- ergy crops, limits on urban air pollution levels, avoidance of nuclear power, and achieving a minimum economic output per capita for all countries. This sce- nario shows supply of 620 EJ of renew- ables in 2050 (up from 80 EJ total in 2004) of which 288 EJ is solar PV, 135 EJ is wind, and 100 EJ is modern biomass.
Renewables reach 50% of primary en- ergy supply by 2050.
4. A World Business Council on Sustain- able Development’s (25) scenario envi- sions 50% of electricity from renew- ables by 2050. Nuclear power triples by 2050, and CCS from coal becomes commercial after 2025, such that by 2050, half of world’s coal power gen- eration uses CCS. Hydrogen becomes a fuel for vehicles after 2025, attaining a 25% share of vehicle transport fuel by
2050. Solar PV grows by an sustained annual average of 20% through 2050, spurred by distributed generation and local energy storage, to become 15% of world electricity consumption—one of the highest estimates for solar among global scenarios. Wind and geother- mal grow by an annual average of 11%
through 2050 to increase 160-fold, and hydro doubles.
5. Shell produced three scenarios, with the original 1996 “sustainable develop- ment” scenario showing 50% of world primary energy from renewables by 2050 (35). That scenario was widely cited for a number of years. Subse- quently, Shell’s “spirit of a new age”
in 2001 showed a future energy sys- tem emerging by 2030, which employs hydrogen and fuel cells and limits the growth of renewables (with hydrogen initially produced from fossil fuels using carbon sequestration) (32). Renewables attain a 28% share of primary energy by 2050. Complimenting that scenario was “dynamics as usual,” with a con- tinuing dominant role for electricity, hybrid vehicles, advanced biofuels, and renewables attaining a 33% share of primary energy. Then in 2005, “low- trust globalization,” “open doors,” and
“flags” scenarios were envisioned with (a) varying fortunes of globalization, regulation, and markets and with (b) re- newables reaching either 280 or 330 EJ by 2025 (27).
6. The Greenpeace & EREC (19) revo- lution scenario envisions the complete phaseout of nuclear power, drastically lower energy demand through energy efficiency improvements, no carbon capture and storage, and attainment of 450 ppm CO2 atmospheric stabiliza- tion. The result is a 50% primary energy share for renewables by 2050 and an ag- gregate energy demand in 2050 that is the same as 2003, even as population increases 1.4-fold and GDP increases Annu. Rev. Environ. Resourc. 2007.32:205-239. Downloaded from arjournals.annualreviews.org by UB Wuppertal on 07/16/08. For personal use only.
3.4-fold. Electricity share is 70% re- newables with the rest mainly natural gas. The share of electricity from coal falls to 9% by 2050, from 35% in 2003.
The study assumed annual growth rates for wind power of 26% through 2010, 20% for 2010–2020, 7% for 2020–2030, and then below 5%. Growth rates of so- lar PV are 36% through 2010, 25% for 2010–2020, 14% for 2020–2030, 7% for 2030–2040, and then below 5%.
7. The GWEC & Greenpeace (23) “ad- vanced” scenario envisions aggressive policies and cost reductions leading to 34% of world electricity from wind by 2050 in a high-efficiency case where electricity consumption in 2050 is only 1.7-fold higher than 2003. (Without high efficiency, the advanced scenario for 2050 shows a 21% share of electric- ity and world electricity consumption 2.8-fold higher than 2003.) Under the advanced scenario, by 2020, wind power costs fall to US3.5 to 4.5 cents/kWh at good sites, and installed capacity reaches 1000 gigawatts (GW) (from 75 GW in 2006). Installed capacity ex- ceeds 2000 GW by 2030 and 3000 GW by 2050.
8. The EC’sWorld Energy Technology Out- look (WETO)–2050 (20) study devel- oped “carbon constraint” and “hydro- gen” scenarios. The carbon constraint scenario works backward from stabi- lizing atmospheric CO2 concentration at 500 ppm by 2050, using renew- ables, nuclear power, and carbon cap- ture and storage. Early action is as- sumed in developed countries, with later action in developing countries.
The hydrogen scenario assumes a de- liberately optimistic series of technol- ogy breakthroughs that increase cost- effectiveness. World primary energy reaches 920 EJ in the reference sce- nario and about 800 EJ in both the carbon-constrained and hydrogen sce- narios. The reference scenario predicts
Gigawatt (GW or 109watts):
measures large amounts of electric power capacity; a typical power plant is about one GW 15% primary energy and 21% electric-
ity from renewables by 2050, which in- creases to 18% to 20% primary energy and 30% electricity in the carbon con- straint and hydrogen scenarios.
9. The International Institute for Applied Systems Analysis and the World Energy Council (33) developed six scenarios in the 1990s, showing different levels of global economic development and en- ergy use. Scenarios A1–A3 show high economic growth, with A3 the most sustainable case showing a shift to re- newables, nuclear, and natural gas. Sce- nario C is high growth for developing countries and uses carbon and energy taxes that promote renewables and effi- ciency; C1 sees a phaseout of nuclear power, whereas C2 sees development of the next generation of socially ac- ceptable reactors, which limits renew- ables. Primary energy share from re- newables ranges from 22% to 40% by 2050 among the six scenarios, with sce- nario C1 showing the highest.
10. The IPCC’s Special Report on Emis- sions Scenarios (7, 73) used six differ- ent models and four story lines, result- ing in 40 scenarios. The scenarios differ in population, economic development, and energy intensities, but they also dif- fer because different models produce different results for the same condi- tions. The A1 story line envisions rapid economic development equalizing rich and poor, whereas A2 sees less growth and slower change. Story lines B1 and B2 envision high environmental con- sciousness, and B2 is policy intensive with policies and business influenced by environmental concerns and movement toward local self-reliance and commu- nity. Total primary energy supply ranges from 640 to 1600 EJ by 2050, and re- newables range from 70 EJ to 440 EJ.
The primary energy share of renewables is highest for the subscenario A1T and the B1 scenario, i.e., 16% to 35%, with Annu. Rev. Environ. Resourc. 2007.32:205-239. Downloaded from arjournals.annualreviews.org by UB Wuppertal on 07/16/08. For personal use only.
large technological change and reduc- tions in renewables’ costs for the A1T subscenario.
In summary, by 2050, renewable energy varies from 70 EJ to 450 EJ primary energy supply according to most of the global sce- narios reviewed (Figure 1), with a few even higher. This compares with a range of total primary energy from the same scenarios of 600 to 1600 EJ. Global scenarios for share of primary energy by 2050 can be grouped into three categories: low (15%), medium (25% to 30%), and high (40% to 50%) (Table 2). For the share of world electricity by 2050, refer- ence scenarios show 15%, medium scenarios 30% to 40%, and high scenarios 50% to 80%
(Table 3) with total generation from renew- ables ranging from 7200 to 37,000 TWh (Fig- ure 2). The few scenarios showing the share of transport energy from biofuels in 2050 show a wide range, from a low of 3% to a high of 25% (Table 4).
The IEA ETP (22) reference scenario is one of the lowest for renewables with 11% primary energy share by 2050. In con- trast, several global scenarios show a 50%
share by 2050, including Shell’s sustainable development, Greenpeace & EREC’s “rev- olution,” the Germany Advisory Council’s exemplary path, WBCSD’s scenario (25), the EREC’s (29) “advanced international policies scenario” (by 2040), the Aitken et al. (30) “10%/20%/50%” scenario (with 10% by 2010 and 20% by 2020), and the Stockholm Environment Institute & Global Scenario Group’s “great transition” (31). One of the earliest was the Johansson et al.
(36) “renewables-intensive global energy sce- nario,” which envisioned, back in 1993, a 46%
share by 2050. Other global scenarios fall between the IEA reference and these 50%
scenarios.
CO2emissions by 2050 in the global sce- narios range from 10 to 100 Gt (per year).
(In 2004, CO2 emissions were about 26 Gt from fossil fuels.) The low and reference sce- narios show emissions in the range of 60 to
100 Gt, whereas the medium scenarios show 20–30 Gt, and the high scenarios (19, 25) show 10 to 12 Gt. For the IEA ETP (22), emissions are 58 Gt for the reference scenario, 26 Gt for ACT Map, and 21 Gt for TECH Plus. IPCC (73) scenarios show a wide range of emissions, from 30 to 100 Gt, corresponding to total en- ergy consumption from 640 to 1600 EJ, and a range of renewable energy shares from 9%
to 35%. In the EC’s WETO (20) carbon con- straint scenario, emissions stabilize between 2015 and 2030 and then decrease, but by 2050, emissions are still 25% above the 1990 levels.
EUROPE TARGETS AND SCENARIOS
Renewable energy in Europe is closely con- nected to issues of climate change, secu- rity of supply, import dependency, market competitiveness, sustainability, and future en- ergy development. Directives of the European Commission have established aggressive pol- icy targets for shares of primary energy (12%), electricity (21%), and transport fuels (5.75%) from renewables by 2010, as well as a solar hot water target (100 million m2of collector area).
All European Union (EU) countries also have individual targets for share of electricity, rang- ing from 3.6% to 78%, which together should achieve the 21% EU target. The increases in electricity shares from 1997 are typically 5%
to 10% for most EU countries. Several coun- tries also have targets for share of primary en- ergy by 2010, including the Czech Republic (5% to 6%), France (7%), Germany (4%), Latvia (6%), Lithuania (12%), Poland (7.5%), and Spain (12.1%). During 2005–2006, the European Commission prepared a “green pa- per,” road map, and “biomass action plan” on strategies to achieve these targets and go be- yond them, proposing targets of 20% primary energy and 10% of transport energy by 2020 (3, 4, 90–95).
During 2005–2006, there were a large number of new energy scenarios published for Europe, primarily for 2030, including Annu. Rev. Environ. Resourc. 2007.32:205-239. Downloaded from arjournals.annualreviews.org by UB Wuppertal on 07/16/08. For personal use only.
IPCC — highest
Berndes et al. — highest (biomass only)
Shell — dynamics as usual IIASA/WEC — highest
Shell — spirit of the coming age
Johansson et al.
IEA ETP — TECH+
IPCC — median
EC WETO — carbon constrained
EC WETO — reference
2004 actual per IEA method EREC — advanced policies (2040)
Greenpeace — revolution
IEA ETP — ACT Map
Berndes et al. — lowest (biomass only) IIASA/WEC — lowest
IPCC — lowest
0 50 100 150 200 250 300 350 400 450
Figure 1
World primary energy from renewables in 2050 (EJ) as shown by various scenarios by Berndes et al. (112), European Comission (EC) (20), European Renewable Energy Council (EREC) (29), Greenpeace & European Renewable Energy Council (19), International Energy Agency (IEA) (22), IIASA/WEC (33), IPCC (73), Johansson et al. (36), Royal Dutch/Shell (32). Actual for 2004 from References 1–4.
scenarios by the Directorate-General for En- ergy and Transport (DG-Tren) (38, 39), Directorate-General for Environment (DG- Env) (37), the European Parliament Com- mittee on Industry, Research and Energy
WBCSD
EREC — advanced policies (2040)
Johansson et al.
EC WETO — carbon constrained
EC WETO — reference IEA ETP — TECH+
IEA ETP — ACT Map
IEA ETP — reference
2004 actual
Greenpeace — revolution
Greenpeace — reference
5,000
0 10,000 15,000 20,000 25,000 30,000 35,000 40,000
Figure 2
World electricity from renewables in 2050 (TWh) as shown by various scenarios by European Commission (EC) (20), European Renewable Energy Council (EREC) (29), Greenpeace &
European Renewable Energy Council (19), International Energy Agency (IEA) (22), Johansson et al. (36), World Business Council for Sustainable Development (WBCSD) (25). Actual for 2004 from References 1–4.
(ITRE) (40), the Greens/EFA group of the European Parliament (43), the European En- vironment Agency (44), Greenpeace (45), WWF/Wuppertal (47), and Ragwitz et al.
(46) of the Fraunhofer Institute. These add Annu. Rev. Environ. Resourc. 2007.32:205-239. Downloaded from arjournals.annualreviews.org by UB Wuppertal on 07/16/08. For personal use only.
to many other Europe-wide and individual country scenarios (83, 84, 96–100).
European reference scenarios expect that current trends in energy and economy will remain nearly the same, including existing barriers and grid restrictions. Climate poli- cies, energy efficiency improvements, and technology developments are included, but policy targets may not be met, and post-Kyoto measures have not been taken. Primary en- ergy supply grows very little, to around 80 EJ by 2030, compared to 73 EJ in 2005, owing to improvements in energy intensity, even as the GDP continues to increase. The share of renewables grows from around 7% in 2005 to 11% to 13% by 2030 according to most sce- narios (38–40, 43, 46, 47). Electricity share increases modestly from 14% in 2005 to 18%
to 29% in 2030.
Policy-intensive alternative scenarios are featured in most studies. These generally fall into categories of (a) high efficiency, (b) high renewable energy, and (c) combined energy efficiency and renewable energy, depending partly on the mix of policies that primarily promote efficiency, renewables, or both. DG- Tren (38, 39) studies consider all three sepa- rately, whereas the ITRE study (40) consid- ers two of the three, and most studies only focus on the combined scenario. The high- efficiency scenarios show less energy demand but also smaller shares of renewables, but the opposite is true for the high renewables scenarios. Combined scenarios have lower demand and higher renewables. Stable con- ditions for investments and technology de- velopment and gains in energy intensity re- sult from full implementation of relevant EU directives and policies, along with active na- tional policies, including targets, research and development, market incentives, training, car- bon pricing, and international climate policy.
These scenarios can be considered high alter- natives for renewables with ambitious strate- gies and policies.
Under the alternative scenarios, renew- ables reach a primary energy share of 20%
to 24% by 2020 in the FORRES (46), WWF
(47), DG-Env 20% (37), and EREC (48) scenarios. By 2030, renewables reach 17%
to 21% under the medium European Envi- ronment Agency (EEA) (44) and IEA (21) scenarios, and 26% to 39% under the high DG-Tren (38, 39), Vision (43), and ITRE (40) scenarios. By 2050, renewables reach 50% un- der the Greenpeace (45) scenario. Primary en- ergy demand decreases by 13% to 18% by 2030 in most scenarios and by 36% by 2050 under the Greenpeace scenario.
Electricity share in alternative scenarios increases from 14% in 2005 to 30% to 60%
by 2030 in the alternative scenarios. By 2050, renewables’ electricity share increases to 45%
under the WBCSD (25) scenario (mostly wind and solar power) and to 70% under the Green- peace & EREC (19) scenario. [Despite the high share, the Greenpeace scenario does not have significantly more total power gen- eration from renewables than some of the other scenarios because total electricity de- mand is lower in the Greenpeace scenario (see Figure 2).]
Studies differ greatly in projected shares of biofuels. There are accounting problems that make some cross-scenario comparisons incompatible, as some studies use share of to- tal transport-sector energy and some use share of road transport fuels. ITRE (40) and Vision (43) reference scenarios give biofuels 6% to 7% of the total transport-sector energy de- mand by 2030 and 14% to 26% in the alter- native scenarios. The WBCSD (25) puts bio- fuels share at 21% in 2050.
For low-temperature heat production, the current share of renewables in Europe is 6% to 7%, and∼90% of that is from biomass (92).
Scenarios do not provide many specific fig- ures for low-temperature heat, but some put the share at 14% to 20% by 2030. Scenar- ios show that renewables in the heating sector (particularly biomass and solar) are important in achieving high shares of primary energy under alternative scenarios. The European Solar Thermal Technology Platform (41) en- visions that 50% of Europe’s low-temperature heating, hot water, and cooling needs could be Annu. Rev. Environ. Resourc. 2007.32:205-239. Downloaded from arjournals.annualreviews.org by UB Wuppertal on 07/16/08. For personal use only.
met by renewables by 2030. One goal of the Platform is a new building standard by 2030 that would require 100% solar heating for new buildings and 50% solar heating retrofits for existing buildings.
The EC’s WETO (20) hydrogen carbon- constrained scenario for Europe is different than most other alternative scenarios. A delib- erately optimistic series of technology break- throughs increase the cost-effectiveness of hy- drogen technologies and lead to significant hydrogen use in transport. Nuclear energy is used to produce hydrogen starting after 2030 and provides one third of total energy de- mand by 2050. Renewables produce almost half of the hydrogen by 2050, although renew- ables’ primary energy share by 2050 remains a modest 20%.
Radically different European scenarios also exist in the literature: some focus on the complete phaseout of nuclear power or, conversely, high levels of nuclear; some fo- cus on CO2 stabilization (e.g., at 450 ppm) or on limits to per capita CO2emission (e.g., 3 tons CO2/person in 2050); some have dra- matically higher energy prices; and some have high carbon-market prices. Renewables gen- erally increase with decreasing nuclear under carbon-constrained scenarios and also with higher energy and carbon prices (37, 40, 44, 45).
CO2emissions in Europe are 3.8 to 4.5 Gt by 2030 in reference scenarios and 2.1 to 2.6 Gt in alternative scenarios. (In 2005, EU- 25 emissions were 3.8 Gt from fossil fuels.) For 2050, Greenpeace & EREC (19) give 5.3 Gt in the reference and 1.2 Gt in the revo- lution scenario, whereas the WWF (47) gives 4 Gt in the reference and 2.5 Gt in its policies scenario.
COUNTRY-SPECIFIC TARGETS AND SCENARIOS
In addition to the many global and European scenarios, there are a growing number of country-specific scenarios. A sample of these sceanarios is reviewed in this section, starting
with country-specific policy targets that can often serve as stepping stones to longer-term scenarios.
Country Policy Targets
By 2006, more than 50 countries and 32 states/provinces around the world had some type of policy target for future shares or amounts of renewable energy (3, 4). Most tar- gets are for 2010 or 2020. Targets exist at national, state/provincial, and municipal lev- els. Most targets are for shares of primary energy, electricity, and transport fuels (some of these are shown in Tables 2–4). Many individual countries are also enacting road maps or strategies in conjunction with tar- gets, such as New Zealand and South Africa (101, 102).
Some countries have opted to target spe- cific amounts of added renewable power ca- pacity by a future year (there is usually no accompanying figure for implied share of re- newables). Prime examples in this category are Brazil (3.3 GW to be added by 2006), the Dominican Republic (0.5 GW added by 2015), India (10% of new capacity additions through 2012), and the Philippines (4.7 GW added by 2013). Other countries have pol- icy targets for specific amounts of final en- ergy (electricity and/or heat) from renew- ables. Examples are Australia (9.5 TWh/year by 2010), New Zealand (8.3 TWh/year by 2012), Norway (7 TWh/year by 2010), South Africa (10 TWh/year by 2013), and Switzerland (3.5 TWh/year by 2010).
Like Europe, China has a comprehensive set of targets. The overall target is 16% of primary energy from renewables by 2020 (up from 7.5% in 2005). There are also targets for individual technologies by 2020, includ- ing hydro (300 GW), wind and biomass power (30 GW each), solar PV (1.8 GW), solar hot water (300 million m2), biofuels (15 mil- lion liters/year), biogas and biomass gasifica- tion (44 million m3/year), and biomass pellets (50 million tons/year) (3, 4). All technology targets reflect threefold to 20-fold increases Annu. Rev. Environ. Resourc. 2007.32:205-239. Downloaded from arjournals.annualreviews.org by UB Wuppertal on 07/16/08. For personal use only.