ACPD
7, 8933–8950, 2007Is there a stratospheric
fountain?
J.-P. Pommereau and G. Held
Title Page
Abstract Introduction
Conclusions References
Tables Figures
◭ ◮
◭ ◮
Back Close
Full Screen / Esc
Printer-friendly Version
Interactive Discussion Atmos. Chem. Phys. Discuss., 7, 8933–8950, 2007
www.atmos-chem-phys-discuss.net/7/8933/2007/ © Author(s) 2007. This work is licensed
under a Creative Commons License.
Atmospheric Chemistry and Physics Discussions
Is there a stratospheric fountain?
J.-P. Pommereau1and G. Held2
1
Service d’A ´eronomie, CNRS, Verri `eres le Buisson, France 2
Instituto de Pesquisas Meteorol ´ogicas, UNESP, Bauru, Brazil
Received: 1 June 2007 – Accepted: 12 June 2007 – Published: 25 June 2007
Correspondence to: J.-P. Pommereau ([email protected])
ACPD
7, 8933–8950, 2007Is there a stratospheric
fountain?
J.-P. Pommereau and G. Held
Title Page
Abstract Introduction
Conclusions References
Tables Figures
◭ ◮
◭ ◮
Back Close
Full Screen / Esc
Printer-friendly Version
Interactive Discussion
Abstract
The impact of convection on the thermal structure of the Tropical Tropopause Layer (TTL) was investigated from a series of four daily radiosonde ascents and weather S-band radar observations carried out during the HIBISCUS campaign in the South Atlantic Convergence Zone in Southeast Brazil in February 2004. The temperature
5
profiles display a large impact of convective activity on the thermal structure of the TTL. Compared to non-active periods, convection is observed to result in a cooling of 4.5◦C to 7.5◦C at the Lapse Rate Tropopause at 16 km, propagating up to 19 km or 440 K potential temperature levels in the stratosphere in most intense convective cases. Consistent with the diurnal cycle of echo top heights seen by a S-band weather radar, a
10
systematic temperature diurnal cycle is observed in the layer, displaying a rapid cooling of 3.5◦
C on average (–9◦
, –2◦
C extremes) during the development phase of convection in the early afternoon during the most active period. Since the cooling occurs during daytime within a timescale of 6-h, its maximum amplitude is at the altitude of the Cold Point Tropopause at 390 K and temperature fluctuations associated to gravity waves
15
do not display significant diurnal change, the afternoon cooling of the TTL cannot be attributed to radiation, advection, gravity waves or adiabatic lofting. It implies a fast insertion of adiabatically cooled air parcels by overshooting turrets followed by mixing with the warmer environment. During most intense convective days, the overshoot is shown to penetrate the stratosphere up to 450 K potential temperature level. Such
20
fast updraft offers an explanation for the presence of ice crystals, and enhanced water vapour layers observed up to 18–19 km (410–430 K) in the same area by the HIBIS-CUS balloons and the TROCCINOX Geophysica aircraft, as well as high tropospheric chemical species concentrations in the TTL over land observed from space.
Overall, injection of cold air by irreversible mixing of convective overshoots as
pro-25
posed by Danielsen (1982) do not appear as episodic isolated features, but common and systematic events over a land convective area, that is a Stratospheric Fountain. Though the two-stages process proposed by Sherwood (2000) may also be operative,
ACPD
7, 8933–8950, 2007Is there a stratospheric
fountain?
J.-P. Pommereau and G. Held
Title Page
Abstract Introduction
Conclusions References
Tables Figures
◭ ◮
◭ ◮
Back Close
Full Screen / Esc
Printer-friendly Version
Interactive Discussion it offers a mechanism for producing the chemical, moisture and thermal properties
ob-served in the stratosphere. The consistency between convective cooling of the TTL and weather radar echoes heights observed during the summer over South-East Brazil and the TRMM radar OPFs and LIS lightning events maximum frequencies, the latter showing also maximum events over Africa, South-East Asia, the Indonesian Islands
5
and Northern Australia depending on the season (Liu and Zipser, 2005), suggests the existence of several “Stratospheric Fountains” over continents instead of the oceanic area of Micronesia as proposed by Newell and Gould-Stewart (1982), which appears a region of little overshoot.
1 Introduction
10
The tropical tropopause is the source region of all trace gas species controlling strato-spheric ozone chemistry and climate, further transported at global scale by the Brewer-Dobson circulation. It is also the region of dehydration process resulting in the dry-ing of air enterdry-ing the stratosphere. However, the potential impact of chemically ac-tive short-lived species, or aerosols of different nature, and the dehydration process,
15
are highly dependent on the timescale at which troposphere-to-stratosphere transport (TST) takes place, which is still not clearly established.
Based on the recognition of the temperature of the tropopause colder than anywhere else, the hypothesis was made by Newell and Gould-Stewart (1981) of the existence of preferential area of TST, the “Stratospheric Fountain” over Micronesia, also called
20
the maritime continent. However, the hypothesis was never demonstrated. Although unambiguous cases of convective stratosphere penetration have been occasionally reported, they were never seen over oceanic areas but continental regions, e.g. by Danielsen (1982, 1993) over Australia. However, several studies (e.g. Highwood and Hoskins, 1998; Folkins et al., 1999) suggest that such overshooting in the TTL is not
25
common and thus probably unimportant at global scale. An alternative mechanism was thus proposed (Holton and Gettleman 2001) of a two steps process of fast convective
ACPD
7, 8933–8950, 2007Is there a stratospheric
fountain?
J.-P. Pommereau and G. Held
Title Page
Abstract Introduction
Conclusions References
Tables Figures
◭ ◮
◭ ◮
Back Close
Full Screen / Esc
Printer-friendly Version
Interactive Discussion lofting up to the base of the TTL, around 14 km, followed by a large scale slow diabatic
ascent following the radiative heating of air parcels (Gettelman et al., 2002; Corti et al., 2005), possibly enhanced by additional radiative heating from cirrus clouds (Hart-mann et al., 2001; Corti et al., 2006). The suggestion was then made by Sherwood (2000) of a “mixing layer” of convective overshooting deep into the TTL instead of at the
5
bottom only, followed by irreversible mixing, detrainment, and subsequent slow ascent in the lower stratosphere. This suggestion was recently supported by cloud resolving model (CRM) simulations showing that convection also influences the heat balance in the TTL and therefore may not be ignored Kuang and Bretherton (2004). Moreover, from inspection of wind data above the maritime continent, it has been shown by
Sher-10
wood (2000) that the time-averaged mass flux near the tropopause over the maritime continent would be in fact downward, prompting the concept of “Stratospheric Drain” instead. The difficulty with this concept is that it would require an unidentified energy sink which the author proposed to be irreversible injection of cold heavy air at great heights by overshooting clouds somewhere else.
15
However, likely because of the lower outgoing long-wave radiation (OLR) indicating higher cloud-tops over the maritime continent and the difficulty of making measure-ments inside or above intense land convective systems, most of observations were carried out over oceanic areas where the picture could be quite different from land convective regions. Indeed, as shown by Alcala and Dessler (2002) from
compar-20
isons between thermal imagery and radar measurements from the orbit aboard Trop-ical Rainfall Measurement Mission (RMM), OLR is not a good indicator of cloud-top altitude and thus of overshooting across the tropopause. In contrast to what it is gener-ally accepted, the radar indicates higher and more frequent “overshooting precipitation features” (OPF) above land areas of Africa, South America and large islands of
In-25
donesia (Liu and Zipser, 2005). The radar observations are very consistent with the maximum frequency of lightning flashes seen by the Lightning Imaging Sensor (LIS) also aboard TRMM, indicative of fast updraft velocity in the upper troposphere. Further-more, land convection displays a marked diurnal cycle with a maximum development
ACPD
7, 8933–8950, 2007Is there a stratospheric
fountain?
J.-P. Pommereau and G. Held
Title Page
Abstract Introduction
Conclusions References
Tables Figures
◭ ◮
◭ ◮
Back Close
Full Screen / Esc
Printer-friendly Version
Interactive Discussion around 16:00 LT, in contrast to the small diurnal change over oceans (Yang and Slingo,
2001; Nowicki and Merchant 2004, Liu and Zipser, 2005). The still pending question is thus to know the altitude reached by the detrainment and irreversible mixing of tropo-spheric air in the TTL or the lower stratosphere above intense convection developing in the afternoon over land.
5
Here we investigate the impact of land convection on the thermal structure and com-position of the TTL from a series of radiosonde ascents and S-band weather radar observations in one of the most intense convective region, the South Atlantic Conver-gence Zone (SACZ) in Southeast Brazil during the summer of 2004. The experiment is part of a HIBISCUS European project carried in cooperation with the Brazilian
Me-10
teorological Research Institute (IPMet) of the S ˜ao Paulo State University (UNESP) (Pommereau et al., 2007).
2 Thermal change associated to convection
The observational data are those of 105 Vaisala RS80 radiosonde (RS) ascents car-ried out between 24 January and 11 March from Bauru at 22◦S, 49◦W in Brazil. On
15
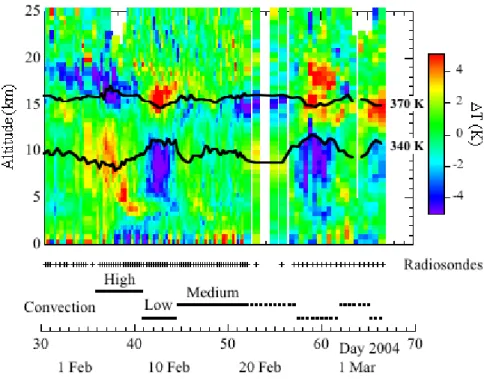
19 days between 31 January and 20 February the RS were released at a frequency of four times a day at 00:00, 06:00, 12:00, 18:00 UT that is 21:00, 03:00, 09:00, 15:00 local time (LT). Figure 1 displays the temperature deviation in reference to a campaign mean profile. Alternative periods of tropospheric warming and cooling of up to±5◦C amplitude can be observed associated to the slow forth and back motion of the South
20
Atlantic Convergence Zone (SACZ) over the station. Black lines are showing the vari-ation of altitude of the 340 K and 370 K potential temperature levels, whose difference varying from 4 km to 8 km is an indicator of convection intensity. Most active systems were present from 3–9 February followed by a period of lesser convection from 10–13 February, when the SACZ moved a few hundred kilometres to the N-E. It was followed
25
by a relatively long period between 14–26 February of medium convection when the SACZ gradually moved back over the State of S ˜ao Paulo, but the most active region
ACPD
7, 8933–8950, 2007Is there a stratospheric
fountain?
J.-P. Pommereau and G. Held
Title Page
Abstract Introduction
Conclusions References
Tables Figures
◭ ◮
◭ ◮
Back Close
Full Screen / Esc
Printer-friendly Version
Interactive Discussion remained about 200–300 km west of Bauru. Then followed a new period of calm
be-tween 28 February and 3 March and convection again on 5–8 March. However, the radiosonde sampling was not homogenous during the whole campaign. The series of four daily ascents covers 5 days during the most active period from 5–9 Feb (later ref-erenced as High Convection), 4 days of calm from 10–13 Feb (called Low Convection)
5
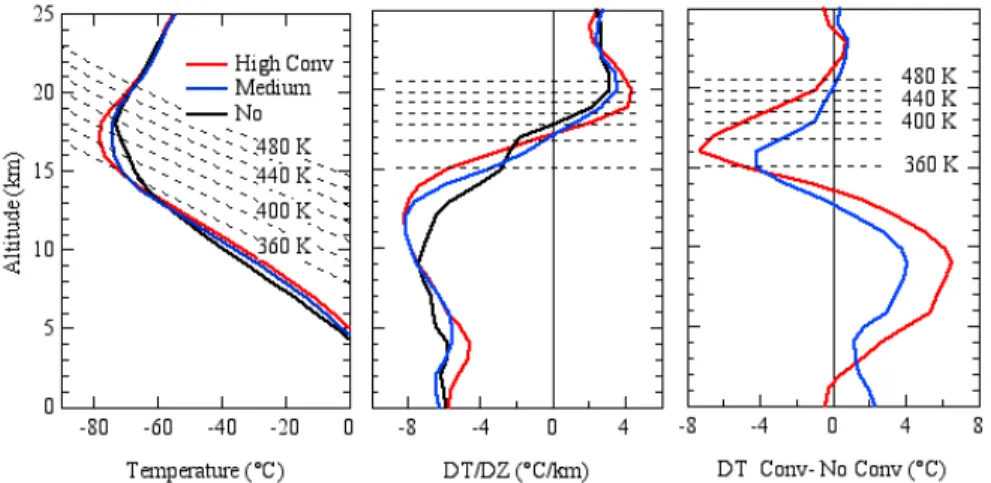
followed by 8 days from 14–21 Feb of intermediate activity (called later Medium Con-vection). Figure 2 displays the mean temperature profiles and the lapse rate during the three periods, and the difference between high, medium convection and low convective profiles. All profiles exhibit a lapse rate tropopause (LRT, dT/dZ ≤±2◦C/km following WMO definition) around 16 km (370 K) surmounted by a cold point tropopause (CPT)
10
1.5–2 km higher. Remarkably, the CPT is the highest (18 km, –73.5◦C, 415 K) in the absence of convection, supporting the idea suggested by Thuburn and Craig (2002) and Gettelman et al. (2002), that the CPT could be a stratospheric feature of radiative origin, which can exist independently of convection. However, convection has indeed a strong impact on the CPT temperature and altitude. But as already noted by Seidel
15
et al. (2001) and Sherwood et al. (2003), if increased convection results in a cooling by up to 7◦C, it lowers the CPT and not the opposite. The temperature difference between convective and low-convective periods in the right panel of Fig. 2 exhibits a warming of the troposphere by 4–6◦C between 5 km and 13 km, followed by a cooling above the equilibrium level at 13–13.5 km, reaching a maximum of 4.5–7.5◦C at the altitude
20
of the LRT around 370 K. The cooling extends to 400 K in medium convective activity, and 460 K in the most intense cases. If adiabatic lofting only was involved, this would correspond to a maximum vertical displacement of 600 m (350 m) at the LRT in high (medium) convection, reducing to 500 m (100 m) at 18 km and 200 m (0 m) at 20 km).
The amplitude of the cooling of the TTL associated with land convection over the
25
SACZ in the summer is significantly larger and extends to altitude levels higher than the 2–3◦C at 100 hPa reported by Kim and Dessler (2004) from temperature profiles measured by the Atmospheric Infrared Sounder (AIRS) onboard the AQUA satellite, but over oceans only because of retrieval limitations. However, it is of the same
ACPD
7, 8933–8950, 2007Is there a stratospheric
fountain?
J.-P. Pommereau and G. Held
Title Page
Abstract Introduction
Conclusions References
Tables Figures
◭ ◮
◭ ◮
Back Close
Full Screen / Esc
Printer-friendly Version
Interactive Discussion tude of the 6–10◦C cooling around 18 km reported by Johnson and Kriete (1982) over
convective events in the South China sea offshore Borneo Island during the monsoon season, or the 10◦C reported by Danielsen (1993) over a continental-maritime systems over Australia during the ER-2 STEP campaign in 1987.
Overall, the thermal impact of convection on the TTL appears more intense over land
5
than oceans. However, a number of processes could potentially contribute. These may include adiabatic lofting, cloud-top radiative cooling, Kelvin waves forced by transient deep convection (Randel and Wu, 2005), quasi-horizontal eddies, and convective over-shooting followed by turbulent mixing (Danielsen 1993). They are difficult to separate based on a simple comparison between sequences of profiles during a succession of
10
high and low convective periods. Since the major difference between land and oceanic convection is the large diurnal variation of the first compared to the second, better in-sight on the relative contributions of the above processes may be gained by looking at the diurnal cycle of temperature.
3 Diurnal temperature change in the TTL and echo top height associated to
15
convection
The study makes use of the series of the four daily ascents at 00:00, 06:00, 12:00 and 18:00 UT available between 5 and 21 February. Since it takes about one hour for the balloon to reach the tropopause, the measurements in the TTL were performed approximately at 22:00, 04:00, 10:00 and 16:00 LT. Figure 3 shows the diurnal change
20
of temperature compared to the morning ascent at 10:00 LT during the periods of high (5 days from 5–9 February), medium (8 days from 14–21 February) and low convection (4 days from 10–13 February).
Systematic and significant diurnal changes could be seen during the three periods:
– the daytime warming and nighttime cooling of the surface layer of increasing
am-25
plitude at decreasing convection and thus cloudiness;
ACPD
7, 8933–8950, 2007Is there a stratospheric
fountain?
J.-P. Pommereau and G. Held
Title Page
Abstract Introduction
Conclusions References
Tables Figures
◭ ◮
◭ ◮
Back Close
Full Screen / Esc
Printer-friendly Version
Interactive Discussion
– the warming of the troposphere by 1◦C in the afternoon and the evening between 5 and 12 km amplifying with convection intensity;
– the cooling of the TTL between 16 and 19 km in the afternoon also amplifying with convective activity (–1.6◦
C medium, –3.4◦
C high);
– the slight warming of 1–2◦C of the lower stratosphere in the afternoon and the
5
evening.
As indicated by the absence of difference between daytime (10:00 and 16:00 LT) and nighttime (22:00 and 04:00 LT) temperature between 3 and 17 km during the cloud-free period, there is no significant bias related to the solar heating of the sensor corrected using the radiosondes manufacturer’s procedure. The only experimental limitation is
10
the absence of temperature readings above 21–22 km during the highly convective period because of the lower altitude of the burst of the balloon after crossing thick cumulonimbus clouds.
The observed diurnal temperature changes associated to convection are in the same direction of the difference between convective and low-convective periods, but displays
15
also significant differences. At all levels, the largest change occurs during the develop-ment phase of convection in the afternoon. On top of the large daytime heating of the surface, the troposphere warms, but by 1◦C only and to higher altitude very near the LRT. However, the diurnal cycle contributes to only one fifth of the heating observed between convective and low-convective days, suggesting that most of the difference is
20
due to advection of warm and wet air at synoptic scale. Since the daytime warming of the troposphere is due to the heat released by water vapour condensation exceeding the cooling of ascending air parcels, the higher altitude of the top heated layer sug-gests the presence of high humidity at higher altitude (15 km in high convection, 13 km in medium).
25
The average amplitude of the afternoon cooling of the TTL represents half of the mean cooling associated to convection compared to the low-convective period. During the five most active days it varies from –2◦C to –9◦C. But it starts at the LRT only,
ACPD
7, 8933–8950, 2007Is there a stratospheric
fountain?
J.-P. Pommereau and G. Held
Title Page
Abstract Introduction
Conclusions References
Tables Figures
◭ ◮
◭ ◮
Back Close
Full Screen / Esc
Printer-friendly Version
Interactive Discussion reaching a maximum at 17 km at the altitude of the CPT instead of the LRT. It has no
impact on the altitude of the CPT, which remains constant between 10:00 and 16:00 LT, which would be the case if adiabatic lofting were involved. Later in the evening, the amplitude and altitude of the cooling first drop between 16:00 and 22:00 LT and then stabilize during the night when convection collapses. However, the warming of 2◦C
5
above 17 km is far smaller than the 15◦C which could be expected from an adiabatic descent of 1.5 km, implying mixing instead. Since the daytime radiative effect at these levels is heating due to solar light absorption by ozone, e.g. Gettelman et al. (2004), or eventually cloud-top (Sherwood et al., 2003), the potential effect of radiation during daytime could be only the masking of part of the cooling. In the opposite direction, the
10
potential of radiative processes in the TTL during nighttime would be cooling and not warming. Since winds between 16 and 20 km remained very light (<5 m/s from E-SE) during the whole campaign, neither large scale eddies or waves could be responsible for systematic changes within 6-h. The possible contribution of gravity waves was investigated by looking at the deviation of temperature compared to smoothed profiles.
15
The average RMS amplitude of temperature fluctuations of vertical wavelength shorter than 2 km was found to increase from 0.3◦C in the troposphere to 0.7◦C above the LRT, but not showing any diurnal change. The contribution of gravity waves to the afternoon cooling is thus insignificant. Finally, since the absence of change in the CPT altitude during the cooling phase and the evening partial heating are incompatible
20
with an adiabatic process, the only remaining explanation of the cooling event in the TTL is the insertion of cold air by overshooting turrets followed by mixing with warmer stratospheric air, as suggested by Danielsen (1982, 1993).
Note that a diurnal signal also appears at higher altitude in the stratosphere during medium and low-convective days, exhibiting a daytime heating by 1–2◦C at 22–25 km,
25
shifting downwards to 20–22 km in the late afternoon and the evening, followed by a nighttime cooling. Unfortunately, there is no data available at those altitudes above high convection. Within the dispersion of the measurements, the picture is consistent with a diurnal cycle of the order of 1◦C amplitude as expected from the daytime heating by
ACPD
7, 8933–8950, 2007Is there a stratospheric
fountain?
J.-P. Pommereau and G. Held
Title Page
Abstract Introduction
Conclusions References
Tables Figures
◭ ◮
◭ ◮
Back Close
Full Screen / Esc
Printer-friendly Version
Interactive Discussion solar light absorption in the shortwave, followed by the nighttime cooling by long-wave
emission (e.g., Gettelman et al., 2004).
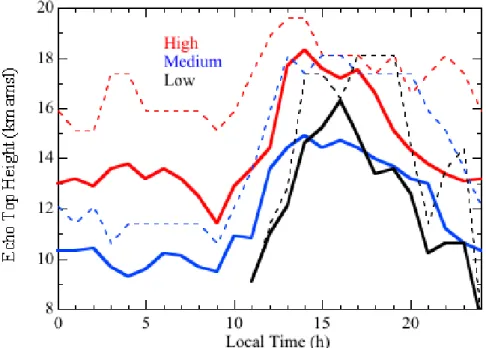
Finally, the timing and the altitude of the TTL cooling are very consistent with the diurnal change of echo top heights extracted from the TITAN statistics (Dixon and Weiner, 1993) of the Bauru radar observations within its 240 km range (TITAN settings:
5
10 dBz reflectivity threshold, storm volume≥50 km3, minimum lifetime of cell 15 min), displayed in Fig. 4. Every cell complying with these criteria yielded “one count” per vol-ume scan (every 7.5 min). After minimum activity at 09:00–10:00 LT convective clouds start developing at around 11:00 LT, reaching a maximum average altitude of 18.3 and 14.9 km, respectively on high and medium convective days around 14:00 LT, before
de-10
creasing slowly in the late afternoon and collapsing at night. But on most active days, the echo tops reach even higher altitudes of 19.6 and 18.1 km, respectively, during the early afternoon, very consistent with those of the top levels of the cooling reported by the radiosondes at 16:00 LT. Interestingly, and although no echoes are reported in the morning during low-convective days on 10–13 February, radar observations show
15
that convection also develops in the afternoon, suggesting a possible contribution of overshooting on the TTL temperature even on those days.
4 Summary and discussion
The above analysis provides an experimental evidence of the existence of a mixing layer and of the strong influence of convection on the thermal structure of the TTL
20
up to 450 K in the lower stratosphere, as suggested by Danielsen (1982, 1993) and Sherwood (2000). The strong overshooting is shown associated with the fast diurnal development phase of convection over land in the early afternoon. Although the injec-tion of cold air explains partly only the cooling of the TTL associated with convecinjec-tion to which, radiation, adiabatic lofting and Rossby and Kelvin waves may also contribute,
25
the afternoon overshoot and turbulent mixing is the only process that allows irreversible vertical transport in the stratosphere. As suggested by cloud resolving model (CRM)
ACPD
7, 8933–8950, 2007Is there a stratospheric
fountain?
J.-P. Pommereau and G. Held
Title Page
Abstract Introduction
Conclusions References
Tables Figures
◭ ◮
◭ ◮
Back Close
Full Screen / Esc
Printer-friendly Version
Interactive Discussion simulations (Chaboureau et al., 2007, Grovesnor et al., 2007) it could provide an
ex-planation for the presence of ice particles and hydrated layers in largely sub-saturated air 2 km above the tropopause at 18–19 km (410-430K) reported by the HIBISCUS balloons (Nielsen et al., 2007, Durry et al., 2007) and the TROCCINOX high altitude Geophysica aircraft (Chaboureau et al 2007) over the Bauru area. It could also provide
5
an explanation for the maximum concentration of tropospheric chemical substances in the TTL above continents as seen by the ODIN, MLS, HALOE and MOPITT, N2O, CH4 and CO measurements (Ricaud et al., 2007).
Little experimental information exists in the literature regarding the possible impact of convection on the thermal structure of the TTL, difficult to observe from space and
10
particularly from sun-synchronous missions. Although it is not surprising that a diurnal cycle was not observed with AIRS aboard AURA limited to oceanic areas (Kim and Dessler, 2004), it is unlikely that two profiles per day would be enough to see it, even over land. The only reference found to a diurnal signature of convection on the thermal structure of the TTL, is the observation from four daily radiosonde ascents during a
15
3-day convective period offthe coast of the large island of Borneo, indicating a cooling of 6–10◦C at 18 km in the afternoon around 14:00 LT during the first two days, lasting until 20:00 LT on the third day (Johnson and Kriete, 1982).
Overall, injection of cold air by irreversible mixing of convective overshoots as pro-posed by Danielsen (1982) do not appear as episodic isolated features, but common
20
and systematic events over a land convective area, defining a Stratospheric Fountain. Though the two-stages process proposed by Sherwood (2000) may also be operative, it offers a mechanism for producing the chemical, moisture and thermal properties ob-served in the stratosphere. However, the still open question is to know the relative contribution of the two processes and whether the Stratospheric Fountain is
opera-25
tive also in Africa and Indonesia. The even higher frequency of TRMM OPF and LIS lightning events over Africa, South-East Asia, the Indonesian Islands and Northern Australia depending on the season (Liu and Zipzer, 2005), suggest the presence of several “Stratospheric Fountains” over continents in contrast to the oceanic area of
ACPD
7, 8933–8950, 2007Is there a stratospheric
fountain?
J.-P. Pommereau and G. Held
Title Page
Abstract Introduction
Conclusions References
Tables Figures
◭ ◮
◭ ◮
Back Close
Full Screen / Esc
Printer-friendly Version
Interactive Discussion cronesia as proposed by Newell and Gould-Stewart (1982), which appears a region of
little overshoot.
Acknowledgements. We thank the personnel of the Meteorological Research Institute (IPMet) of the S ˜ao Paulo State University (UNESP) and the students of the Federal University of Rio de Janeiro for preparing the radiosondes and operating the radar. The National Center for
5
Atmospheric Research (NCAR) in Boulder, Co, USA, is gratefully acknowledged for the TITAN Software and its adaptation for IPMet’s radars as part of a collaborative project. This study was supported by the European Commission (HIBISCUS contract EVK2-2001-000111), CNRS in France, and FASESP (project TROCCIBRAS) in Brazil.
References
10
Alcala, C. M. and Dessler, A. E : Observations of deep convection in the tropics using the Trop-ical Rainfall Measuring Mission (TRMM) precipitation radar, J. Geophys. Res., 107, 4792, doi:10.1029/2002/D002457, 2002
Chaboureau, J.-P., Cammas, J.-P. Duron, J., Mascart, P. J. , Sitnikov, N. M., and Voessing, H.-J.: A numerical study of cross-tropopause transport by convective overshoots during the
15
Troccinox golden day, Atmos. Chem. Phys., 7, 1731–1740, 2007,
http://www.atmos-chem-phys.net/7/1731/2007/.
Corti, T., Luo, B. P., and Peter, T.: Mean radiative energy balance and vertical mass fluxes in the equatorial upper troposphere and lower stratosphere, Geophys. Res. Lett., 32, L06802, doi:10.1029/2004GL021889, 2005.
20
Corti, T., Luo, B. P. , Fu, Q., V ¨omel, H., and Peter, T.: The impact of cirrus clouds on tropical troposphere-to stratosphere transport, Atmos. Chem. Phys. Discuss, 6, 1725–1747, 2006. Danielsen, E. F.: A dehydration mechanism for the stratosphere, Geophys. Res. Lett., 9, 605–
608, 1982.
Danielsen, E. F.: In situ evidence of rapid, vertical, irreversible transport of lower tropospheric
25
air into the lower stratosphere by convective cloud turrets and by large scale up welling in tropical cyclones, J. Geophys. Res, 98, 8665–8681, 1993.
Dessler, A. E.: The effect of deep, tropical convection on the tropical tropopause layer, J. Geophys. Res., 107, 4033, doi:10.1029/2001JD000511, 2002.
ACPD
7, 8933–8950, 2007Is there a stratospheric
fountain?
J.-P. Pommereau and G. Held
Title Page
Abstract Introduction
Conclusions References
Tables Figures
◭ ◮
◭ ◮
Back Close
Full Screen / Esc
Printer-friendly Version
Interactive Discussion Dixon, M. and Weiner, G.: TITAN: Thuderstorm idenetification, tracking, analysis and
nowcast-ing – a radar-based methodology, J. Atmos. Ocean. Technol., 10, 785–797, 1993
Durry, G., Huret, N., and Hauchecorne, A.: Isentropic advection and convective lifting of wa-ter vapor in the UT - LS as observed over Brazil (22 ˚ S) in February 2004 by in situ high-resolution measurements of H2O, CH4, O3 and temperature, Atmos. Chem. Phys. Discuss,
5
6, 12 469–12 501, 2006.
Folkins, I., Loewenstein, M., Podolske, J., Oltmans, S. J., and Profitt, M.: A barrier to vertical mixing at 14 km in the tropics: Evidence from ozonesondes and aircraft measurements, J. Geophys. Res., 104, 22 095–22 102, 1999.
Folkins, I., Braun, C., Thompson, A. M., and Whitte, J.: Tropical ozone as an indicator of deep
10
convection, J. Geophys. Res., 107, 4184, doi:10.129/2001JD001178, 2002.
Gettelman, A., Salby M. L., and Sassi, F: The distribution and influence of convection in the tropical tropopause region, J. Geophys. Res., 107, 4080, doi:10.1029/2001JD001048, 2002 Gettelman, A., de F. Forster, P. M., Fujiwara, M., Fiu, Q., V ¨omel, H., Gohar, L. K., Johanson C.,
and Ammerman, M.: Radiation balance of the tropical layer, J. Geophys. Res. 109, D07103,
15
doi:10.1029/2003JD004190, 2004.
Grosvenor D. P., Choularton, T., Coe, H., and Held, G.: Cloud Resolving Model simulations of dehydration by deep convection of the TTL and lower stratosphere, Atmos. Chem. Phys. Discuss., 7, 7277–7346, 2007,
http://www.atmos-chem-phys-discuss.net/7/7277/2007/.
20
Hartmann, D. L., Holton, J. R., and Fu, Q.: The heat balance of the tropical tropopause, Q. J. R. Meteorol. Soc., 124, 1579–1604, 2001.
Highwood, E. J. and Hoskins, B. J.: The tropical tropopause, Q. J. R. Meteorol. Soc., 124, 1579–1604, 1998.
Holton, J. R. and Gettelman, A.: Horizontal transport and the dehydration of the stratosphere,
25
Geophys. Res. Lett., 14, 2799–2802, 2001.
Johnson, R. H. and Kriete, D. C.: Thermodynamic and circulation characteristics of winter monsoon tropical mesoscale convection, Month. Weather Rev., 10, 1898–1911, 1982. Kim, H. and Dessler, A. E.: Observations of convective cooling in the tropical tropopause layer
in AIRS data, Atmos. Chem. Phys. Discuss, 4, 7615–7629, 2004.
30
Kuang, Z. and Bretherton, C. S.: Convective influence on the heat balance of the tropical tropopause layer: a cloud-resolving model study, J. Atm. Science, 2919–2927, 2004. Liu, C. and Zipser, E. J.: Global distribution of convection penetrating the tropical tropopause,
ACPD
7, 8933–8950, 2007Is there a stratospheric
fountain?
J.-P. Pommereau and G. Held
Title Page
Abstract Introduction
Conclusions References
Tables Figures
◭ ◮
◭ ◮
Back Close
Full Screen / Esc
Printer-friendly Version
Interactive Discussion J. Geophys. Res., D23104, doi:10.1029/2005JD006063, 2005.
Newell, R. E. and Gould-Stewart, S.: A stratospheric fountain?, J. Atmos. Science, 38, 2789– 2796, 1981.
Nielsen, J. K., Larsen, N., Cairo, F., Di Donfrancesco, G., Rosen, J. M., Durry, G., Held, G., and Pommereau, J.-P.: Solid particles in the tropical lower stratosphere, Atmos. Chem. Phys., 7,
5
685–695, 2007,
http://www.atmos-chem-phys.net/7/685/2007/.
Nowicki, S. M. J. and Merchant, C. J.: Observations of the diurnal and spatial variability of radiative forcing by equatorial deep convective clouds, J. Geophys. Res., 109, D11202, doi:10,1029/2003D004176, 2004.
10
Pommereau, J.-P., Garnier, A., Held, G., et al.: An overview of the HIBISCUS campaign, Atmos. Chem. Phys. Discuss., 7, 2389–2475, 2007,
http://www.atmos-chem-phys-discuss.net/7/2389/2007/.
Randel, W. J. and Wu, F.: Kelvin wave variability near the equatorial tropopause ob-served in GPS radio occultation measurements, J. Geophys. Res., 110, D03102,
15
doi:10.1029/2004JD005006, 2005.
Ricaud, P., Barret, B., Atti ´e, J.-L., et al.: Impact of land convection on troposphere-stratosphere exchange in the tropics, Atmos. Chem. Phys. Discuss., 7, 3269–3300, 2007,
http://www.atmos-chem-phys-discuss.net/7/3269/2007/.
Sherwood, S. C.: A Stratospheric “Drain” over the Maritime continent, Geophys. Res. Lett., 27,
20
677–680, 2000.
Sherwood, S.C., and Dessler, A.E.: On the control of stratospheric humidity, Geophys. Res. Lett., 2513-2516, 2000
Sherwood, S. C., Horinouchi, T., and Zeleznik, H. A.: Convective impact on temperatures observed near the tropical tropopause, J. Atmos. Science, 60, 1847–1856, 2003.
25
Sherwood, S. C. and Dessler, A. E.: Convective mixing near the tropical tropopause: Insights from seasonal variations, J. Atmos. Sci., 60, 2674–2685, 2003.
Seidel, D. J., Ross, R. J., and Angell, J. K.: Climatological characteristics of the tropical tropopause as revealed by radiosondes, J. Geophys. Res., 106, 7857–7878, 2001.
Thuburn, J. and Craig, G. C.: On the temperature structure of the tropical sub stratosphere, J.
30
Geophys. Res., 107, 4017, doi:10.1029/2001JD000449, 2002.
Yang, G. Y. and Slingo, J.: The diurnal cycle in the tropics, Month. Weather. Rev., 129, 784–801, 2001.
ACPD
7, 8933–8950, 2007Is there a stratospheric
fountain?
J.-P. Pommereau and G. Held
Title Page
Abstract Introduction
Conclusions References
Tables Figures
◭ ◮
◭ ◮
Back Close
Full Screen / Esc
Printer-friendly Version
Interactive Discussion
Fig. 1. Temperature deviation compared to mean campaign profile and dates of radiosonde
ascents. The difference in altitude between the 370 K and 340 K levels is an indicator of con-vection intensity.
ACPD
7, 8933–8950, 2007Is there a stratospheric
fountain?
J.-P. Pommereau and G. Held
Title Page
Abstract Introduction
Conclusions References
Tables Figures
◭ ◮
◭ ◮
Back Close
Full Screen / Esc
Printer-friendly Version
Interactive Discussion
Fig. 2. Average temperature (left) and lapse rate (middle) during high, medium and
non-convective periods and difference between convective and non-convective profiles (right).
ACPD
7, 8933–8950, 2007Is there a stratospheric
fountain?
J.-P. Pommereau and G. Held
Title Page
Abstract Introduction
Conclusions References
Tables Figures
◭ ◮
◭ ◮
Back Close
Full Screen / Esc
Printer-friendly Version
Interactive Discussion
Fig. 3. Diurnal change of temperature compared to morning profile at 10:00 LT during high,
medium and low convection periods. Error bars on most relevant profiles show standard devi-ations. Note the increase RMS in the TTL during the high convective period suspected to be related to the distance between the radiosonde and the cloud turrets.
ACPD
7, 8933–8950, 2007Is there a stratospheric
fountain?
J.-P. Pommereau and G. Held
Title Page
Abstract Introduction
Conclusions References
Tables Figures
◭ ◮
◭ ◮
Back Close
Full Screen / Esc
Printer-friendly Version
Interactive Discussion
Fig. 4. Diurnal variation of mean (solid) and maximum (dotted) cloud-top height seen by
the radar within its 240 km range during the high (3719 counts/day average), medium (2293 counts/day) and low (873 counts/day) convective periods.