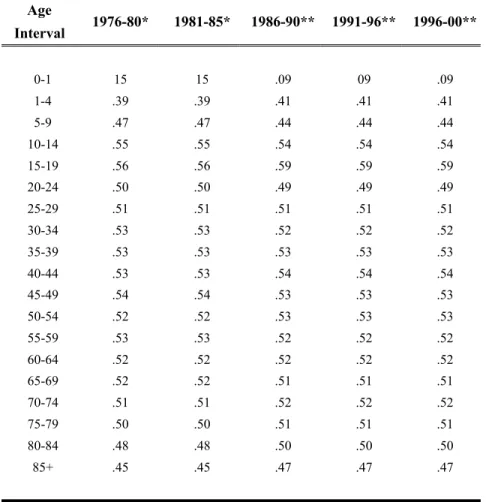
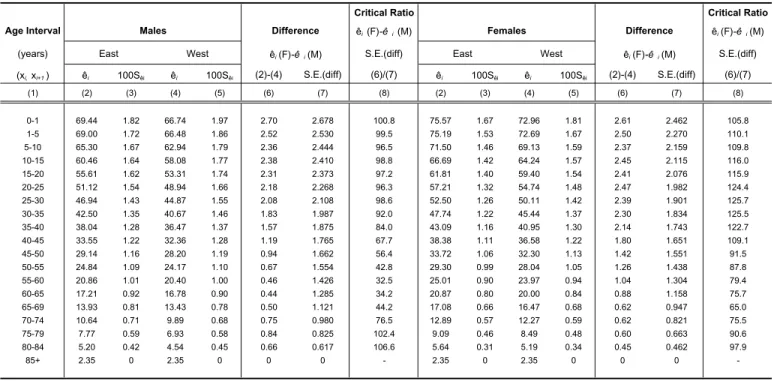
Abridged Life Tables for Registered Indians in Canada, 1976-1980 to 1996-2000
39
0
0
Texto
Imagem
Documentos relacionados
Evidências mostram que a gênese do Depósito de Cu-Au Chapada também está relacionada a processos hidrotermais epigenéticos, marcados pela transformação de magnetita-biotita
No item final, pretende-se verificar, sob a ótica do Príncipe Eletrônico (Octavio Ianni), como as mídias sociais tem subvertida a utilização da teledemocracia
The SIMDualKc model, that adopts the dual crop coefficient approach, was successfully calibrated and validated for simulating capillary rise from the groundwater table using
De forma bastante geral, a reestruturação a partir da década de 1980, levada a cabo pelos governos dos países centrais, pelas grandes corporações, pelos grandes bancos e
Innovation, thus, is not only articulated with the creation of economic value, with the change of policy into technocracy or the technological-political
A melhoria das condições económicas era outro dos factores de atração no processo migratório, a renumeração e as condições de trabalho eram bem superiores nas
De registar as peças de artilharia, tais como os canhões de ferro, as balas de mosquete, as bolsas de escumilha; os elementos do aparelho do navio como uma âncora de ferro;
Os extratos foram submetidos a sucessivas separações por (CC) cromatografia em coluna, Cromatografia em Camada Delgada Preparativa (CCDP) e Cromatografia em Camada Delgada
