accidents within the first five; 12 reported chronic liver disease and cirrhosis, and 10 reported diabetes mellitus. Diseases of the heart ranked first among the leading causes in 16 countries, and were respon-sible for as much as 30% of the deaths in Argentina (30.0); Barbados (29.7); Belize (31.2); Canada (31.0); Costa Rica (33.0); Cuba (29.6); Netherlands Antilles (29.5); Puerto Rico (29.8); Trinidad and Tobago (34.7); United States (34.9), and Venezuela (29.8).
The above pattern is very similar for the 65+ year age group in which all 33 countries with more than 100 deaths in that age group reported malignant neoplasms and diseases of the heart among the five leading causes; 32 reported cerebrovascular disease, 17 reported diabetes mellitus, and 12 reported chronic liver disease and cirrhosis. One notable difference between this and the previous age group is
that influenza and pneumonia, which was reported as a leading cause by only three countries in the 45-64 year age group, in the 65+ group was among the five first in 27 countries.
In spite of the limitations inherent in the data, it is clear that mortality in this Region is no longer dominated by infectious diseases alone. There now exists an epidemiological mosaic which also includes chronic degenerative diseases, violent death, and other consequences of the environment and certain life-styles. More detailed and comprehensive mor-tality analyses at local levels will provide valuable insights for epidemiologists, administrators, planners, and decision-makers.
(Source: Health Situation Analysis and Trend Assessment Program, PAHO.)
Analysis of Some Aspects of Mortality in Canada
Editorial Note
The two articles that follow, "Early' Mortality Due to Unintentional Injury' in Canada, 1985" and "Life Expectancy by Sex, Age and Income Level ' are presented here because the' illustrate some ways in which mortality data can be analyzed to achieve a picture which is more informative than the one obíained b y looking at.just the traditional rates and proportions. Thefirst article shows an application of the indicatorfor y'ears of life lost prematurely, which is being increasingly used to take into consideration the importance of age of death when analyzing the leading causes of mortality . The second article illustrates the use of another mortality indicator. life expectancy at birth, to relate the overall level of mortality¡ and the level of income as a means of approximating the
influence of social and economic conditions on health.
It is hoped that these two examples of epidemiologic analysis mayu stimulate similar endeavours in countries of the A mericas, with the aim that mortalit), data, which are the mosí readily available data in all countries of the Region, be more widely usedfor priority, and policy formulation and ihe creation of consensus required.for action and
resource allocation.
Early Mortality Due to Unintentional Injury in Canada, 1985
Introduction
Mortality occurring before age 65 is one of the leading problems facing our health care system. With the decline in importance of infectious diseases, unintentional injuries have become the leading cause of death for more than half the human lifespan, ages 1-44(1). Conventional mortality rates, which treat all deaths equally regardless of age, do not provide an adequate measure of this early
mortality. One measurement of the number of economically productive years of life lost is the potential years of life lost index. This report uses this index to examine unintentional injury-the leading cause of potentially preventable early mortality in Canada.
Material and Methods
A machine readable record of all deaths in
Canada in 1985, by 5 year age groups, was obtained from Statistics Canada. These data were used to compute directly age-stardardized death rates for All Causes; Unintentional Injuries (9th revision ICD codes E800-E949); Neoplasms (140-239); Cardio-vascular Diseases (390-448); Suicide and Homicide (E950-E969); Congenital Anomalies (740-759); and Respiratory Diseases (460-519). Potential years of life lost (PYLL) before retirement, i.e. age 65, were calculated for these causes of death as well as for the major components of unintentional injuries. PYLL were computed by multiplying the number of deaths in each age group by the difference between the midyear of the age group and 65. The PYLL by age group were then summed to obtain the total PYLL for each cause of death. The average PYLL per death was calculated by dividing the total cause specific PYLL by the number of deaths observed.
Results
Unintentional injuries, i.e. those resulting from motor vehicle traffic accidents, drowning, fire, poisonings, and falls, are the leading cause of PYLL before age 65 in Canada. In 1985 they resulted in 219,641 PYLL or 22.3% of all PYLL that year (Table 1). Neoplasms (19%) and cardiovascular diseases (14%) ranked second and third, respectively, in terms of PYLL before age 65.
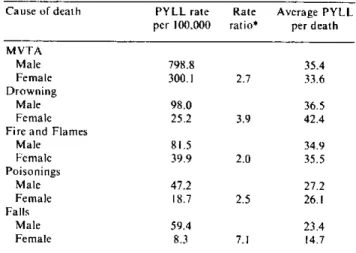
Motor vehicle traffic accidents (E810-E819) are by far the leading cause of death due to unintentional injuries. In 1985 they represented 57% of the total PYLL before age 65 and eight times more PYLL than the next leading cause of PYLL due to unintentional injuries (Table 2). Drowning (E910) and fire and flames (E890-E899) were the next two leading causes of PYLL from unintentional injuries in Canada in 1985, followed by poisonings
(E850-E869) and falls (E880-E888). Table 2 also presents the cause specific PYLL rate sex ratios for the 5 leading causes of PYLL from unintentional injuries. The male PYLL rate per 100,000 population was more than twice the female rate for each cause. The largest sex ratio in 1985 was 7. 1 for PYLL resulting from falls. The average PYLL per death (Table 2) reveals that in 1985 the average age at death due to drowning among women was 6 years less than the average age among men. For deaths due to falls, men died, on the average, 9 years younger than women. There was no significant difference in the average age at death between men and women for the other leading causes of death due to uninten-tional injuries.
Discussion
The age-standardized (all ages) mortality rate for cardiovascular diseases and neoplasms far exceeds that of unintentional injuries. However, the majority of deaths from the former two causes occur after age 60, in contrast to deaths from unintentional injuries which primarily involve much younger persons. This is reflected in the PYLL index. The average PYLL per death for unintentional injury was three times that of neoplasms or cardiovascular disease. Thus the allocation of health resources must consider not only the number of deaths by cause but also by age(2). The continuing large numbers of PYLL due to unintentional injuries, particularly motor vehicle traffic accidents, in Canada and elsewhere highlights the importance of effective preventive measures. When injuries are studied epidemiologically, many opportunities for preven-tion may become evident. What is known about host, agent, and environment can be translated into programmatically sound interventions that reduce
Table 1. Years of life lost before age 65 and age-standardized mortality rates, by cause of death, Canada, 1985.
Cause of death Years of Age-standardized Average (9th revision ICD) life lost mortality rates PYLL per
(per 100.000) death
All causes 985.640 590.2 18.4
Unintentional Injury(E800-E949) 219.641 34.6 32.5 Neoplasms (140-239) 185.744 155.3 11.1 Cardiovascular Diseases (390-438) 134.179 244.2 9.4 Suicide and Homicide (E950-E969) 96.068 13.5 28.8 Congenital Anomalies (740-759) 77.717 6.1 58.3
Respiratory Diseases (460-519) 26.854 46.1 14.3
8
.
Table 2. PYLL rates per 100,000 population, PYLL rate ratios, and average PYLL per death of the 5 leading causes
of unintentional injury in Canada, by sex, 1985.
Cause of death PYLL rate Rate Average PYLL per 100.000 ratio* per death
MVTA
Male 798.8 35.4
Female 300.1 2.7 33.6
Drowning
Male 98.0 36.5
Female 25.2 3.9 42.4
Fire and Flames
Male 81.5 34.9
Female 39.9 2.0 35.5
Poisonings
Male 47.2 27.2
Female 18.7 2.5 26.1
Falls
Male 59.4 23.4
Female 8.3 7.1 14.7
* Male Rate/ Female Rate
injury morbidity and mortality(3). Increased governmental and private support of the activities of the various groups involved in injury prevention should be emphasized.
References
(1) Committee on Trauma Research. Injuryi in America. National Academy Press, Washington, D.C., 1985.
(2) Stickle, G. What Priority Human Life? Am J Public Health 55:1692-8, 1965.
(3) Premature Mortality due to Unintentional Injuries -United States, 1983. MMWR 35:353-6.1986.
(Source: Leonard MacWilliam and Louise Fortier. First published in Chronic Diseases in Canada,
Vol. 8, No. 1, June 1987.)
Life Expectancy by Sex, Age, and Income Level
The purpose of this article is to present an updated overview of the variations in life expectancy by income level in Canada. Mortality data for 1984 were retrieved from the Canadian Mortality Data-base of the Vital Statistics Division of Statistics Canada. Income categories were determined using the quintile of the median household income of the census tracts of Canada's census metropolitan areas. The relative risks of death by age and sex for each income level, in reference to the highest income group, were those derived in the initial study by Wigle and Mao(1). Age-sex specific mortality rates for 1984 by income level were calculated by applying the 1984 mortality rate and the relative risk of death to the Bayesian formula(2) and then used to con-struct life tables following a method developed by Chiang(3).
Life expectancy is a hypothetical measure and indicator of current health and mortality condi-tions(4). The life expectancy according to income level can be used to study the association between income and the risk of death due to all causes. The study showed that life expectancy increased mono-tonically with income level. The difference in life expectancy by income level was greater for males than females at all ages. The difference for each sex was greatest at birth, relatively constant up to age 35
and declined rapidly after age 45. For females over
55 and males over 75, this difference was less than one year.
The relationship between income level and life expectancy must be carefully interpreted; an associ-ation should not be confused as a causal relassoci-ation. Income level is correlated with factors such as education, occupation and lifestyle which can independently contribute to the risk of disease. Chronic disease and disability may cause a decline in income level due to loss of employment or a decline in job status and pay; thus, a relatively low income at the time of death can be a result of disease as opposed to a cause(l). The correlation observed from the life table does not imply that income per se directly influences life expectancy. Income should be considered as a socioeconomic status indicator. The results indicate that the residents of high socioeconomic status areas live longer than those of the low socioeconomic status areas.
References
(1) Wigle, D.T., Mao, Y. Mortality' b.l Income Level in Urban Canada. Health and Welfare Canada 1980.
(2) Ash, R. B. Basic Probability Theory. John Wiley and Sons, Toronto 1970.