in
Produc t ion Engine e ring
2012, No 4 (8), pp 29‐36
Abstract:
In the ar cle there were presented chosen method associated with sta s cal control of produc on processes. Mainly focused on control cards and Pareto‐Lorenz analysis. Showed method were implemented to analysis produc on process stability of hearing aids in X company (the brand name don’t give because date of produc on is secret). Researches were made few months a er new assembly lines starts‐up. Main aim of researches was defects types iden fica on occurred in produc on process and determine the scale of effect. Finally received results were sa sfactory, i.e. despite of occur‐ red errors, control cards analysis showed that produc on process of BTE‐type (Behind‐The‐Ear) hearing aids was stable.
IMPLEMENTATION
OF
CONTROL
CARDS
AND
SUPPORTING
METHOD
IN
PRODUCTION
ENGINEERING
INTRODUCTION
In a situa on when customer’s requirements, technical and technological capabili es of manufacturers change, compe on of mee ng expecta ons of customer’s needs increases. Manufacturers design and develop newer, more interes ng and more efficient products and technologies. They outdistance each other. The situa on is more serious when we talk about medical produc on which improves the quality of pa ents’ life and even some mes allows their func oning in society. There is no place for making mis‐ takes and producing incorrect products. Process during which goods are manufactured subjects to total control. All of this is to eliminate internal errors which may be the cause of product’s defect.
These issues fully refer to produc on engineering which subject is not only designing products and processes but also controlling, exploita on, organiza on and manage‐ ment of produc on processes.
This ar cle aims to present simple tools that allow you to monitor the stability of the produc on process.
The object of the analysis was the produc on process of a BTE hearing aids in the company X. The analysis was con‐ ducted between June and July 2009 using the p control chart and Pareto chart. It aimed to show the level of defect in analyzed produc on processes.
SELECTED STATISTICAL TOOLS
To control produc on process we use different kind of tools like control charts, Pareto chart, histograms, flowchart, Ishikawa diagram, correla on diagram and many others. Sta s cal Process Control is the current (that is im‐ plemented in real‐ me process) process control which is
used to detect the possible deregula ons and consequently to improve quality of process [5, 8].
Control charts are used mainly to stability evalua on of the process, but also thanks to them we can find out when a process needs improvement and in what circumstances it should be le unchanged. Depending on the type of pro‐ duc on and quality management system we use different kind of control charts. Appropriate for alterna ve evalua‐ on and others for numerical evalua on. The first one we use for qualita ve characteris cs. They help us to make the division into good and bad elements, define the number of defects, deficiencies or damages of consignment. Other cards used for numerical control may be used only for measurable characteris c.
The sta s cal methods used in the company X are an essen al and reliable tool of receiving control, necessary to provide the quality of technological processes [1].
Sta s cal Process Control is very important not only in receiving, but also in evalua ng the product.
In company X were used cards for alterna ve evalua on which allow to control the process with various parameters. The purpose of this card is to reduce varia on in the most op mal way. The deregula on appears when the upper limit of control is exceeded, assuming that the defect is less than 10%.
One of the main tasks of control charts is quick signal about any devia ons. Card p (p ‐ the frac on of defec ve items) is used for current control. To use this card it is nec‐ essary to take a random samples of n‐element.
On the graph on the x‐axis mark the numbers of sam‐ ples and on the y‐axis the frac on of defec ve items in the i
‐th sample. While plo ng the control charts you consider two cases:
Anna WOLNOWSKA, Małgorzata KOPACZ Mari me University of Szczecin
When the industrial process is sta s cally stable, the probability of exceeding the upper or lower control line is close to 0.001. This occurrence can be considered as "almost impossible". However, you can specify top and bo om line for a given level of α [4].
If the defec veness of process is not known, we calcula‐ te it as follows:
where:
zi ‐ the numbers of defec ve units in the i‐th sample, n ‐ the number of elements in a single sample,
m ‐ the number of samples with the same number of ele‐ ments,
p ‐ defec veness of process.
Upper, central and lower lines have the following form:
The process is sta s cally regulated when the loca on of points on the control chart entwines the central line. To plot the p control chart first you have to calculate the de‐ fec veness of each sample by the size of batch. On the OX‐ axis we mark the consecu ve numbers of samples and on the OY‐axis the corresponding defects. We write the results in the table.
measuring apparatus and also me‐consuming measuring procedures.
Pareto chart is a tool that shows which factors had the most significant influence on the chosen quan ty. It shows that a rela vely small number of factors affects a significant number of exis ng incompa bili es. This tool focuses on the most serious issues and is based on a rule:” 20% of cau‐ ses determines 80% of errors”. This tool illustrates the con‐ tribu on of each factor in descending order and presents them as the cumula ve sum (Lorenzo chart) [2].
Most of the people who examine the problems in com‐ pany which they know very well, they know intui vely which factor is the most important. When there are several causes of the problem and one of them has the most im‐ portant and dominant influence on the incompa bility, using the tool has no sense. However in case of complex causes such as searching the place where the defects form, me of occurrence or significance of the defects, Pareto diagram allows you to find the true cause of the problem.
IDENTIFICATION OF PRODUCT AND PROCESS
BTE hearing aid (Behind‐The‐Ear) so‐called “hook” is placed behind the earlobe, fig. 1. It is characterized by high mechanical resistance. Its all the main parts are combi‐ ned in one casing, which is placed behind the ear. This hea‐ ring aid is easy in daily using. It adjusts the volume automa‐
cally to a specific acous c situa on.
Fig. 1. Behind‐the‐ear hearing aids: on the Picture on the le placed in the ear, right – on the table. Are visible all external parts of hea ng aids, including individual earmold
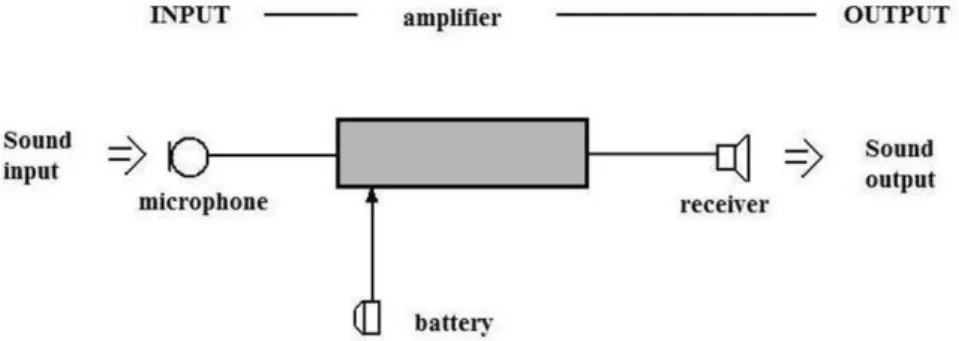
A hearing aid consists of the following elements: a. Input‐ usually microphone which takes noises. b. An electronic amplifier that amplifies, and in some
way transforms the signal from the microphone. c. Output‐ small handset which sends changed signal
into the ear canal.
d. Ba ery‐ provides the energy which hearing aid ne‐ eds for working.
n p p p
LCL 3 (1 ) P(Z<LCL)=0.0013 (3)
n ) p ( p u p ) (
UCL 1 P(Z>UCL(α))=α (4)
n ) p ( p u p ) (
LCL 1 P(Z<LCL(α))=α (5)
m p ˆ p m i i
1 (6)
n z p
ˆ i
i i=1,2,…,m. (7)
n ) p ( p p
UCL 3 1 P(Z>UCL) = 0.0013 (8)
(9) n ) p ( p p
LCL 3 1 P(Z<LCL)=0.0013 (10)
Fig. 2. Basic parts of hearing aid
The fundamental task of microphone is to collect so‐ unds of surroundings and to send appropriate electrical signal to the amplifier of hearing aid. Mostly, the micropho‐ ne collects the sounds from all direc ons, but it can also collect them from one direc on (suppressing at the same me sounds coming from the side and back). It means that sounds coming from the front are more preferred and at the same me sounds coming from other direc ons are not amplified that much. Hearing aid user will have the im‐ pression that the signals coming from the side and back are suppressed. Therefore user will also have impression that this suppressed signals disturb the speech signal coming from the front not so much. Direc onal microphone con‐ sists of two independent iden cal microphones or a pair of iden cal microphones placed in one casing.
A hearing aid may also be equipped with a telecoil, which receives the sounds from the induc on loop placed for example in cinemas, theaters, churches. The sound of the movie projector or system of the microphones is converted via the induc on loop in a magne c field which is received by telecoil in hearing aid. Most BTE have a switch that gives the user choice to listen through the microphone or the coil.
Another element of hearing aid is amplifier. Currently, most electronic amplifiers used in hearing aids are based on digital technology, which displaces analog technology. The main task of the amplifier is of course to strengthen the sounds to be heard by a hearing‐impaired person. Ampli‐ fied sound also has to be adapted to other individual cha‐ racteris c of the damaged auditory organ‐ to the dynamics of hearing, to make all important sounds to be heard and at the same me not uncomfortably loud. This condi on must be fulfilled for all frequencies – from low to high tones.
Hearing aids can have several programs – this means that hearing aid has a few different amplifier adjusted to different acous c condi ons. Hearing aid beside volume knob some mes has also switch to change programs that user of hearing aid can choose one of few programmed se ngs. At the output of the hearing aid is a small receiver that transfers amplified and processed sound to the ear canal.
In BTE the sound is transmi ed from the handset first to the horn of hearing aid‐ a hard, curved tube, made of pla‐ s c, which is an integral part of hearing aid. Then is transmi ed through the so tube, sound tubing to sound channel of earmold, fig. 1. From the handset to the ear ca‐ nal signal needs to travel around 70 mm.
The task of ba ery is to provide electricity to make the hearing aid work. It is placed in a special box that you can open with your fingernail.
Stages of BTE hearing aid manufacturing process: 1. Prepara on of errand.
2. Prepara on of the lower casing;
3. The first person in CMFI‐ prepara on the piece to solder the amplifier.
4. The second person in CMFI‐ points of soldering and solder terminals.
5. The third person in CMFI‐ closing the microphones in casing.
6. Closing the piece. 7. Tes ng the sound. 8. Acous c control. 9. Range test. 10. Coa ng.
11. The first person preparing the amplifier‐ prepara on of microphones and amplifiers.
12. The second person preparing the amplifier‐ resolder‐ ing.
13. The third person preparing the amplifier‐ pu ng the points of soldering.
14. Shield.
Hearing aid – BTE model is characterized by high mecha‐ nical resistance. Its all the main parts are combined in one casing, which is placed behind the ear. This hearing aid is easy in daily using. It adjusts the volume automa cally to a specific acous c situa on.
EXAMINATION THE STABILITY OF THE HEARING AID PRO‐ DUCTION PROCESS
Produc on of BTE especially in the first months was unstable. Produc on of the model type Y started in April 2009. Many errors occurred in this assembly line. Employe‐ es responsible for product Y were looking for new solu ons to minimize occurring errors. Used control chart type p was showing how many and which type of errors occurred du‐ ring the day in this assembly line.
Interpreta on of control charts for alterna ve evalua‐ on is different than interpreta on of control charts for numeric a ributes. Exceeding the upper control limit in‐ forms us about the growth of defec veness of the process, however exceeding the lower tolerance limit doesn’t indi‐ cate the instability of the process but informs about reduc‐
on of defec veness.
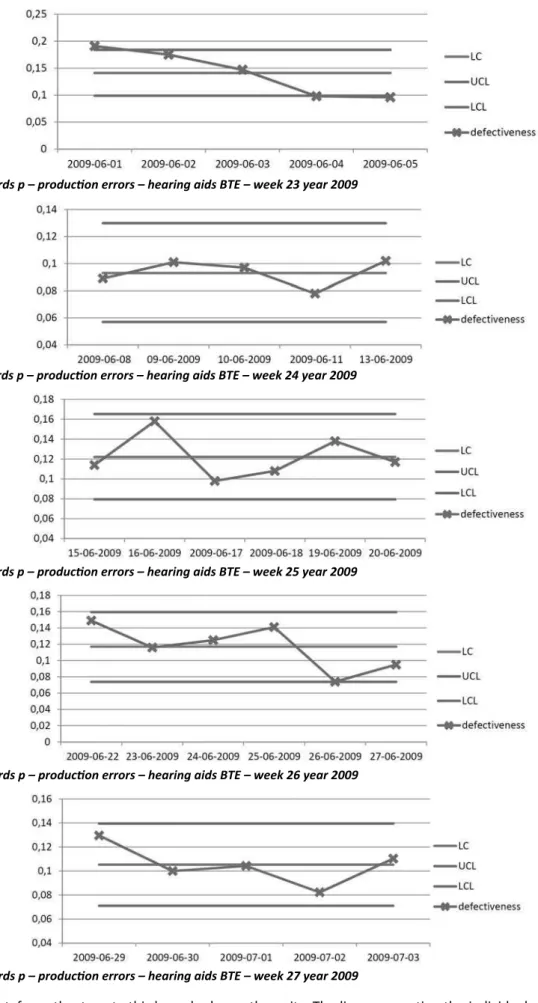
Control chart type p from the twenty‐third week, fig. 3, shows us that in the beginning of the week many errors occurred, which gave a warning signal, and the upper tole‐ rance limit was slightly exceeded. It could be caused by a staff turnover.
Figure 4 shows a typical graph where all the points are between the control limits. Points on the graph entwine control line, there is no signals informing about instability.
Fig. 3. Control cards p – produc on errors – hearing aids BTE – week 23 year 2009
Fig. 4. Control cards p – produc on errors – hearing aids BTE – week 24 year 2009
Fig. 5. Control cards p – produc on errors – hearing aids BTE – week 25 year 2009
Fig. 6. Control cards p – produc on errors – hearing aids BTE – week 26 year 2009
Fig. 7. Control cards p – produc on errors – hearing aids BTE – week 27 year 2009
Control chart from the twenty‐third week shows the random varia on. Random disrup ons are developed acci‐ dental and of natural causes.
On the next control chart, fig. 6, the defec veness is controlled. Points are situated between the limit lines.
Points on the control chart from the week 27, fig. 7, are situated closer to the average level than to the control lim‐
its. The lines connec ng the individual points on the graph intersect the central line. This means that the process is stable.
This means that with the process is nothing wrong. Eve‐ ry day it’s checked by many specialized engineers.
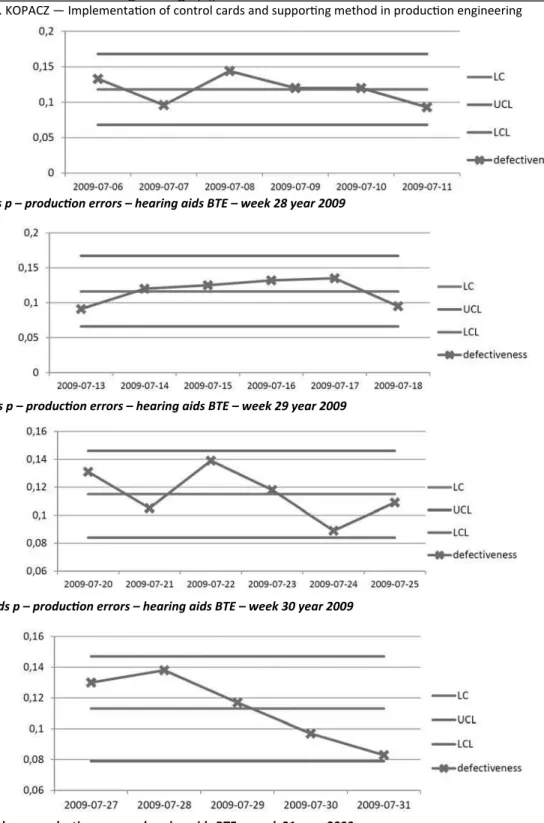
On the control chart from week 29, fig. 9, we can see some trend, following values show an upward trend. It could be caused by the consump on of a machine or pro‐ cess condi ons.
The signals on control chart, fig. 10, intersect the con‐ trol line. It means that the process is regulated. Occurred disturbances are random disturbances.
Fig. 10. Control cards p – produc on errors – hearing aids BTE – week 30 year 2009
On the control chart from week 31, fig. 11, we can see downward trend. This means that the defec veness is re‐ duced and the quality of BTE hearing aid is improved.
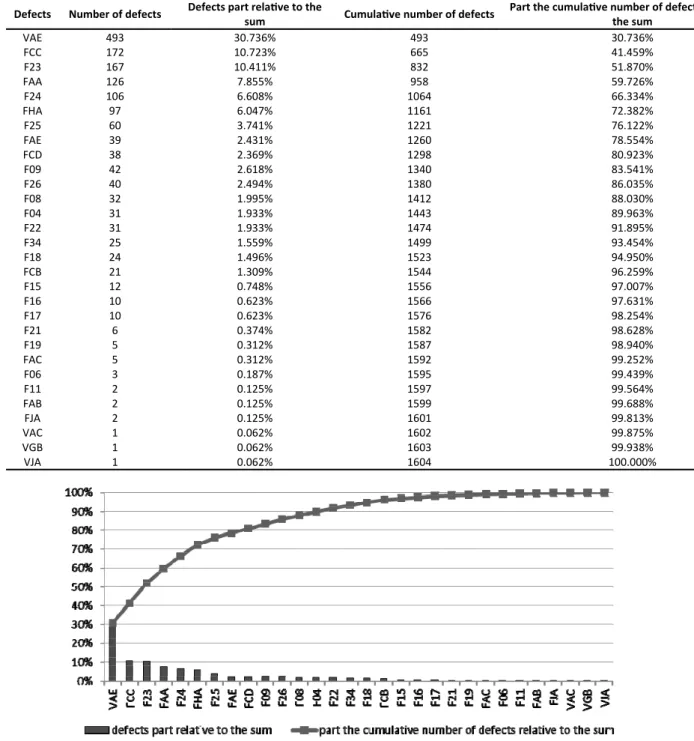
During the analysis also used Pareto diagram, fig. 12 and fig. 13. This diagram shows the three most important defects in the produc on [9]. It demonstrates that 80% of all errors occurred during the produc on are errors such as: VAE‐ overfill/no refilling on the cover of apparatus, FCC‐ no signal a er switching on, FAA‐ distor on, audible sound should be typical for human speech. In June and July result was similar. Data for the analysis is presented in the table 1 and table 2.
Based on Pareto analysis we are able to make decisions, at which point in the process should we make changes to improve it to minimize the errors to the op mum level [3].
Fig. 8. Control cards p – produc on errors – hearing aids BTE – week 28 year 2009
Fig. 9. Control cards p – produc on errors – hearing aids BTE – week 29 year 2009
Fig. 10. Control cards p – produc on errors – hearing aids BTE – week 30 year 2009
F25 60 3.741% 1221 76.122%
FAE 39 2.431% 1260 78.554%
FCD 38 2.369% 1298 80.923%
F09 42 2.618% 1340 83.541%
F26 40 2.494% 1380 86.035%
F08 32 1.995% 1412 88.030%
F04 31 1.933% 1443 89.963%
F22 31 1.933% 1474 91.895%
F34 25 1.559% 1499 93.454%
F18 24 1.496% 1523 94.950%
FCB 21 1.309% 1544 96.259%
F15 12 0.748% 1556 97.007%
F16 10 0.623% 1566 97.631%
F17 10 0.623% 1576 98.254%
F21 6 0.374% 1582 98.628%
F19 5 0.312% 1587 98.940%
FAC 5 0.312% 1592 99.252%
F06 3 0.187% 1595 99.439%
F11 2 0.125% 1597 99.564%
FAB 2 0.125% 1599 99.688%
FJA 2 0.125% 1601 99.813%
VAC 1 0.062% 1602 99.875%
VGB 1 0.062% 1603 99.938%
VJA 1 0.062% 1604 100.000%
Fig. 12. Diagram Pareto ‐hearing aids BTE June 2009
Defects Number of defects Defects part rela ve to the
sum Cumula ve number of defects
Part the cumula ve number of defects rela ve to the sum
VAE 414 22.175% 414 22.175%
FCC 311 16.658% 725 38.832%
FAA 287 15.372% 1012 54.205%
F24 82 4.392% 1094 58.597%
F23 79 4.231% 1173 62.828%
FHA 78 4.178% 1251 67.006%
F25 67 3.589% 1318 70.595%
F04 64 3.428% 1382 74.022%
F18 62 3.321% 1444 77.343%
FCD 56 2.999% 1500 80.343%
F16 48 2.571% 1548 82.914%
F26 41 2.196% 1589 85.110%
F22 37 1.982% 1626 87.092%
F08 36 1.928% 1662 89.020%
F09 34 1.821% 1696 90.841%
F15 30 1.607% 1726 92.448%
FAE 28 1.500% 1754 93.948%
FCB 27 1.446% 1781 95.394%
F34 17 0.911% 1798 96.304%
F07 9 0.482% 1807 96.786%
F17 8 0.428% 1815 97.215%
F19 8 0.428% 1823 97.643%
FAC 8 0.428% 1831 98.072%
FJA 8 0.428% 1839 98.500%
FAB 7 0.375% 1846 98.875%
F21 6 0.321% 1852 99.197%
F06 3 0.161% 1855 99.357%
FJA 3 0.161% 1858 99.518%
FAG 2 0.107% 1860 99.625%
F05 1 0.054% 1861 99.679%
F11 1 0.054% 1862 99.732%
F29 1 0.054% 1863 99.786%
F31 1 0.054% 1864 99.839%
VCA 1 0.054% 1865 99.893%
VHA 1 0.054% 1866 99.946%
VJA 1 0.054% 1867 100.000%
Table 2 Data to Pareto diagram of BTE hearing aid for July 2009
CONCLUSION
SPC tools allow you to control the sta s cal stability of the process. The analysis of hearing aid produc on process in company X shows that this process is sta s cally stable. The points on the control charts doesn’t exceed the toler‐ ance limits. Produc on of BTE hearing aid in the test me was a produc on, which generated the largest number of defects. In company X employees are aware of the quality of produced products. The company cares about the prod‐ ucts and about its customers, so they can enjoy the prod‐ ucts without manufacturing defects.
Many specialized and experienced workers take care about every process. Thanks to them produc on is main‐ tained at a high, interna onal level. In addi on, they bring the methods and tools into ac on that improve the pro‐ cess, provide new informa on about this process, effect on its stability and efficiency. Employees do their job honestly. It’s very hard to find such a good employees who know their du es and who are aware of the responsibility they bear for every step in the company.
One of the most important statements in the case of sta s cal process control, is the ability to make decisions based on facts, not intui on. As the name suggests, SPC is a con nuous collec ng and analyzing numerical data and regula on which is based on taking the appropriate ac ons. For this purpose you need the appropriate reference stand‐ ards and the process to be controlled must be predictable.
The process is sta s cally regulated when variability of the process arises from natural causes and it is called ran‐
dom variability. The process in which occurred special inter‐ ference we call sta s cally irregular, unstable. This kind of process is unpredictable.
Using the SPC we should trend to eliminate "special varia ons" to make this process predictable, so we can con‐ trol it sta s cally.
Currently, customer requirements have become so vast that a tude to quality problems changed. We trend to improvement by minimizing the size of dispersion and cen‐ traliza on the target values.
The analysis showed that the biggest amount of error in the produc on of a BTE hearing aids are errors such as:
VAE‐ overfill/ no refilling on the cover of apparatus,
FCC‐ no signal a er switching on,
FAA‐ distor on, audible sound should be typical for human speech
dr inż. Anna Wolnowska Mari me University of Szczecin
Department of Commodity Science and Quality Management ul. Henryka Pobożnego 11, 70‐507 Szczecin, POLAND
e‐mail: [email protected]
Małgorzata Kopacz
Mari me University of Szczecin
Faculty of Transport Engineering and Economics Scien fic Circle „Teraz Jakość”
ul. Henryka Pobożnego 11, 70‐507 Szczecin, POLAND e‐mail: [email protected]
Artykuł w polskiej wersji językowej dostępny na stronie internetowej czasopisma.
The ar cle in Polish language version available on the web‐ site of the journal
waniu Jakością w Toku Produkcji. Akademia Ekonomiczna im. Karola Adamieckiego. Katowice 2000.
wydanie II. Wydawnictwo Helion. Gliwice 2006. [9] Żuchowski J., Łagowski E.: Narzędzia i metody dos‐