Article
Hemoglobin A1c Is Positively Correlated with Framingham
Risk Score in Older, Apparently Healthy Nondiabetic
Korean Adults
Ji Hye Shin1, Ji In Kang2, Yun Jung2, Young Min Choi2, Hyun Jung Park2, Jung Hae So2, Jin Hwa Kim2, Sang Yong Kim2, Hak Yeon Bae2
1
Miso Silver Hospital, Hwasun; 2
Department of Endocrinology and Metabolism, Chosun University Hospital, Chosun University School of Medicine, Gwangju, Korea
Background: Several studies have suggested that elevated levels of hemoglobin A1c (HbA1c) are associated with cardiovascular disease (CVD) in nondiabetic individuals. However, it is unclear whether HbA1c levels can serve as a simple screening marker for increased CVD risk in nondiabetic individuals. Our objective was to evaluate the relationship between HbA1c levels and CVD risk using the Framingham risk score (FRS) in older, apparently healthy nondiabetic Korean adults.
Methods: We retrospectively studied 2,879 Korean adults between the ages of 40 and 79 who underwent voluntary health check-ups at the Health Promotion Center of our hospital from July 2009 to June 2011. Subjects were subdivided based on their HbA1c levels into four groups: tertiles within the HbA1c normal tolerance range and a group for subjects with an increased risk for dia-betes (IRD).
Results: The mean FRS for the upper tertile (9.6±3.8) group was significantly higher than that of the middle tertile (8.4±4.0)
and lower tertile (7.6±3.8) groups. In addition, FRS was highest in the IRD group (10.5±3.7). Multiple linear regression
analy-sis demonstrated that HbA1c levels exhibited a significant positive correlation with FRS when adjusted for confounding variables
in all subjects (β±standard error [SE], 0.018±0.002; R2, 0.131), women (β±
SE, 0.023±0.003; R2, 0.170), and men (β±
SE, 0.016
±0.004; R2
, 0.109).
Conclusion: HbA1c levels were positively correlated with FRS in older, apparently healthy nondiabetic Korean adults. We pro-pose that HbA1c levels may reflect CVD risk in nondiabetic individuals.
Keywords: Hemoglobin A, glycosylated; Framingham risk score; Nondiabetic individuals
INTRODUCTION
Hyperglycemia has been established as a risk factor for car-diovascular disease (CVD) [1]. Epidemiological studies have shown that elevated glucose levels are associated with CVD
risk even among individuals without diabetes [2-4]. Hemoglo-bin A1c (HbA1c) levels provide an index of an individual’s average glycemia over the past 2 to 3 months. HbA1c levels have a low intraindividual variability and reflect both fasting and postprandial glycemic states. Therefore, HbA1c levels are
Received: 25 January 2013, Accepted: 21 March 2013
Corresponding author: Sang Yong Kim
Department of Endocrinology and Metabolism, Chosun University Hospital, Chosun University School of Medicine, 365 Pilmun-daero, Dong-gu, Gwangju 501-717, Korea
Tel: +82-62-220-3011, Fax: +82-62-223-3316, E-mail: diabetes@chosun.ac.kr
Copyright © 2013 Korean Endocrine Society
considered to be a useful indicator of dysglycemia [5,6]. Re-cently, several studies have suggested that elevated HbA1c lev-els are associated with CVD in nondiabetic adults, and may be a risk indicator for the development of CVD [7-14]. However, it is unclear whether elevated HbA1c levels reflect CVD risk in all individuals, irrespective of characteristics including ge-netics, sex, race/ethnicity, and population. To our knowledge, there have been no studies that have focused on a Korean pop-ulation, particularly a population considered to be healthy. Framingham risk score (FRS) is a widely used model for predicting CVD over a 10-year period [15]. FRS is useful for CVD prediction in middle-aged, asymptomatic individuals [16,17]. Previous studies have demonstrated that the FRS is useful for predicting CVD in Korea [18,19]. Specifically, Kang and Kim [18] suggested that FRS is associated with CVD in Korean men based on the third Korea National Health and Nu-trition Examination Survey in 2005. Thus, the objective of the present study was to evaluate the relationship between HbA1c levels and FRS in older, apparently healthy nondiabetic Kore-an adults.
METHODS
Study population
We retrospectively reviewed 2,879 Korean adults between the ages of 40 and 79 who underwent voluntary regular health check-ups at the Health Promotion Center of our hospital from July 2009 to June 2011. Individuals who were previously di-agnosed with diabetes, hypertension, or dyslipidemia, as well as those being treated with hypoglycemic agents, antihyperten-sive agents, and lipid-lowering agents were excluded. Addi-tional exclusion criteria were as follows: coronary artery ease, stroke, acute infection, pregnancy, malignancy, liver dis-ease, thyroid disdis-ease, impaired renal function, fasting plasma glucose above 126 mg/dL or HbA1c level above 6.5%, hemo-globin concentration less than 12.0 g/dL for females or 13.0 g/ dL for males, and missing data. A total of 1,535 individuals were included in the study after excluding ineligible subjects. Data were collected by reviewing medical questionnaires (medical history and smoking status), a physical examination (height, weight, and blood pressure), and laboratory tests. Af-ter an overnight (>8 hours) fast, venous blood samples were
collected in K2-EDTA using serum separator blood-drawing tubes (Becton Dickinson, Franklin Lakes, NJ, USA). Fasting plasma glucose concentrations were measured using the hexo-kinase enzymatic method. Levels of low density lipoprotein
cholesterol (LDL-C), total cholesterol (TC), triglycerides (TGs), and high density lipoprotein cholesterol (HDL-C) were measured with an ADVIA 1650 (Bayer, Tokyo, Japan). HbA1c levels were measured using ion-exchange high-performance liquid chromatography (Variant II, Bio-Rad, Hercules, CA, USA). The FRS for each patient was calculated using the Na-tional Cholesterol Education Program Adult Treatment Panel III algorithm, which is based on six risk factors: gender, age, TC, HDL-C, systolic blood pressure, and smoking status [15].
Statistical analysis
Subjects were subdivided based on their HbA1c levels into four groups: tertiles within the HbA1c normal tolerance range and a group for subjects with an increased risk for diabetes (IRD) [20]. Division by tertiles within the normal tolerance range was defined as follows: lower tertile (LT), HbA1c ≤5.3%; middle tertile (MT), 5.3%<HbA1c≤5.5%; and upper tertile (UT), 5.5%<HbA1c<5.7%. The IRD group was defined as
5.7%≤HbA1c<6.5%. Comparisons within groups were
per-formed using one-way ANOVA for continuous variables, and Tukey’s multiple range test was used for categorical variables. Post-hoc analysis was performed using Scheffe’s method to compare differences between groups. Multiple linear regres-sion analysis was used to identify independent associations be-tween HbA1c levels and FRS results. We used multiple linear regression models to control for effects of body mass index (BMI) alone or the combined effects of BMI, diastolic blood pressure, TG, and LDL-C. Additional multiple linear regres-sion models were employed to examine the combined effects of BMI, diastolic blood pressure, TG, LDL-C, and high sensi-tive C-reacsensi-tive protein (hs-CRP) on FRS results. Statistical analyses were performed using IBM SPSS software version 19.0 (IBM Co., Armonk, NY, USA). P values <0.05 were
con-sidered statistically significant.
RESULTS
The clinical and biochemical characteristics of subjects are listed in Table 1. The mean age of the subjects included in this study was 51.0±8.2 years. Men were more likely than women
to have elevated weight, BMI, systolic and diastolic blood pressure, and TG concentrations, and were also more likely to smoke. The mean FRS was 9.4±4.0, and the mean 10-year
CVD risk was 4.4%±5.1%. The average FRS and 10-year
CVD risks were higher for men than women.
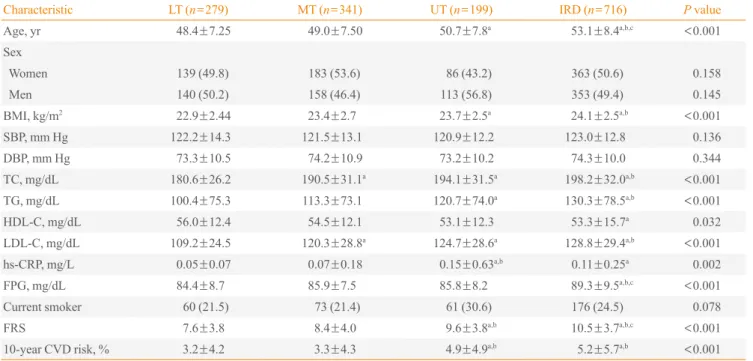
tertiles and IRD group are shown in Table 2. Age, BMI, TC, TG, HDL-C, LDL-C, and hs-CRP were significantly different between the HbA1c subgroups. Age, BMI, TC, TG, and LDL-C were highest in the IRD group. Age, BMI, TG, and hs-LDL-CRP were significantly higher in UT subjects than LT subjects. TC and LDL-C were significantly higher in MT and UT subjects than LT subjects. FRS in the UT (9.6±3.8) group was
signifi-cantly higher than those of the MT (8.4±4.0) and LT (7.6±3.8)
groups. Moreover, FRS was highest in the IRD (10.5±3.7)
group. The 10-year CVD risk in the UT (4.9±4.9%) and IRD
(5.2±5.7%) groups was also significantly higher than for the
MT (3.3±4.3%) and LT (3.2±4.2%) groups.
Table 3 shows a multivariable-adjusted relationship between HbA1c levels and FRS for all subjects subdivided by gender. After adjusting for BMI, HbA1c levels exhibited a significant
positive relationship with FRS across all subjects (β±standard
error [SE], 0.023±0.002
; R2, 0.110) as well as women (β±
SE, 0.025±0.002; R2, 0.149) and men (β±
SE, 0.023±0.003; R2
,
0.085) alone. In addition, the independent positive relationship between HbA1c and FRS remained significant in across all
subjects (β±SE, 0.019±0.002; R2, 0.129), women (β±
SE, 0.024±0.003; R2, 0.168), and men (β±
SE, 0.017±0.004; R2
, 0.108) after adjusting for diastolic blood pressure, TG, LDL-C, and BMI. These significant positive relationships persisted
across all subjects (β±SE, 0.018±0.002; R2
, 0.131), women
(β±SE, 0.023±0.003; R2, 0.170), and men (β±
SE, 0.016±
0.004; R2
, 0.109) after adjusting for hs-CRP as well.
DISCUSSION
The results of the present study demonstrated a significant positive relationship between HbA1c levels and FRS in older, apparently healthy nondiabetic Korean Adults. After adjusting for confounding variables, HbA1c levels were found to be positively correlated with FRS in both men and women. Diabetes is well known as a risk factor for CVD [21]. Dia-betic patients have a 2-fold to 4-fold increased rick of CVD compared to nondiabetics [22]. Impaired glucose tolerance (IGT) and impaired fasting glucose (IFG) have also been shown to increase CVD risk [23]. Interestingly, a relationship between elevated glucose levels and CVD risk has been reported in people without diabetes [2-4]. High glucose concentrations may accelerate atherosclerotic processes through oxidative stress and protein glycation of vessel walls [24]. As such, the possibility that the degree of dysglycemia is an independent risk factor for CVD has been proposed [1-4,21,23]. However, a causal role of glucose itself in the development of CVD re-mains illusive. HbA1c levels reflect circulating glucose levels over the preceding 2 to 3 months, have a low intraindividual variation, and can be assessed in a nonfasting state. HbA1c levels represent both the fasting and postprandial glycemic state and are considered useful as a measurement of dysglyce-mia. HbA1c levels are also used as an index for the risk of de-veloping diabetic complications and to guide therapy by as-sessing the response to glucose-lowering treatments in diabetic patients [5,6]. Recently, HbA1c levels have also been added as a diagnostic criterion for diabetes, largely due to the established association between HbA1c levels and microvascular disease [20].
Several studies have suggested that HbA1c levels may be useful for detecting the risk of CVD in nondiabetic subjects [7-14]. The Hoorn study [7] showed that a 1.4% increase of HbA1c is associated with a higher age-adjusted and sex-ad-justed risk of all-cause (relative risk [RR], 1.61) and CVD
Table 1. Clinical and Biochemical Characteristics of Subjects
Characteristic All subjects (n=1,535)
Women (n=771)
Men
(n=764) P value
Age, yr 51.0±8.2 51.3±8.3 50.7±8.1 0.140
Height, cm 164.1±8.6 157.7±5.6 170.5±6.1 <0.001
Weight, kg 64.0±9.9 58.3±7.6 69.8±8.6 <0.001
BMI, kg/m² 23.7±2.6 23.4±2.7 23.9±2.4 <0.001
SBP, mm Hg 122.2±13.1 121.0±13.6 123.5±12.5 <0.001
DBP, mm Hg 74.0±10.3 72.8±10.3 75.1±10.1 <0.001
TC, mg/dL 192.8±31.4 193.9±32.8 191.7±29.9 0.161
TG, mg/dL 119.9±77.0 108.4±75.0 131.5±77.1 <0.001
HDL-C, mg/dL 54.0±14.0 56.6±12.4 51.4±15.0 <0.001
LDL-C, mg/dL 122.8±29.2 122.4±29.9 123.3±28.5 0.533
hs-CRP, mg/L 0.099±0.30 0.09±0.22 0.10±0.36 0.255
FPG, mg/dL 87.2±9.0 86.0±8.6 88.4±9.2 <0.001
HbA1c, % 5.6±0.3 5.63±0.30 5.62±0.31 0.307
Current smoker 370 (24.1) 30 (3.8) 340 (44.5) <0.001
FRS 9.4±4.0 9.0±4.5 9.8±3.3 <0.001
10-year CVD risk, %
4.4±5.1 1.1±1.6 7.7±5.3 <0.001
Values are expressed as mean±SD or number (%).
mortality (RR, 2.12) in older subjects without diabetes during an 8 year follow-up period. The Rancho Bernardo study [8], a community-based analysis of 1,239 nondiabetic older adults, showed that HbA1c levels, but not fasting plasma glucose or postchallenge plasma glucose levels, are significantly related to CVD and ischemic heart disease (IHD) associated mortality in women but not men. The authors of the EPIC-Norfolk study
[9] demonstrated that HbA1c levels are continuously related to subsequent all-cause, CVD, and IHD mortality throughout an entire population distribution, with the lowest rates observed in men with HbA1c levels below 5%. A one percent increase in HbA1c levels was shown to be significantly associated with a 28% increased risk of death after multivariable adjustment, an effect that persisted even after excluding men with known
Table 2. Clinical and Biochemical Characteristics Stratified by Tertiles of the Normal HbA1c Tolerance Range and Increased Risk for Diabetes
Characteristic LT (n=279) MT (n=341) UT (n=199) IRD (n=716) P value
Age, yr 48.4±7.25 49.0±7.50 50.7±7.8a 53.1±8.4a,b,c <0.001
Sex
Women 139 (49.8) 183 (53.6) 86 (43.2) 363 (50.6) 0.158
Men 140 (50.2) 158 (46.4) 113 (56.8) 353 (49.4) 0.145
BMI, kg/m2 22.9±2.44 23.4±2.7 23.7±2.5a 24.1±2.5a,b <0.001
SBP, mm Hg 122.2±14.3 121.5±13.1 120.9±12.2 123.0±12.8 0.136
DBP, mm Hg 73.3±10.5 74.2±10.9 73.2±10.2 74.3±10.0 0.344
TC, mg/dL 180.6±26.2 190.5±31.1a
194.1±31.5a
198.2±32.0a,b < 0.001
TG, mg/dL 100.4±75.3 113.3±73.1 120.7±74.0a 130.3±78.5a,b <0.001
HDL-C, mg/dL 56.0±12.4 54.5±12.1 53.1±12.3 53.3±15.7a 0.032
LDL-C, mg/dL 109.2±24.5 120.3±28.8a 124.7±28.6a 128.8±29.4a,b <0.001
hs-CRP, mg/L 0.05±0.07 0.07±0.18 0.15±0.63a,b
0.11±0.25a
0.002
FPG, mg/dL 84.4±8.7 85.9±7.5 85.8±8.2 89.3±9.5a,b,c <0.001
Current smoker 60 (21.5) 73 (21.4) 61 (30.6) 176 (24.5) 0.078
FRS 7.6±3.8 8.4±4.0 9.6±3.8a,b 10.5±3.7a,b,c <0.001
10-year CVD risk, % 3.2±4.2 3.3±4.3 4.9±4.9a,b
5.2±5.7a,b < 0.001
Values are expressed as mean±SD or number (%). LT, HbA1c ≤5.3%; MT, 5.3%<HbA1c≤5.5%; UT, 5.5%<HbA1c<5.7%; IRD, 5.7≤
HbA1c<6.5%.
LT, lower tertile; MT, middle tertile; UT, upper tertile; IRD, increased risk for diabetes; BMI, body mass index; SBP, systolic blood pressure; DBP, diastolic blood pressure; TC, total cholesterol; TG, triglyceride; HDL-C, high density lipoprotein cholesterol; LDL-C, low density lipoprotein cho-lesterol; hs-CRP, high sensitive C-reactive protein; FPG, fasting plasma glucose; FRS, Framingham risk score; CVD, cardiovascular disease. aP<0.05 vs. LT; bP<0.05 vs. MT; cP<0.05 vs. UT.
Table 3. Multiple Linear Regression Analyses of the Relationship between Framingham Risk Score (as a Dependent Variable) and Hemoglobin A1c (as an Independent Variable)
Total (n=1,535) Women (n=771) Men (n=764)
Coefficient
R2 Coefficient R2 Coefficient R2
β±SE P value β±SE P value β±SE P value
Model 1 0.023±0.002 <0.001 0.110 0.025±0.002 <0.001 0.149 0.023±0.003 <0.001 0.085
Model 2 0.019±0.002 <0.001 0.129 0.024±0.003 <0.001 0.168 0.017±0.004 <0.001 0.108
Model 3 0.018±0.002 <0.001 0.131 0.023±0.003 <0.001 0.170 0.016±0.004 <0.001 0.109
Model 1, adjusted by body mass index. Model 2, adjusted by body mass index, diastolic blood pressure, triglyceride, and low density lipoprotein cholesterol. Model 3, adjusted by body mass index, diastolic blood pressure, triglyceride, low density lipoprotein cholesterol, and high sensitive C-reactive protein.
diabetes, HbA1c levels ≥7%, a history of myocardial infarc-tion, or a history of stroke. Selvin et al. [10] demonstrated in the Atherosclerosis Risk in Communities study that HbA1c lev-els are a strong predictor of CVD and death from any cause in participants without a history of diabetes. Specifically, in a community-based population of nondiabetic middle-aged white and black adults, the predictive value of HbA1c levels was demonstrated to be superior compared with fasting glucose values. Silbernagel et al. [11] found that HbA1c levels are sig-nificantly and independently associated with fasting glucose predicted all-cause and CVD mortality in individuals without a history of diabetes undergoing coronary angiography. Al-though concerns have been raised about the clinical significance of nondiabetic hyperglycemia for CVD risk and the role of HbA1c levels as a reasonable marker at this stage, it is uncer-tain whether HbA1c levels may serve as a simple screening marker for increased CVD risk in nondiabetic individuals. Moreover, HbA1c can be affected by individual characteris-tics, including genecharacteris-tics, sex, race/ethnicity, and different popu-lations [25,26].
In the present study, we evaluated the relationship between HbA1c level and CVD risk by estimating FRS in older, appar-ently healthy nondiabetic Korean adults. FRS is a widely used tool for assessing 10-year risk for CVD events in middle-aged, asymptomatic individuals. FRS is calculated from CVD risk factors including age, gender, smoking, systolic blood pressure, HDL-C, and TC [15-17]. We found a significant positive cor-relation between HbA1c levels and FRS, which remained after adjusting for all conditions associated with FRS in all popula-tions as well as for gender differences. FRS and 10-year CVD risk in the UT group was significantly higher than those of MT and LT group, all of which were within the normal glucose tolerance range of HbA1c. In particular, FRS was the highest, by a significant amount, in the IRD population. It is likely that HbA1c levels, which represent chronic exposure to fasting and postprandial hyperglycemia, may reflect a combination of metabolic defects underlying both IFG and IGT. This hypoth-esis suggests that HbA1c levels reflect CVD risk in middle-aged nondiabetic Korean adults, even though their HbA1c levels are generally considered to be within a normal range. Some stud-ies have suggested the usefulness of HbA1c as a predictor of metabolic syndrome, defined as a cluster of closely related CVD risk factors such as obesity, dyslipidemia, hypertension, and hyperglycemia [27,28]. In our study, dyslipidemia and obesity was observed in UT subjects within the normal glucose toler-ance range of HbA1c, while those in the IRD group were
com-parable with the MT and LT groups. Our results provide evi-dence that in subjects without diabetes, HbA1c levels may func-tion as an index of CVD risk.
The limitations of this study include the small sample size and its cross-sectional design, which precludes the clear deter-mination of a causal relationship. That the FRS for CVD and specific outcomes could not be assessed was another limitation of our study, and thus we cannot provide insight into whether elevated FRS actually causes CVD events. The lack of oral glucose tolerance test data and measurement of HbA1c levels at only one timepoint are also important limitations. In addi-tion, almost half of the study subjects fell into the IRD group. Lastly, our results may not be generalizable to all Koreans be-cause the study participants were volunteers who attended regular health check-ups. Despite these limitations, this study is meaningful because it presents the most current data avail-able with respect to evaluating the association between HbA1c levels and FRS in older, apparently healthy nondiabetic Kore-an adults.
In conclusion, HbA1c levels were positively correlated with FRS in older, apparently healthy nondiabetic Korean adults. We propose that HbA1c levels may reflect the risk of CVD as-sociated with nondiabetic hyperglycemia, which should be evaluated in the future by prospective studies.
CONFLICTS OF INTEREST
No potential conflict of interest relevant to this article was re-ported.
ACKNOWLEDGMENTS
This study was supported by research funds from Chosun Uni-versity, 2011.
REFERENCES
1. Coutinho M, Gerstein HC, Wang Y, Yusuf S. The
relation-ship between glucose and incident cardiovascular events. A metaregression analysis of published data from 20 stud-ies of 95,783 individuals followed for 12.4 years. Diabetes Care 1999;22:233-40.
2. Levitan EB, Song Y, Ford ES, Liu S. Is nondiabetic
3. Sarwar N, Aspelund T, Eiriksdottir G, Gobin R, Seshasai
SR, Forouhi NG, Sigurdsson G, Danesh J, Gudnason V. Markers of dysglycaemia and risk of coronary heart dis-ease in people without diabetes: Reykjavik prospective study and systematic review. PLoS Med 2010;7:e1000278.
4. Meigs JB, Nathan DM, D’Agostino RB Sr, Wilson PW;
Framingham Offspring Study. Fasting and postchallenge glycemia and cardiovascular disease risk: the Framingham Offspring Study. Diabetes Care 2002;25:1845-50.
5. Selvin E, Crainiceanu CM, Brancati FL, Coresh J.
Short-term variability in measures of glycemia and implications for the classification of diabetes. Arch Intern Med 2007;167: 1545-51.
6. Nathan DM, Singer DE, Hurxthal K, Goodson JD. The
clinical information value of the glycosylated hemoglobin assay. N Engl J Med 1984;310:341-6.
7. de Vegt F, Dekker JM, Ruhe HG, Stehouwer CD, Nijpels G,
Bouter LM, Heine RJ. Hyperglycaemia is associated with all-cause and cardiovascular mortality in the Hoorn popu-lation: the Hoorn Study. Diabetologia 1999;42:926-31.
8. Park S, Barrett-Connor E, Wingard DL, Shan J, Edelstein
S. GHb is a better predictor of cardiovascular disease than fasting or postchallenge plasma glucose in women without diabetes. The Rancho Bernardo Study. Diabetes Care 1996; 19:450-6.
9. Khaw KT, Wareham N, Luben R, Bingham S, Oakes S,
Welch A, Day N. Glycated haemoglobin, diabetes, and mortality in men in Norfolk cohort of european prospec-tive investigation of cancer and nutrition (EPIC-Norfolk). BMJ 2001;322:15-8.
10. Selvin E, Steffes MW, Zhu H, Matsushita K, Wagenknecht
L, Pankow J, Coresh J, Brancati FL. Glycated hemoglobin, diabetes, and cardiovascular risk in nondiabetic adults. N Engl J Med 2010;362:800-11.
11. Silbernagel G, Grammer TB, Winkelmann BR, Boehm
BO, Marz W. Glycated hemoglobin predicts all-cause, car-diovascular, and cancer mortality in people without a his-tory of diabetes undergoing coronary angiography. Diabe-tes Care 2011;34:1355-61.
12. Selvin E, Coresh J, Golden SH, Brancati FL, Folsom AR,
Steffes MW. Glycemic control and coronary heart disease risk in persons with and without diabetes: the atherosclero-sis risk in communities study. Arch Intern Med 2005;165: 1910-6.
13. Selvin E, Coresh J, Shahar E, Zhang L, Steffes M, Sharrett
AR. Glycaemia (haemoglobin A1c) and incident ischaemic
stroke: the Atherosclerosis Risk in Communities (ARIC) Study. Lancet Neurol 2005;4:821-6.
14. Gerstein HC, Swedberg K, Carlsson J, McMurray JJ,
Mi-chelson EL, Olofsson B, Pfeffer MA, Yusuf S; CHARM Program Investigators. The hemoglobin A1c level as a progressive risk factor for cardiovascular death, hospital-ization for heart failure, or death in patients with chronic heart failure: an analysis of the Candesartan in Heart fail-ure: Assessment of Reduction in Mortality and Morbidity (CHARM) program. Arch Intern Med 2008;168:1699-704.
15. National Cholesterol Education Program (NCEP) Expert
Panel on Detection, Evaluation, and Treatment of High Blood Cholesterol in Adults (Adult Treatment Panel III). Third Report of the National Cholesterol Education Pro-gram (NCEP) Expert Panel on Detection, Evaluation, and Treatment of High Blood Cholesterol in Adults (Adult Treatment Panel III) final report. Circulation 2002;106: 3143-421.
16. Wilson PW, D’Agostino RB, Levy D, Belanger AM,
Sil-bershatz H, Kannel WB. Prediction of coronary heart dis-ease using risk factor categories. Circulation 1998;97: 1837-47.
17. Anderson KM, Odell PM, Wilson PW, Kannel WB.
Car-diovascular disease risk profiles. Am Heart J 1991;121(1 Pt 2):293-8.
18. Kang HM, Kim DJ. Metabolic syndrome versus
Framing-ham risk score for association of self-reported coronary heart disease: the 2005 Korean Health and Nutrition Ex-amination Survey. Diabetes Metab J 2012;36:237-44.
19. Ryoo JH, Cho SH, Kim SW. Prediction of risk factors for
coronary heart disease using Framingham risk score in Ko-rean men. PLoS One 2012;7:e45030.
20. American Diabetes Association. Diagnosis and
classifica-tion of diabetes mellitus. Diabetes Care 2010;33 Suppl 1: S62-9.
21. Juutilainen A, Lehto S, Ronnemaa T, Pyorala K, Laakso M.
Type 2 diabetes as a “coronary heart disease equivalent”: an 18-year prospective population-based study in Finnish subjects. Diabetes Care 2005;28:2901-7.
22. Stamler J, Vaccaro O, Neaton JD, Wentworth D. Diabetes,
other risk factors, and 12-yr cardiovascular mortality for men screened in the Multiple Risk Factor Intervention Tri-al. Diabetes Care 1993;16:434-44.
23. Barr EL, Zimmet PZ, Welborn TA, Jolley D, Magliano DJ,
and all-cause mortality in individuals with diabetes melli-tus, impaired fasting glucose, and impaired glucose toler-ance: the Australian Diabetes, Obesity, and Lifestyle Study (AusDiab). Circulation 2007;116:151-7.
24. Brownlee M. Lilly Lecture 1993. Glycation and diabetic
complications. Diabetes 1994;43:836-41.
25. Pani LN, Korenda L, Meigs JB, Driver C, Chamany S, Fox
CS, Sullivan L, D’Agostino RB, Nathan DM. Effect of ag-ing on A1C levels in individuals without diabetes: evidence from the Framingham Offspring Study and the National Health and Nutrition Examination Survey 2001-2004. Dia-betes Care 2008;31:1991-6.
26. Herman WH, Ma Y, Uwaifo G, Haffner S, Kahn SE,
Hor-ton ES, Lachin JM, Montez MG, Brenneman T, Barrett-Connor E; Diabetes Prevention Program Research Group. Differences in A1C by race and ethnicity among patients with impaired glucose tolerance in the Diabetes Prevention Program. Diabetes Care 2007;30:2453-7.
27. Sung KC, Rhee EJ. Glycated haemoglobin as a predictor
for metabolic syndrome in non-diabetic Korean adults. Di-abet Med 2007;24:848-54.
28. Park SH, Yoon JS, Won KC, Lee HW. Usefulness of