Vol-7, Special Issue3-April, 2016, pp1712-1723 http://www.bipublication.com
Case Report
The relationship between credit risk and the performance of banks
Shamim Kabiri harzevili1 and Ebrahim Chirani2
1,2Department of Management,
Rasht Branch,
Islamic Azad University, Rasht, Iran
Email of corresponding author*: [email protected]
ABSTRACT
The purpose of this paper is to examine the relationship between credit risk and the performance of banks with an emphasis on performance indicators; doubtful receivables ratio to total loans and costs per loans to total loans are used for measuring the credit risk. The population of this research includes ten banks listed on the Tehran Stock Exchange. The banks were selected as the sample of the study through an eight year fiscal period from 2007 to 2014. This study, is a descriptive study. To analyze the data, multiple linear regression and combined data analysis were used through the application of Eviwes7software. The results of the hypotheses of the study indicate that there is a negative relationship between doubtful receivables ratio and Total asset turn over and profit margin. Also there is a direct relationship between cost per loan advanced ratios and Total asset turn over and a negative relationship between cost per loan advanced ratios and profit margin.
Key words: Credit risk, performance, Total asset turn over, Operational performance
INTRODUCTION
Over the past two decades, banks worldwide have experienced significant changes in their business environment, internal and external factors had an impact on the structure and performance of the banking system. However, despite all the proposed changes, the banking system is still the main of financing supplier of economic activities in many countries and plays a central role in the transfer of resources from savers to investment units. Hoffman (2011), believes that a healthy and profitable banking system, can resist better against economic shocks, and plays a more prominent role in the stability of the financial system. According to the above description, it is clear that the factors affecting the performance and profitability of the banking system, are of interests of researchers, managers of the banking system, monetary observers and economic
useful and necessary both in the banking industry and the economic growth and occupation. In this article the problem of research, description, the necessity and the basic goals and assumption of the research are summarized.
The statement of the problem
Banking in Iran during recent decades was faced with changes in the field of deregulation and new technologies in the service and the setting of growth targets by the banks that are most governmental advances the system toward competitiveness. With the increase in competitiveness in the banking system of Iran, banks must constantly monitor their performance and annually assess their performance according to that of the competitors using appropriate models. In this context, banks can greatly guarantee their success in competition with competitors through their competitive advantages and strengthening them. Ranking banks in terms of performance, is important and in the competitive environment can promote the banks qualitatively and quantitatively and eventually cause the country's economic growth and prosperity. [Gholipour, 2010, p. 24].
Also one of the objectives of the bank's management, is to increase the realized profit of the shareholder with an emphasis on performance of the banks. This goal is often associated with an increased risk. Banks start to manage the risk when it causes a decreased efficiency of the banks. The subject of risk management in banks not only has a profound effect on the performance of the banks but also has a significant effect on economic growth [Panahian and Abyak, 2013, p. 69]. Any organization considering the nature of their work, will experience a variety of risks and in today's changing circumstances, the success of any business depends on its domination over a variety of risks and the type of risk management. In the field of financial activities, risks are regarded as one of the key factors influencing the performance of financial institutions and banks [Qalami, 2011, p. 13]. Hence, lack of attention to credit risk, leads banks to increase the reserves of
loans to cover credit risk. The major consequence of increased loan reserves, is the reduced efficiency of the bank investment and profitability. Credit risk’s management mechanism provides reliable estimations of credit risk and leads to the removal of estimations of reserves from a conservative experimental mode. Such a situation is likely to reduce the amount of reserves and increase the accuracy of estimations [Kurawa & Garba, 2014, p 107]. So when we talk about risk, the goal is not to eliminate risk, but to identify and determine the costs arising from it. However, Risk does not convey a meaning because it is a variable that can affect other conditions of firms such as profit, efficiency and etc. [Khosh Sima, Shahiki Tash, 2012, p. 70]. Thus, this article has focused on the relationship between credit risk and the performance of banks.
The review of related literature
Numerous researches have been conducted on the relationship between credit risk and the performance of banks; some of them are mentioned in the form of foreign and domestic investigations:
Cooper, Jackson and Patterson (2003) believe that the increase in credit risk, have a direct impact on the quality of facility and as a result, affect the performance and profitability of banks [Cooper, Jackson & Patterson, 2003, p214].
Chiu and Chen (2009), in a paper titled "Analysis of the performance of Taiwanese banks: a combination of both external and internal risks to the environment" examined the relationship between credit risk, market and profit margin of banks. Using the DEA and SFA methods and their results, they calculated risk and performance of banks and eventually found a significant relationship between risk and performance. [Chi & Chen, 2009, p 456]
remarkable results. They realized that corporate governance in state-owned banks has a positive relationship with ROE and in the private banks, the board size and the percentage of outside directors have a negative relationship with the performance of banks. There is a negative relationship between board size and the percentage of outside directors in public and private banks [Ajanthan, Balaputhiran & Nimalathashan, 2013, P1].
Kurawa and Garba (2014), conducted an article evaluating the effectiveness of credit risk management on the profitability of banks of Nigeria between the years 2002 to 2011. The research has been carried out by considering three independent variables of Doubtful Receivables (DR), Cost per Loan Advanced (CLA), the capital adequacy ratio (CAR) and return on assets (ROA). The findings represent a significant and positive effect between three independent variables and Nigerian bank’s profitability. [Kurawa & Garba, 2014, p104].
Fredrikssonand Moro in a study entitled Bank–SMEs relationships and banks’ risk adjusted profitability” reviewed the small firm’s performance utilizing the loan index and the relationship between small and medium banks affected by risk. After analyzing 4285 observations of combined data from the Bank of Finland and analyzing quality of SMEs found that a major factor is disguised in explaining the bank's risk-adjusted profitability. However, the length and scope of a relationship and the loan also play an important role [Fredriksson & Moro, 2014, p 67].
Goudarzi and Fallahati (2006), conducted a study to find the impact of the banking market’s focus on credit risk. The indices used in this study were the ratio of loans to assets, the ratio of past due and deferred receivables to the loans, Capital adequacy ratio to calculate credit risk, top firm’s
concentrationratio ,and Herfindahl – Hirschman [Goudarzi & Fallahati, 2006, p The results of this study demonstrate that:
Studying the structure of the banking market in credit facilities indicated a relatively high degree of concentration. Banks (including commercial and specialized) in granting facilities concentrate more on the aspects of profitability of contracts and the risk of contracts have had a less impact on granting facilities. Furthermore, the correlation coefficient between the two variables of concentration and credit risk indicated a positive relationship (albeit lower than 3%) between the two variables in the country's banking network.
Panahian and Abyak (2013), in a study entitled "explaining the effects of risk on the performance of banks using the calculating method of DEA» evaluated the performance and rating of the banks and the optimum model as well as the effect of credit risk, operational and market on banking system's performance. Three banks of Melli, Saderat, and Mellat were selected as the population of the study during 2008 to 2010 on a monthly basis for the past 36-month period. To estimate the performance, the DEA method was used in the research model. In addition, to examine the effect of risk on the performance, a model was estimated through econometric method of ordinary least squares (OLS) and three risks were studied based on the indices selected for the research. The results indicate that the ratio of default loans to total granted facilities as an indicator of credit risk is significantly related to performance.
suggests that measuring levels of managerial ownership has a significant negative impact on the performance of banks. Their results suggest that better mechanism of corporate governance is necessary for each bank and focuses on the interests of investors and shareholders [Kashiri and Yazdani, 2013, p. 1].
Shavvalpour and Ashari (2013), investigated the effect of the credit risk of banks on their profitability; the results show a significant negative relationship between credit risk and profitability of banks. Mentioned relationship can be explained in a way that with the increase in credit risk, the cost of banks is increased, thus their profitability is reduced. The results of this study show that in order for the banking system to increase profitability, managers must control their credit risk management [Shavvalpour and Ash'ari, 2013, p. 246].
The theoretical framework of research
In this paper, according to the literature, the following research model is considered to investigate the relationship between credit risk and financial performance of banks:
TATit=α + β1DRRit+ β2CLARit+ β3 CARit+ β4
BRit+ β5LRit+ β2SIZEit+ β7 LOANit+ εit
PMit= α + β1 DRRit + β2 CLARit + β3CARit +
β4BRit+ β5 LRit+ β6 SIZEit+ β7 LOANit+ εit TAT: Total asset turnover
PM: Profit margin
DPR: doubtful receivables ratio CLAR: cost per loan advanced ratios CAR: capital adequacy ratios BR: bonds ratio
LR: Loans ratio Size
Loan
Variables in the model are as follows:
Doubtful receivables ratio- doubtful receivables ratio is of common criteria used for the assessment of credit risk and is obtained by dividing doubtful receivables
ratio to total loans [Kurawa & Garba, 2014, p.109].
cost per loan advanced ratios - Based on the existing standards when banks’ assets belongs to the doubtful receivables, it not only can not apply the accrued profits of receivables in its earnings, but is required to put a part of its current income aside to cover losses due to incomplete receipt of their receivables as reserves for doubtful receivables. The ratio is obtained by dividing doubtful receivables to total loans [Kurawa & Garba, 2014, p.109].
Total assets turnover- The performance of assets is related to the company's ability in producing and selling products and services associated with the use of assets. To evaluate the company's performance, the asset turnover ratio to total assets is used to calculate the proportion of sales. [Ismail, 2010, p. 6].
Profit margin – profit margin is obtained through the management of the firm’s performances. I.e. how the company has well managed its operations and the result is the highest operating profit margin. The Profit is obtained from the difference between sales and costs. So the more properly the company reduces its costs, the more is the operational performance which is achieved through the ratio of net profit to sales. [Ismaili, 2010, p. 4].
definition, the capital adequacy ratio is obtained by dividing the total capital base to risk weighted assets [Asgari and Moradian, 2013, p. 11].
Bonds ratio to total assets - The purpose of the issuance of central bank participation in the development of open market operations and the conduct of monetary policy is in terms of liquidity management. Its ratio is calculated by dividing the total bonds held by banks to total bank assets [Shavvalpour and Ashari, 2013, p. 236].
Loans ratio to total assets – the ratio of loans to bank’s assets is a part of bank’s liquidity. This means that to what extent the amount of bank’s assets have the ability to be converted to cash, and how much is the bank’s ability to get these assets. It is calculated by dividing the total loans to total bank assets [Shavvalpour and Ashari, 2013, p. 236].
Bank’s size- In this study, the variables of the natural logarithm of the book value of assets comes to [Mollanazar, optical and Qashqai, 2012, p. 160].
Total granted loans- granting loans in the Islamic banking system are divided into four main groups of money lending, Contribution, trades, and obligations. According to the law of interest free banking (usury free banking) each of the above items are applied in one or more parts pf economic activities. [Askar Zadeh, 2006, p.3] So the total granted loans are obtained through the total of hire purchase, installment sales, civil partnership, limited partnership, forward contract, reward, debt and Qarz- Al- hasaneh [Husseini and Souri, 2007, p. 145].
Hire purchase+ installment sales+ civil partnership+ limited partnership+ forward contract+ reward+ debt + Qarz- Al- hasaneh
Research hypothesis
According to the model presented in this article, the following hypotheses are proposed:
The first hypothesis: Doubtful receivables have a significant relationship with total assets turnover. The second hypothesis: cost per loan advanced have a significant relationship with total assets turn over.
The third hypothesis: Doubtful receivables of banks have a significant relationship with total assets turn over.
The fourth hypothesis: cost per loan advanced have a significant relationship with total assets turn over.
In testing these hypotheses, control variables of total assets and profitable margin acted as indicators used to measure performance.
Method of investigation
In terms of purposes, the present article is applied and in terms of implementation, it is descriptive. The timeframe in this study for a period of 8 years is started from 2007 until the end of 2014. The study also listed the top ten banks in the capital market of the country - particularly in Tehran Stock Exchange – as the population; based on this, the required data are extracted and classified from the reports of Stock Exchange (Bank Eqtesad Novin, Ansar, Parsian, Pasargad, Tejarat, Sina, Saderat Iran, Kar Afarin, Mellat, and Post Bank of Iran). The sample used in this study include the banks whose fiscal year ended at the end of March (Persian year). Provided that their fiscal year is not changed during the period under consideration. In addition, banks that have been chosen, had the following conditions:
- The banks whose symbols has not been closed for more than three consecutive months during the fiscal year.
- The information required to calculate the variables in the case of banks, should be available during the period of investigation.
- Banks that have not concluded a deal for more than three months on the stock have been excluded from the study.
According to the above conditions and due to the small population of the study, the whole population has been chosen as the sample of the study. The data needed to calculate the variables related to the stock market have been extracted using stock software (Rahavard Novin) from
Information and Trading System stock. After appropriate classification and initial processing on the data and performing calculations using Excel software, the output data were used to run the model and test hypotheses by Eviews 7 software.
Findings of the research
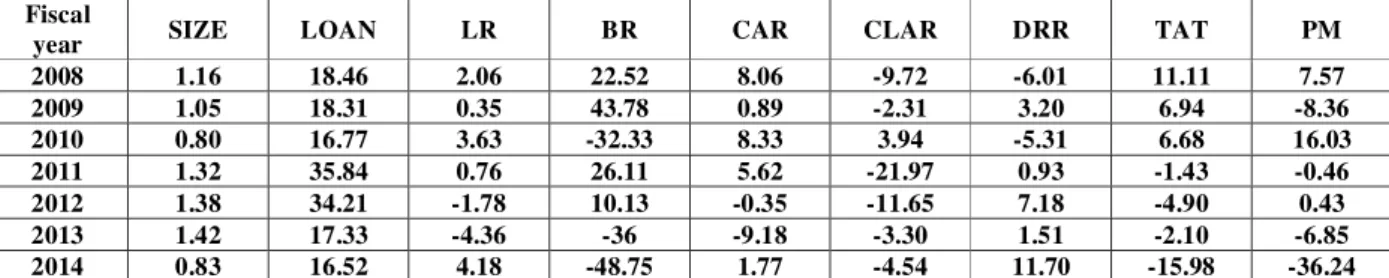
Trends in the study are shown in variables before estimating the models of the relationship between credit risk and banks' performance. Table 1 indicates the results of these changes in the form of a time-series table in the study variables.
Table 1. annual percentage changes of research’s variables
Fiscal
year SIZE LOAN LR BR CAR CLAR DRR TAT PM
2008 1.16 18.46 2.06 22.52 8.06 -9.72 -6.01 11.11 7.57 2009 1.05 18.31 0.35 43.78 0.89 -2.31 3.20 6.94 -8.36 2010 0.80 16.77 3.63 -32.33 8.33 3.94 -5.31 6.68 16.03 2011 1.32 35.84 0.76 26.11 5.62 -21.97 0.93 -1.43 -0.46 2012 1.38 34.21 -1.78 10.13 -0.35 -11.65 7.18 -4.90 0.43 2013 1.42 17.33 -4.36 -36 -9.18 -3.30 1.51 -2.10 -6.85 2014 0.83 16.52 4.18 -48.75 1.77 -4.54 11.70 -15.98 -36.24
Since before the implementation of regression models, the existence some situations must be ensured, it is necessary to do some tests on variables. The tests and the results of estimating the models are included in the following.
- To verify the normal distribution of residuals in the first and second model, Jarque and Bera test was used. In this test, the null hypothesis is based on the normality, if less than 5% is confirmed the possibility of the null hypothesis is rejected with 95% confidence. Jarque and Bera test results are indicated in the Chart (1) and (2). This test is done by software Eviwes7.
0 1 2 3 4 5 6 7 8 9
-0.015 -0.010 -0.005 0.000 0.005 0. 010
Series: Standardized Residuals Sample 1386 1393
Observations 77 Mean -6.08e-19 Median 9.01e-06 Maximum 0.013547 Minimum -0.018006 Std. Dev. 0.006645 Skewness -0.122966 Kurtosis 2.812682 Jarque-Bera 0.306622 Probability 0.857863
Chart 1. Normality of residuals (the first model)
0 1 2 3 4 5 6 7 8 9
-0.10 -0.05 -0.00 0.05 0.10
Series: Standardized Residuals Sample 1386 1393
Observations 75
Mean 4.81e-18
Median -0.004139
Maximum 0.120361
Minimum -0.096859
Std. Dev. 0.046760
Skewness 0.536654
Kurtosis 3.328910
Jarque-Bera 3.938039 Probability 0.139594
The probability value obtained for the Jarque and Bera test, equals to 0.8578 for the first model and for the second model equals to 0.1395. As a result, it can be seen that the distribution of errors in the first and the second model is normal.
Also, linearity us a position which indicates that an independent variable is a linear function of other independent variables. The high linearity in the regression equation means that there is a high correlation between the independent variables and despite the high R2, the model may not have a high validity. In other words, though the model looks good but has no significant independent variables. High R2 is the most obvious symptom to detect the presence of linearity. If none of the regression coefficients are statistically significant or the correlation between the two variables is larger than the square root of R2, non-linearity will be proved. In this paper the investigation of these two factors showed that there is no linearity between variables; because in the first model, the square root of R2 is 0.8879 and the square root of R2 in the second model is 0.7628, which is greater than the statistics and it show that there is no linearity.
- Static panel data is used in this paper, in order to test the hypothesis. In this method, we must first examin whether pooled regression model is better or fixed effects model; this is conducted with the Chow test (F Limer). If the Pooled model was preferred, we are done. But if the fixed effects model was preferred, it should be tested against the random effects model so that the appropriate model is selected for estimation; this is done by Hausman test. In order to provide better and more comprehensive view toward the estimation results, the results are summarized and presented in the form of tables. In the following, we will describe the result of the investigation and tables obtained by Eviews software version 7.
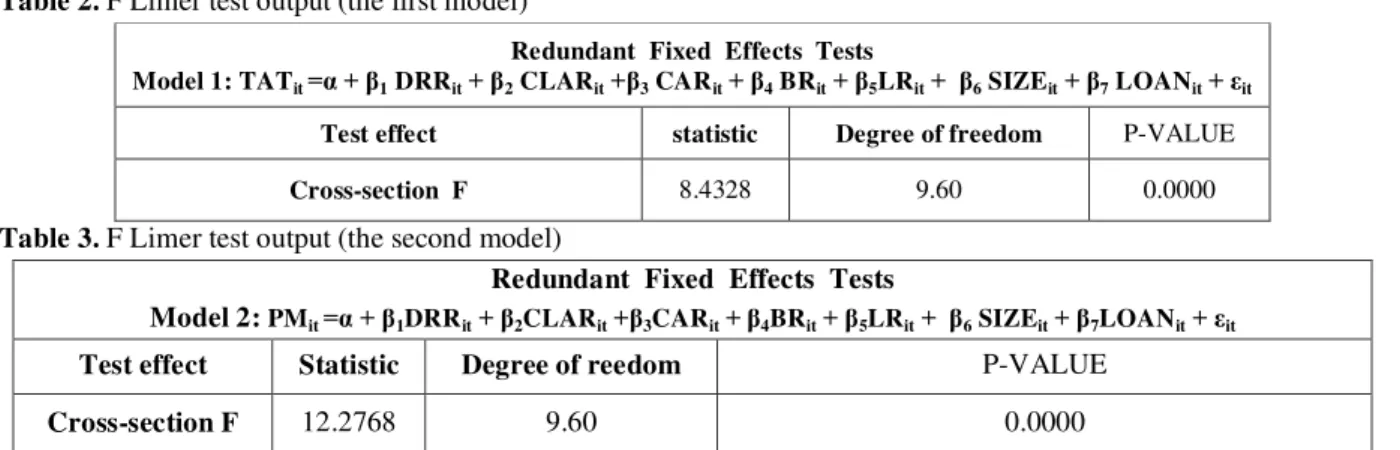
Chow test - To test the hypothesis, the fixed effects- time model will be estimated. Then Chow test is used in order to determine whether the width pf origins are statistically different or not. Chow test results related to the research hypotheses are presented in the following tables:
Table 2. F Limer test output (the first model)
Redundant Fixed Effects Tests
Model 1: TATit =α + β1 DRRit+ β2 CLARit+β3 CARit+ β4 BRit+ β5LRit+ β6 SIZEit+ β7 LOANit+ εit
Test effect statistic Degree of freedom P-VALUE
Cross-section F 8.4328 9.60 0.0000
Table 3. F Limer test output (the second model)
Redundant Fixed Effects Tests
Model 2: PMit =α + β1DRRit+ β2CLARit+β3CARit+ β4BRit+ β5LRit+ β6 SIZEit+ β7LOANit+ εit
Test effect Statistic Degree of reedom P-VALUE
Cross-section F 12.2768 9.60 0.0000
As it is observed, according to the P-value in both models the null hypothesis on the equality of the width of the sources is rejected and the heterogeneity of the data is confirmed. So, at this stage fixed effects model or the combined data is selected as the preferred model. This means that all the data should be put together and using a classical regression, the parameters should be estimated.
Hausman test - given that the Chow test results are based on the fixed effects model, the fixed effects model should be tested against random effects model. To do so, the Hausman test is used. The results of Hausman test are presented in the following tables:
Table 4. Hausman test output (the first model)
Correlated Random Effects – Hausman Test
Test effects Statistic Degree of freedom P-VALUE
Cross-section random 29.1378 7 0.0000
Table 5. Hausman test output (the second model)
Correlated Random Effects – Hausman Test
Model 1: PMit =α + β1DRRit+ β2CLARit+β3CARit+ β4BRit+ β5LRit+ β6 SIZEit+ β7LOANit+ εit
Test effect Statistic Degree of freedom P-VALUE
Cross-section random 27.82288 7 0.0002
As it is observed, P-Value obtained for both models is less than 0.05. As a result, the null hypothesis stating that there is no correlation between individual effects and the explanatory variables is rejected so to estimate the models, the fixed effects method is used.
- The estimation of models is conducted according to the results of test Chow and Hausman tests, based on the dependent variable and through the method of Panel IEGLS. Then, the final result of model estimation is examined according to the best fit in Tables (10) and (11).
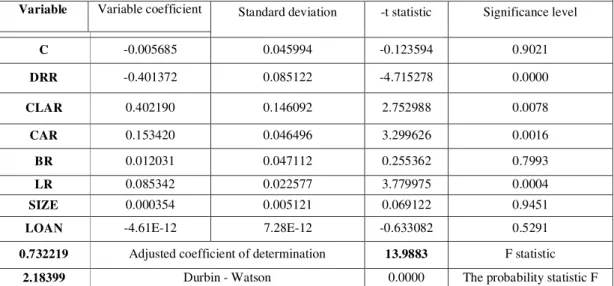
Table 6. Initial test results of the first model
The dependent variable of total assets turnover 8-year period from 2007 to 2014 Total Views: 77
Variable Variable coefficient Standard deviation -t statistic Significance level
C -0.005685 0.045994 -0.123594 0.9021
DRR -0.401372 0.085122 -4.715278 0.0000
CLAR 0.402190 0.146092 2.752988 0.0078
CAR 0.153420 0.046496 3.299626 0.0016
BR 0.012031 0.047112 0.255362 0.7993
LR 0.085342 0.022577 3.779975 0.0004
SIZE 0.000354 0.005121 0.069122 0.9451
LOAN -4.61E-12 7.28E-12 -0.633082 0.5291
0.732219 Adjusted coefficient of determination 13.9883 F statistic
2.18399 Durbin - Watson 0.0000 The probability statistic F
In order to have a better fit, the model of ineffective variables is excluded from the model so that different results might be obtained.
Table 7. Final test results of the first model
The dependent variable of total assets turnover 8-year period from 2007 to 2014
Total Views: 77
Variable Variable coefficient
Standard deviation -t statistic Significance level
C 0.002796 0.009635 0.290201 0.7726
CLAR 0.477372 0.127743 3.736983 0.0004
CAR 0.141241 0.041268 3.422513 0.0011
LR 0.075797 0.017378 4.361568 0.0000
0.790819 Adjusted coefficient of determination
18.32114 F statistic
2.087952 Durbin – Watson 0.0000 The probability statistic F
Due to the fact that by eliminating variables, the answers of hypotheses cannot be changed; Hence in the interpretation of the first and second hypotheses and based on the best fit of the first model, also according to statistic P-value and F, the first model is approved by 99%. The Durbin-Watson value 2.087952 showed no correlation between errors. Also, according to the coefficient of determination, the variables used in the model, describe a total of 0.79 percent of the behavior of the dependent variable. According to the best fit of the first model, two hypotheses are interpretable:
First hypothesis: Doubtful receivables have a significant relationship with total assets turnover.
Given that the significant level of Doubtful receivables ratio variable is 0.0000 and this number is smaller than 5%, the 95% confidence level there is a relationship between Doubtful receivables and total assets turnover and first hypothesis is confirmed. Due to the negative coefficient for this variable, the relationship is reversed.
The second hypothesis: cost per loan advanced have a significant relationship with total assets turn over. Given that the significant level of cost per loan advanced ratio variable is 0.0004 and this number is smaller than 5%, the 95% confidence level there is a relationship between costs per loan advanced and total asset turnover and the second hypothesis is confirmed. Due to the positive coefficient for this variable, the relationship is direct.
Table 8. Initial test results of the second model
The dependent variable of profit margin 8-year period from 2007 to 2014
Total Views: 77
Variable Variable
coefficient Standard deviation -t statistic Significance level
C 1.171967 0.475957 2.462338 0.0167
DRR -4.038428 0.890718 -4.533904 0.0000
CLAR -5.083167 1.630511 -3.117529 0.0028
CAR 1.444364 0.441577 3.270918 0.0018
BR 0.185686 0.459625 0.403994 0.6877
LR 0.513660 0.235733 2.178993 0.0333
SIZE -0.129219 0.052528 -2.459983 0.0168
LOAN 1.08E-10 8.54E-11 1.268500 0.2095
0.907730 Adjusted coefficient of determination 47.7291 F statistic
1.90094 Durbin – Watson 0.0000 The probability statistic F
Table 9. Final test results of the second model
The dependent variable of profit margin 8-year period from 2007 to 2014
Total Views: 77
Variable Variable
coefficient Standard deviation -t statistic Significance level
C 0.803886 0.307763 2.612029 0.0113
DRR -4.270575 0.866724 -4.927259 0.0000
CLAR -5.798844 1.538411 -3.769373 0.0004
CAR 1.440117 0.424669 3.391148 0.0012
LR 0.634854 0.203478 3.120009 0.0027
SIZE -0.088214 0.035254 -2.502259 0.0150
0.915529 Adjusted coefficient of determination 47.99850 F statistic
1.90488 Durbin – Watson 0.0000 The probability statistic F
Due to the fact that by eliminating variables, the answers of hypotheses cannot be changed; Hence in the interpretation of the third and the fourth hypotheses and based on the best fit of the second model, also according to statistic P-value and F, the model is approved by 99%. The Durbin-Watson value 1.90488 showed no correlation between errors. Also, according to the coefficient of determination, the variables used in the model, describe a total of 0.91 percent of the behavior of the dependent variable. According to the best fit of the second model, two hypotheses are interpretable:
The third hypothesis: Doubtful receivables of banks have a significant relationship with total assets turn over.
Given that the significant level of Doubtful receivables ratio variable is 0.0000 and this number is smaller than 5%, the 95% confidence level there is a relationship between Doubtful receivables and profit margin and the third hypothesis is confirmed. Due to the negative coefficient for this variable, the relationship is inverse. The fourth hypothesis: cost per loan advanced has a significant relationship with total assets turn over. Given that the significant level of cost per loan advanced ratio variable is 0.0004 and this number is smaller than 5%, the 95%
confidence level there is a relationship between costs per loan advanced and profit margin and the fourth hypothesis is confirmed. Due to the negative coefficient for this variable, the relationship is inverse.
DISCUSSIONS AND RECOMMENDATIONS
The article investigates the relationship between credit risk and the performance of banks in Tehran Stock Exchange. The results showed that there is a significant negative relationship between the ratio of doubtful receivables in the banks and total assets turnover. Hence the results of these hypotheses are consistent with the results of Panahian and Abyak (2013).
be evaluated as well. When considering the possibility of granting facilities and the relevant conditions, it is necessary that banks are regulated by the conditions of pricing and non-pricing (egg documentation, contracts, probation, etc.), the highest possible risks and the expected effectiveness and efficiency.
The results also indicate that there is a significant positive relationship between costs per loan advanced and totals assets turnover and there is a significant negative relationship between the variable and profit margin; therefore, the second hypothesis and the fourth hypotheses are accepted. Hence the second hypothesis’ search results are not in line with results of Panahian and Abyak (2013). The results of Kasmido (2008) also confirms the relationship between these variables, but claims that this is a negative relationship While Kurawa & Garba (2014) confirm the positive relationship like that of our study. Also the results of the fourth hypothesis are consistent with the results of Panahian and Abyak (2013). The results of Kurawa & Garba (2014) confirm the relationship between these variables but claims that this relationship is positive while Kasmido (2008) confirms the negative relationship like that of our study.
With these interpretations, it can be said that if the costs per loan is increased, the total assets turnover is increased as well and profit margin is reduced. So managers are recommended to adopt a policy that does not store a lot of maintenance i.e. the return of granted loans should be ensured. Because Absence of proper management system for costs per loan has made the banks be faced with a lot of challenges. This means that a high percentage of the granted loans are faced with the problem of return and its major cause is the lack of scrutiny at the time of granting loans to customers. Therefore, banks should have information systems and independent analysis on methods for evaluating and measuring the credit risk management in all activities which are up and down the line of balance sheet. So that the results
of this review will report directly to the board and senior managers.
Comparing the results of the research with the conducted researches in Iran, confirmed the results of this study which were consistent with the research of Shavvalpour et al (2013). They also investigated the profitability of credit risk with other variables of profitability therefore the results are not comparable separately but in general there is an inverse relationship between credit risk and profitability. The results of the researches conducted abroad are consistent with our results namely; research results Sanochang (2010) and Elena Beccalli (2002) and Chiu and Chen (2009). The difference is that in these studies researchers have used DEA and SFA methods to estimate the efficiency of branches. According to our results and with regard to the fact that the credit risk is the most important type of risks in the banking system and one of the most important factors affecting the profitability and performance of banks, the banking system’s administrators need to improve their performance and profitability, control and monitor credit risks. In this context, credit risk’s strategies should be considered for the Banks and the goals of credit quality, earnings and growth and any bank regardless of its size should operate in order to obtain profitably and therefore, in the cost of its investments, consider risks or rewards for the activities. Each bank’s board should approve the bank's policy about the risks and maximize the profitability. The board should periodically review the bank's financial situation and the need to determine the change in strategy. The board also must sufficiency identifies capitals to cover risks incurred.
REFERENCES
2. Asgari, Mohammad Reza and Moradian, Hajar. (2013). "Banking & Insurance: evaluating the performance of new and traditional private banks." News ID: 29 960, 29-1.
3. Askar Zadeh, Gholam Reza. (2006). "Modeling to determine optimal combination of credit facilities portfolio in financial and credit institutions". Journal of Research Center of Imam Sadiq PBUH, research, education and awareness journal, No. 23, 19-1.
4. Chiu, Y.H., Chen, Y.C. (2009). “The analysis of Taiwanese bank efficiency: Incorporating both external environment risk and internal risk”. Economic Modelling. 26, Pages 456 -463.
5. Cooper, M., Jackson W. & Patterson G. (2003). Evidence of predictability in the cross-section of bank stock returns. Journal of
Banking and Finance, 27: 214-245.
6. Esmaeili, Mohammad Bagher. (2010). "Analysis of the performance and determination of industry group of banks and financial institutions using the results of the 2010 ranking of the top companies of Iran (IMI-100)". Consulting the Industrial Management Institute, 141.
7. Fredriksson. A, Moro. A. (2014). “Bank– SMEs relationships and banks’ riskadjusted profitability”,Journal of Banking & Finance,Volume 41, April 2014,Pages 67–77 8. Gholipour, Abbas. (2010). "Factors Affecting
improve the performance of banks". Journal of banks and the economy, Issue 106, 24.
9. Goudarzi, Atoosa. and Fallahati, Manijheh. (2006). "The impact of the banking market on credit risk". Department of Planning and Economic Affairs Bureau of Economic Research.
10.Hosseini, Sayed Shams Aldin , Souri, Amir Reza. (2007). "Estimation of Iranian banks and factors affecting its performance". Economy Research, Volume 7, Number 2, 155-127. 11.Kashiri, G. and Yazdeni, M. (2013). "The
relationship between corporate governance and performance of banks and financial institutions
in the Tehran Stock Exchange". The first national conference of monetary management and banking. http://www.civilica.com/Paper-MBMCONF01-MBMCONF01_112.htm 12.Khosh Sima, Reza and Shahiki Tash,
Mohammad Nabi. (2012). "The impact of credit risks, operational and liquidity on the banking system's efficiency". Journal of Year 17, Number 4, 95-69
13.Kurawa, J.M.& Garba , S. (2014). “An Evaluation of the Effect of Credit Risk Management (CRM)on the Profitability of Nigerian Banks”. Journal of Modern Accounting and Auditing, ISSN 1548-6583,Vol. 10, No. 1, Pages 104-115.
14.Mollanazar, Mahnaz, Nouri Fard, Yadollah, and Qashqai Abdi, Shaqayeq. (2012). "The different effects of company size and industry type on profitability". Financial Accounting and Auditing Journal, Volume 4, Issue 16, 182-157.
15.Panahian, Hussein, Abyak Hassan. (2013). "Exploring the effects of risk on the performance of banks using the method of calculating the efficiency of DEA ". Accounting and Auditing Research, Volume: 4, Issue: 17, 85 -68.
16.Qalami, Reza. (2011). "The key factors affecting the risk of default by Iranian banks." Master's thesis Azad University, North Tehran Branch.
17.Shavvalpour, Said and Ashari, Elham. (2013). "The effect of credit risk profitability on Iranian banks". Financial Research, Volume 15, Issue 2, 229-246.
18.Tehrani, Reza. (2010). “Financial Management ". Negah Danesh, VII, third.