45
SOME ASPECTS CONCERNING SOVEREIGN DEBT AND THE RELATIVITY OF INDEBTEDNESS INDICATORS
Liviu Deceanu1, Gheorghe Ciobanu1 1
Department of Economics, Faculty of Economics and Business Administration, “Babeş
-Bolyai” University, Cluj-Napoca, Romania
[email protected], [email protected] [email protected]
Abstract: For quite a while, the economic world was concerned more and more about sovereign debt. Taking a brief look at economic history, we see that we are not dealing with anything new. Episodes in which states have entered into default occurred, even centuries ago. Moments like the one where Edward III refused to pay the debt to Italian bankers, the Mexican default of August 1982 or the Argentine one back in 2001, aiming at nearly 100 billion dollars, are well known. The current discussion about sovereign debt started with the so-called sovereign debt crisis, which has in the foreground the problem of the Greek state. In 2010 it became acute, Greece being unable to honor its external obligations. It took a strong intervention, supported internationally mainly by the European Union (and also the IMF), but the situation is not resolved even today. This crisis, which we would put on the account of the governance inconsistency and errors, starting with the unprepared entry in the European Union and hasty adoption of th e Euro, and continuing with the serious fiscal disorder in the economy, put in difficulty even the single European currency and the economic and monetary union.
Shortly after the start of the Greek crisis, which had as a "catalyst" the violent and pro-cyclical reaction of rating agencies, we found that the problem is much deeper, some other countries (the so-called "PIIGS", for example) being affected by massive
indebtedness. In this context, the construction of indicators, of alert thresholds and “early
warning” mechanisms is an important gain for policy-makers, as well as for the various economic operators.
The study of sovereign debt can take many forms; on one hand, using data covering a long period, we may create models containing key indicators: sovereign debt, GDP, inflation, foreign trade, economic growth. Assumptions about the relationship between variables and their testing will be done as a second phase. On the other hand, the analysis may be very relevant by just highlighting the important elements of the recent sovereign debt dynamics, often ignored, both by specialists and governments. It is what we propose in this short study, along with a more nuanced definition of sovereign debt sustainability.
Keywords: sovereign debt, default, ratios, indebtedness threshold, economic policies.
JEL classification: F3, F34, G01.
1. Introductory remarks
When we analyse sovereign debt, we have to point out, from the beginning, that a state differs from any other economic actor.
Therefore, we must always look at sovereign debt taking into account several aspects: • The specific reasons for which a State becomes a debtor;
• The factors influencing the behavior of a state as a debtor;
• The possibility for a country to enter into default regarding sovereign debt.
46
In the case of countries, the situation is different. Often, the goal of indebtedness has nothing to do with investment, with technology transfer, and is linked to the need for financing social policies or operating costs. In some cases, states even borrow in order to repay their current debt or to service it – especially paying interests (Garello, Spassova, 2011). The lack of investments, or their inefficiency, undoubtedly represent an obstacle to economic growth; in the absence of a real GDP growth, often state control over debt premises are severely affected.
We will not say here that all the investments and actions taken by the state are wrong. Some governmental decisions can hep economic activity, and foster a good climate for economic development; in this case, sovereign debt can be seen as a growth tool, the use of which being recommended. It is quite logical that large investments, whose effects and profitability are displayed over several years, should be funded by debt. We admit that some of them, such as infrastructure, are of real national interest, and, as they will also serve future generations, it is normal that descendants help to pay for them.
But there are significant differences when talking about today’s public consumption, or about the cost of social policies. Using debt in this situation turns out to be completely unhealthy. Also, in addition to covering operating expenses or major projects, sovereign debt can meet the needs of foreign trade. In this context, we must say that using debt in order to finance an efficient international trade can lead to some positive effects.
A state differs from a company due to the fact that it has an important feature called sovereignty. In some situations, a state can increase taxation, can operate fiscal changes, can modufy the legal environment, or even print money. These levers obviously can not be used by private actors. Also, often the state is favored relative to private agents in the context of a loan, this privilege meaning, first of all, a lower interest rate. Often, when a country accumulates debt, people are tempted to say that its creditors are not at risk. Government bonds have been perceived as risk-free assets for a log period of time (Landau, 2012). However, sovereign risk has occurred and is present, more than ever, in the global economy. Often, the default is recorded long before a state drains its resources (Reinhart, Rogoff, 2009). Basically, it is the result of an analysis carried out by political factors, which choose the alternative which is favorable. Economic interconnections make unlikely sovereign debt repudiation in the contemporary world, countries desiring to maintain good quality economic and diplomatic relations. A good economic analyst must, however, make a proper distinction between the concepts of “willingness to pay” and “ability, capacity to pay”. In this context, we mention another relatively rare concept, that of "odious debt", which refers to the "right" of a government to refuse paying a debt inherited from another one, corrupt and of bad faith. Of course, the concept is relatively controversial, the odious nature of debt being difficult to prove; however, a certain influence on the payment behavior of states is present.
2. Recent developments concerning sovereign debt
If we focus on the current situation, we notice rapidly that the contemporary indebtedness situation of various countries has its origins in the economic policies pursued for decades, since the second half of the twentieth century. In the developed countries especially, sovereign debt reaches very high levels today, levels that worry both analysts and policy makers (Pettis, 2015). We can also notice that the developed countries became excessively indebted, taking advantage of the low interest rates available. Of course, we will not say here that indebtedness is synonymous with a total lack of responsibility from the government, but we believe that not only economic theory recommending state intervention in order to stimulate growth was behind the decisions. Several authors speak about political, electoral connotations of indebtedness (Garello, Spassova, 2011).
47
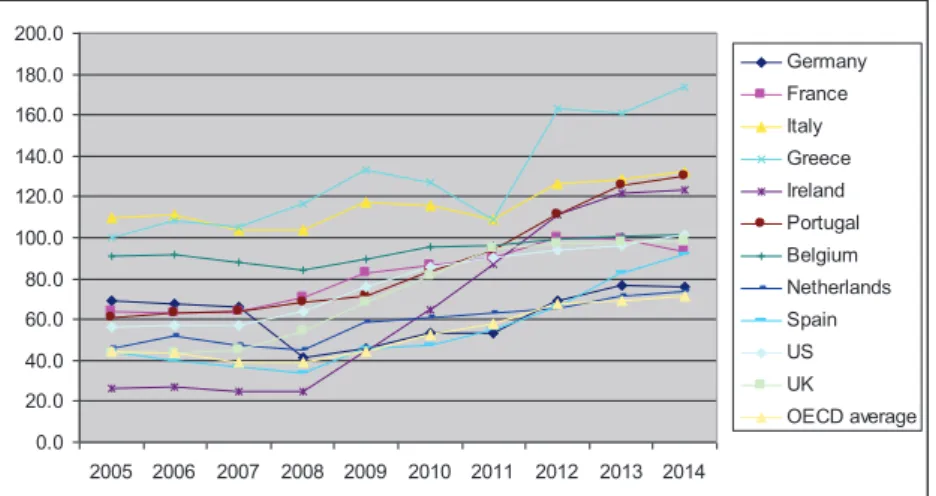
the beginning of the crisis, supporting demand involved significant budgetary measures, in most countries of the world; the developed countries were the leaders in this regard. These measures had side effects, affecting the budget balance; in the same time, fiscal revenues dropped. The sovereign debt burden became higher and higher, especially for developed countries, as shown in the figures below:
Figure 1: Sovereign Debt to GDP evolution (%, selected developed states) Source: Author’s calculations, using data from World Bank, www.tradingeconomics.com
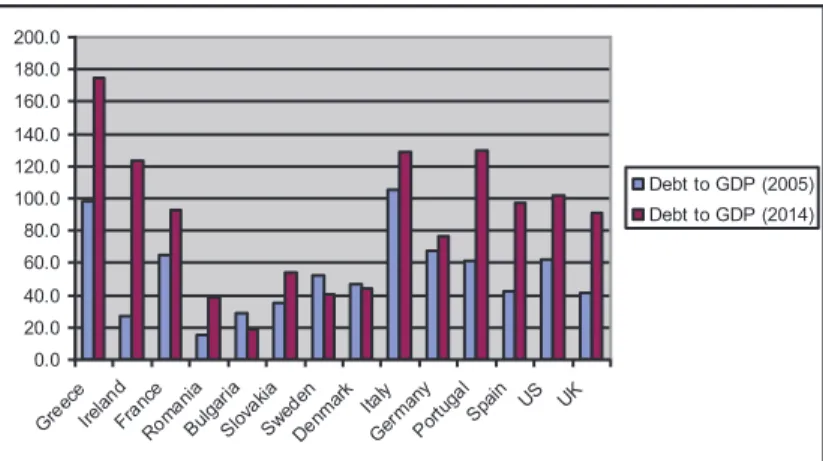
Figure 2: Sovereign Debt to GDP evolution (%, selected emerging states) Source: Author’s calculations, using data from World Bank, www.tradingeconomics.com
It is also evident that in the period preceding the global crisis, developed countries have experienced high levels of indebtedness. On the other hand, we notice a slight decrease in the share of sovereign debt in GDP in the years preceding the crisis, but this positive evolution was stopped by the explosion of debt after 2008, in the context of recovery policies. The various commitments taken at European level, for example (the Stability and Growth Pact, the Maastricht Treaty) have largely lost consistency.
For developed countries, the average of the sovereign debt / GDP indicator is currently around 100%, many countries exceeding this threshold; emerging countries present a
0.0 20.0 40.0 60.0 80.0 100.0 120.0 140.0 160.0 180.0 200.0
2005 2006 2007 2008 2009 2010 2011 2012 2013 2014
Germany France Italy Greece Ireland Portugal Belgium
Netherlands Spain US UK
OECD average
0.0 20.0 40.0 60.0 80.0 100.0 120.0
2005 2006 2007 2008 2009 2010 2011 2012 2013 2014
China
Russia UAE
Brazil India
South Korea Taiwan
Vietnam Venezuela
Mexico Turkey
48
value well below 100%. In the EU, the average of 87% recorded in 2014 is maintained – 86.6% Debt to GDP in the first months of 2015.
3. Some remarks concerning sovereign debt sustainability
It is obvious that the sovereign debt had in recent years a general growing trend. We consider this evolution as worrying, but we also think, and we said this many times, that debt sustainability is essential. The issue of sovereign debt sustainability is complex; as underlined in some studies (Landau, 2012) most often analysts are seeking a categorical answer to the question of sustainability – the debt is sustainable or not. In reality, things are much more complicated, and even influenced by political factors Often, debt indicators, like for example Total Debt/GDP, Exports/Total Debt, Reserves/Imports, and many others are used to determine thresholds of indebtedness, above which the default becomes imminent. This practice is useful, but presents some disadvantages. Countries behave very differently, and a given level of debt that can be perfectly sustainable in a country is totally unsustainable in another one. Economic history has recorded instances where a state having a sovereign debt / GDP ratio of 200% or even more continued to repay its debt, while others went into default at 40-50%. Therefore, relative to sovereign debt sustainability, we make several remarks:
ble varies from borrower to borrower, from country to country;
economic policies implemented by governments; for example, a state that encourages exports and international trade in general will increase its chances to repay smoothly, especially if indebted in foreign currency, which is per se a problem (Kedia, Moumdar, 2001); a country that will operate major investments, the effect of which involves generating a consistent income, can ensure a climate extremely favorable to sustainability;
-to-GDP, Debt-to-Exports, or state revenues, and others);
s and the financial markets; in this context, we should highlight the problems of pro -cyclicality of rating, and also the inefficiency of markets and herd behavior, more and more common in financial markets (Trenca, Pece, Mihuţ, 2015);
significant and stable economic growth is always in a good position to service its debt;
illiquidity, and assess the self fullfilling solvency traps (Roubini, 2001).
4. The relativity of indebtedness indicators
A short recent economic literature review allows us to begin with a remark: the relativity of indicators and thresholds regarding sovereign debt is clearly highlighted by the constant contradictions between the various authors on the subject. We will come back to that later. What we want to emphasize is primarily that there are significant differences in behavior between states, between governments.
49
entered default several times. We can give many examples of countries that have entered default in the past without touching the current indebtedness thresholds (60% or 90%); even Mexico, in the 80s, was below 50%:
Table 1:Sovereign Debt ratios before default (some examples)
State Year of crisis Debt/GNP (%)
Russia 1998 59
Argentina 2001 51
Venezuela 1982 42
Bulgaria 1990 57
Turkey 1978 21
Source: World Bank
Therefore, a threshold of indebtedness is a volatile concept – which is undoubtedly influenced by many factors, among which we mention here:
h international markets; for example, at some point, a new government may consider the previous debt as "odious" (in some cases, sovereign and political risk are combined);
dynamics of exports);
-cyclical);
For emerging markets, Reinhart and Rogoff speak even of a danger of default somewhere around 30-35%. Of course, we agree that developing countries encounter difficulties in comparison with developed countries when it comes to sovereign debt. But, given the current debt burden of developed states, we consider that sovereign risk affects them, too. It is therefore difficult to predict the behavior of governments, as shown in the chart below, which captures completely different approaches to sovereign debt management:
Figure 3: Sovereign Debt to GDP evolution (2005 versus 2014, selected states) Source: Author’s calculations, using data from World Bank, www.tradingeconomics.com
Different countries show different trends relative to sovereign debt issues;iIf countries like Greece, Ireland, France, Romania, Italy, Portugal, Spain, USA, UK and many others have experienced significant increase in the sovereign debt / GDP ratio, some other governments have managed to achieve an outstanding performance, lowering the debt/GDP ratio, even in the context of crisis. For example, Bulgaria has gone from 28.7%
0.0 20.0 40.0 60.0 80.0 100.0 120.0 140.0 160.0 180.0 200.0 Gre ece Irela nd Fran ce Rom ania Bul garia Slova
kia Sw eden Den mar k Italy Ger man y Por tuga l Spa
in US UK
50
in 2005 to 18.8% in 2014, while Sweden has reduced the Debt to GDP ratio from 52.1% to 40.6% in the same period of time. A similar approach had in the last decade the Danish State; it is very surprising, because we are dealing with countries that have, traditionally, an extremely developed social policy.
Another interesting example, at least at the first sight, is Japan. If we decide to orient ourselves only by using the classic sovereign debt / GDP ratio, we find an alarming evolution of Japanese debt, as shown in the chart below:
Figure 4: Sovereign Debt to GDP evolution, Japan (2005-2014)
Source: Author’s calculations, using data from World Bank, www.tradingeconomics.com
Compared to the GDP, Japanese debt exceeds 220%, a level more than twice higher than the average of OECD countries. Also, its sovereign debt evolution in the last decade is marked by a significant tendency to increase. According to the classical indicators of sovereign risk, the default seems imminent. However, even despite a modest rate of economic growth, the Japanese government continued to borrow at relatively low interest rates.
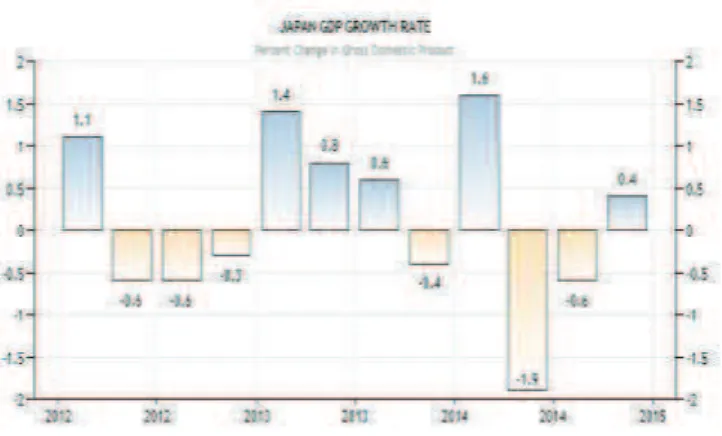
Providing explanations to the Japanese situation is not a simple endeavor. In order to address such a problem, we need a much broader framework, but a few ideas can be mentioned in this context:
the stage of international trade;
residents, unlike the situation in European countries, for example (Brender, Pisani, Gagna, 2013);
foreign exchange and gold); these assets are, in the case of the asian stat e, more significant that American and European ones;
Some of the ideas mentioned above are captured in the following figures:
20 20
20 20
20 20
20 20
20 20 0.00
51
Figure 5: GDP growth rate and export evolution, Japan Source: Cabinet office, Japan, www.tradingeconomics.com
Figure 6: Exports evolution, Japan
Source: Cabinet office, Japan, www.tradingeconomics.com
Figure 7: Japan foreign exchange reserves evolution, 2006-2014 Source: Cabinet office, Japan, www.tradingeconomics.com
5. In conclusion
52
Economic literature has tried lately to provide practical solutions, to identify thresholds of indebtedness beyond which the default becomes imminent. These efforts were only partially successful, rather being feasible to analyze the consequences of debt on economic activity. Even in the case of this type of approaches, the relativity of conclusions and thresholds / indicators is obvious, and this is underlined by the numerous contradictions and corrections that appeared and were made over time. The famous 2010 study conducted by Reinhart and Rogoff showed the world that there is not a significant relationship between debt and inflation; however, regarding the link between sovereign debt and economic growth, the conclusion was clear: for countries where Sovereign Debt to GDP ratio exceeds 90%, the average economic growth slows sharply.
In a first phase, the article had a considerable impact, the threshold of 90% being increasingly discussed in political circles – the OECD, and even the EU, have integrated this value in economic policy objectives.
However, in recent years, the conclusions drawn by Reinhart and Rogoff were contradicted several times:
some studies identify even a reverse link between debt and growth (Checherita, Rother, 2010);
an extensive and in-depth analysis made by other specialists (Minea, Parent, 2012) identifies a new threshold (Debt to GDP = 115%), above which the negative debt -growth link changes sign; in addition to a number of complex nonlinearities, Minea and Parent determined, surprisingly, that if below 115% (Debt/GDP ratio value) an increasing governmental debt harms GDP growth, over this value the effect is opposite; the conclusion of the study is, however, less radical – they find that increasing public debt is detrimental to economic growth;
Other economists (Herndon, Ash, Pollin, 2014) did a remake of the Reinhart & Rogoff analysis and found serious methodological errors, the results themselves being flawed – for example, during the period considered by R&R, the states with Debt to GDP of over 90% had a real annual growth of 2.2%, and not -0.1% The authors also find that the relationship Between Debt and GDP growth varies significantly from state to state and period to period, and believe that the threshold of 90% is not relevant at all.
The fact that debt indicators are relative does not mean that the efforts to determine them, or the effects of indebtedness, are futile. What we want to emphasize here is that research efforts should rather aim at discussing trends, causes, effects, remedies, instead of setting ambitious fixed alert thresholds.
The reality shows that solutions to prevent over-indebtedness or getting out of this situation can be identified only through complex analysis, based on the entire system of financial and economic indicators, as the limits (thresholds) are highly mobile (and relative) from a country (or stage) to another, and from one organization to another.
6. Acknowledgements
This work was co-financed from the European Social Fund through Sectoral Operational Programme Human Resources Development 2007-2013, project number POSDRU/159/1.5/S/134197 „Performance and excellence in doctoral and postdoctoral research in Romanian economics science domain”.
References
Abbas, A., Belhocine, N., El Ganainy, A. & Horton, M. (2010) A Historical Public Debt Database, IMF Working paper 10/245, november.
Brender, A., Pisani, F., Gagna, E. (2013) La crise des dettes souveraines, Editions La Découverte, ISBN: 978-2-7071-7764-3, Paris.
53
Herdnon, T., Ash, M. & Pollin, R. (2014) Does high public debt consistently stifle economic growth? A critique of Reihart and Rogoff, Cambridge Journal of Economics, 2014, 38, 257-279.
Kedia, S., Mozumdar, A. (2001) Foreign currency denominated debt: an empirical examination, Journal of Business.
Landau, J.P. (2012) Quelle politique pour la dette souveraine ?, Banque de France (Dette publique, politique monétaire et stabilité financière), Revue de la stabilité financière, nr. 16, april.
Minea, A. & Parent, A. (2012) Is High Public Debt Always Harmful to Economic Growth ? Reinhart and Rogoff and some complex nonlinearities, CERDI Clermont-Ferrand, Etudes et documents, February.
Reinhart, C. & Rogoff, K. (2009) This time is different. Eight Centuries of Financial Folly, Princeton Universitu Press, ISBN: 978-0-691-14216-6, Princeton, New Jersey.
Reinhart, C. & Rogoff, K. (2010) Growth in a Time of Debt, NBER Working Paper 15639, Cambridge, January.
Roubini, N. (2001) Debt sustainability: How to Assess whether a Coutry is insolvent, New York, Stern School of Business.
Pettis, M. (2015) When do we decide that Europe must restructure much of its debt, february 25 (www.blogmpettis.com)