Article
Prolonged Tp-e Interval, Tp-e/QT Ratio and Tp-e/QTc
Ratio in Patients with Type 2 Diabetes Mellitus
Alptug Tokatli1, Fethi Kiliçaslan2, Metin Alis3, Omer Yiginer4, Mehmet Uzun4
1
Department of Cardiology, Golcuk Military Hospital, Kocaeli; 2
Cardiology Clinic, Medipol University Medicine Faculty; 3Department of Endocrinology, American Hospital; 4Department of Cardiology, GATA Haydarpasa Hospital, Medipol
University, Istanbul, Turkey
Background: Type 2 diabetes mellitus (T2DM) is associated with increased risk of malignant ventricular arrhythmias. Cardiac electrical inhomogeneity may be the leading cause of the increased arrhythmic risk in patients with T2DM. The peak and the end of the T wave (Tp-e) interval and associated Tp-e/QT ratio are promising measures of ventricular repolarization indicating trans-mural dispersion of repolarization. The aim of this study was to assess ventricular repolarization in patients with T2DM by using Tp-e interval, Tp-e/QT ratio and Tp-e/corrected QT interval (QTc) ratio.
Methods: Forty-three patients with T2DM and 43 healthy control subjects, matched by gender and age, were studied. All partici-pants underwent electrocardiography (ECG) recording. PR, RR and QT intervals represents the ECG intervals. These are not ab-breviations. In all literature these ECG intervals are written like in this text. Tp-e intervals were measured from 12-lead ECG. Rate QTc was calculated by using the Bazett’s formula. Tp-e/QT ratio and Tp-e/QTc ratio were also calculated.
Results: Mean Tp-e interval was significantly prolonged in patients with T2DM compared to controls (79.4±10.3, 66.4±8.1 ms, respectively; P<0.001). We also found significantly higher values of Tp-e/QT ratio and Tp-e/QTc ratio in patients with diabetes than controls (0.21±0.03, 0.17±0.02 and 0.19±0.02, 0.16±0.02, respectively; P<0.001). There was no difference in terms of the other ECG parameters between the groups.
Conclusion: Tp-e interval, Tp-e/QT ratio and Tp-e/QTc ratio were prolonged in patients with T2DM. We concluded that T2DM leads to augmentation of transmural dispersion of repolarization suggesting increased risk for ventricular arrhythmogenesis.
Keywords: Diabetes mellitus; Tp-e interval; Tp-e/QT ratio; Tp-e/QTc ratio
INTRODUCTION
Diabetes mellitus (DM) is a chronic disease that affects cardio-vascular system by oxidative stress, endothelial dysfunction, atherogenesis, and vascular remodelling [1]. Cardiac autonom-ic neuropathy is an important complautonom-ication of DM and affects 30% of the patients with DM [2]. Impaired autonomic
regula-tion in patient with DM results from increased sympathetic au-tonomic nervous system activity and is associated with malign ventricular arrhythmias and death independently of the pres-ence of coronary heart disease, hypertension and heart failure [3,4]. Diabetic heart shows remodelling of the ionic currents and prolonged action potential durations. Experimental animal models showed that increased dispersion of repolarization and
Received: 13 July 2015, Revised: 10 September 2015, Accepted: 4 November 2015 Corresponding author: Alptug Tokatli
Department of Cardiology, Golcuk Military Hospital, Golcuk 41910, Kocaeli, Turkey
Tel: +90-262-426-0271, Fax: +90-262-414-1111, E-mail: [email protected]
Copyright © 2016 Korean Endocrine Society
electrical instability leading ventricular arrhythmias and sud-den cardiac death (SCD) [5,6].
Myocardial repolarization can be assessed with QT interval (QT), corrected QT interval (QTc), QT dispersion and transmu-ral dispersion of repolarization (TDR). Although QT interval and QT dispersion measurements have been demonstrated to be an important electrocardiographic predictor of ventricular arrhythmogenesis in DM, their prognostic importance has also been challenging at some of the studies [7]. Peak and the end of the T wave (Tp-e), which is the interval between the peak and the end of T wave on electrocardiography (ECG), is ac-cepted as an index of transmural dispersion of ventricular repo-larization [8]. Tp-e/QT and Tp-e/QTc ratios are also used as an electrocardiographic index of ventricular arrhythmogenesis [9]. Although there are a lot of studies evaluating ventricular re-polarization by using QT interval and QT dispersion in patients with type 2 diabetes mellitus (T2DM), there is no study inves-tigating the effects of T2DM on the indexes of TDR. In this study, we aimed to assess ventricular repolarization in patients with T2DM by using the Tp-e interval, Tp-e/QT ratio, and Tp-e/QTc ratio in comparison with the control group.
METHODS
Study population
The study population consisted of 86 patients who were admit-ted to our outpatient clinic. Forty-three patients diagnosed with T2DM (20 women; mean age, 59±9) constituted the study group. T2DM was defined according to the American Diabetes Association criteria [10]. Forty-three age and sex matched healthy individuals were recruited as the control group (18 women; mean age, 50±10). Patients with a history of coronary artery disease, valvular heart disease, prior pacemaker implanta-tion, history of atrial fibrillaimplanta-tion, cardiomyopathy, cancer, or other major illnesses were excluded. Patients with abnormal thyroid function test, abnormal electrolyte values and on antiar-rhythmic drug treatment were also excluded. The study protocol was approved by the Ethics Committee at GATA Haydarpasa Hospitaland informed consent was obtained from each patient. All participants were questioned about their medical history and smoking habits. Weight and height measurements were performed and body mass index (BMI) was calculated as the ratio of weight to height squared (kg/m2
). Blood pressure was measured consecutively three times, 5 minutes apart in the sit-ting position and the mean value was used in the analysis. Blood sample was collected after 12 hours overnight fast.
Biochemical analyses of fasting blood glucose, lipids, urea, creatinine, hemoglobin A1c (HbA1c) were performed. Urinary albumin concentration was measured by radioimmunoassay method in a 24-hour urine collection. Albumin excretion rate <30 mg/day was considered as normoalbuminuria, values in
the range of 30 to 299 mg/day as microalbuminuria and ≥300 mg/day as proteinuria. Diabetic complications were identified by self report.
All subjects were underwent two-dimensional echocardiog-raphy examination. We obtained standard parasternal long-axis, midventricular short-axis, apical long axis, apical 2- and 4-chamber images with the Vivid 3 ultrasound system (GE Healthcare, Little Chalfont, UK).
Electrocardiography
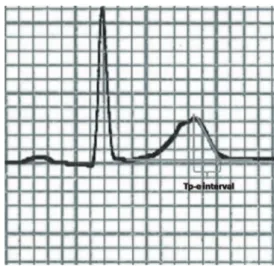
The 12-lead ECG recordings were obtained at the supine posi-tion with a paper speed of 50 mm/sec and voltage of 10 mm/ mV by using standard ECG system (CardiofaxV model 9320, Nihon Kohden, Tokyo, Japan). P wave duration, RR interval, PR interval, QRS duration, QT interval, and Tp-e interval were measured manually. Tp-e/QT ratio and Tp-e/QTc ratio were calculated from these measurements. The onset of P wave was defined as first visible upward departure from the baseline and the end of P wave defined as return to baseline. QT interval was defined as the time from the onset of the QRS to the point at which T wave returns to baseline. QTc interval was calculated by using the Bazett’s formula. Tp-e interval was measured from the peak of T wave to the end of T wave. The end of the T wave was defined as intersection of tangent to the down slope of T wave and isoelectric line (Fig. 1). When the U wave is present
T wave end was defined as the nadir between the T wave and U wave. Measurements of the Tp-e interval was performed in leads V2 and V5. The mean value of the measurements was used in the analysis. All measurements were performed by two independent investigators. Investigators were blinded as to the clinical status of the subjects. Intraobserver and interobserver coefficients of variation (SD of differences between two obser-vations divided by the mean value and expressed as percent) were found to be 1.2% and 2.3% respectively.
Statistical analysis
The required sample size was calculated to be 40 with 95% confidence interval and 80% power of study. Continuous vari-ables are expressed as mean±standard deviation. Categorical variables were expressed as percentages. Student t test and the chi-square test were used for comparisons of continuous and categorical variables. Pearson correlation test was used to ex-amine correlation between variables. A P<0.05 was considered significant. Statistical analysis was performed using a commer-cially available statistical package SPSS version 20.0 (IBM Co., Armonk, NY, USA).
RESULTS
Our study sample involved 43 patients with T2DM and 43
healthy control subjects. The case and control groups were simi-lar in terms of gender and age. Mean duration of DM was 12±9 years. Among 43 patients who had T2DM, 23 patients (53.5%) had retinopathy, 12 patients (28%) had microalbuminuria. Met-formin (30 patients, 69.8%) and sulfonylurea (28 patients, 65.1%) were the most frequently used drugs. A total of eight tients (18.6%) had been using thiazolidinedione and three pa-tients (7%) had stated insulin use. Forty-three healthy subjects were used as the control group. The baseline characteristics of the study and the control groups are presented in the Table 1. The study group had a higher mean BMI than control group with no statistically significant difference (27.8±4.1 kg/m2
vs. 26.3±4.2 kg/m2
, P=0.103). Regarding blood pressure the study group had an average mean systolic blood pressure of 132.1±21.7 mm Hg and a mean diastolic blood pressure of 78.5±11.9 mm Hg; the control group had an average mean systolic blood pressure of 124.6±16.1 mm Hg and a mean dia-stolic blood pressure of 74.2±12.3 mm Hg, respectively. No statistically significant differences were observed.
The study group had an average glucose value of 123.7± 41.5 mg/dL, an average HbA1c value of 7%±1.2%, an aver-age total cholesterol value of 185.8±32.5 mg/dL, an average low density lipoprotein cholesterol value of 113.2±32.8 mg/dl, an average high density lipoprotein cholesterol value of 44.8± 8.7 mg/dL, an average triglycerides value of 135.8±65.7 mg/
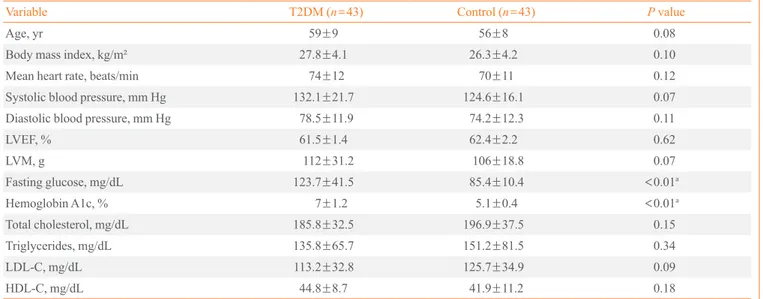
Table 1. Clinical Characteristics of the Study Population
Variable T2DM (n=43) Control (n=43) P value
Age, yr 59±9 56±8 0.08
Body mass index, kg/m² 27.8±4.1 26.3±4.2 0.10
Mean heart rate, beats/min 74±12 70±11 0.12
Systolic blood pressure, mm Hg 132.1±21.7 124.6±16.1 0.07
Diastolic blood pressure, mm Hg 78.5±11.9 74.2±12.3 0.11
LVEF, % 61.5±1.4 62.4±2.2 0.62
LVM, g 112±31.2 106±18.8 0.07
Fasting glucose, mg/dL 123.7±41.5 85.4±10.4 <0.01a
Hemoglobin A1c, % 7±1.2 5.1±0.4 <0.01a
Total cholesterol, mg/dL 185.8±32.5 196.9±37.5 0.15
Triglycerides, mg/dL 135.8±65.7 151.2±81.5 0.34
LDL-C, mg/dL 113.2±32.8 125.7±34.9 0.09
HDL-C, mg/dL 44.8±8.7 41.9±11.2 0.18
Values are expressed as mean±SD.
T2DM, type 2 diabetes mellitus; LVEF, left ventricular ejection fraction; LVM, left ventricular mass; LDL-C, low density lipoprotein cholesterol; HDL-C, high density lipoprotein cholesterol.
dL, an average creatinine value of 1.04±0.23 mg/dL. The av-erage values of glucose and HbA1c were increased, but the
other parameters were normal. All controls had normal bio-chemical parameters.
The average heart rate for the study group and the control group was 74±12 and 70±11 beats per minute, respectively (P=0.117). Baseline RR and intervals were not significantly different between the groups. The mean QT interval was higher in the study group compared with controls, but no significant difference was found (376.4±30.1, 376.1±24.1 ms, respec-tively; P=0.959).The results showed that QTc was higher in diabetics than in controls but there was no statistically signifi-cant difference between the groups (419.1±25.1, 409.5±21 ms, respectively; P=0.06) (Table 2). Left ventricular mass and left ventricular ejection fraction were not significantly different between the groups.
Table 2. Electrocardiographic Measurements of the Groups
Variable T2DM (n=43) Control (n=43) P value
Tp-e, ms 79.4±10.3 66.4±8.1 <0.001a
Tp-e/QT 0.21±0.03 0.17±0.02 <0.001a
Tp-e/QTc 0.19±0.02 0.16±0.02 <0.001a
QT, ms 376.4±30.1 376.1±24.1 0.959
QTc, ms 419.1±25.1 409.5±21 0.06
Values are expressed as mean±SD.
T2DM, type 2 diabetes mellitus; Tp-e, peak and the end of the T wave; QTc, corrected QT interval.
a
P<0.01 vs. healthy controls.
HbA1c
Tp-e
P<0.001
r=0.53 10.0
9.0
8.0
7.0
6.0
5.0
4.0
50 60 70 80 90 100
HbA1c
Tp-e/QT
P<0.001
r=0.57 10.0
9.0
8.0
7.0
6.0
5.0
4.0
0.10 0.15 0.20 0.25 0.30
HbA1c
Tp-e/QTc
P<0.001
r=0.52 10.0
9.0
8.0
7.0
6.0
5.0
4.0
0.12 0.15 0.17 0.20 0.22
A B C
Fig. 2. Correlation between hemoglobin A1c (HbA1c) and (A) peak and the end of the T wave (Tp-e) interval, (B) Tp-e/QT ratio, and (C) Tp-e/corrected QT interval (QTc) ratio.
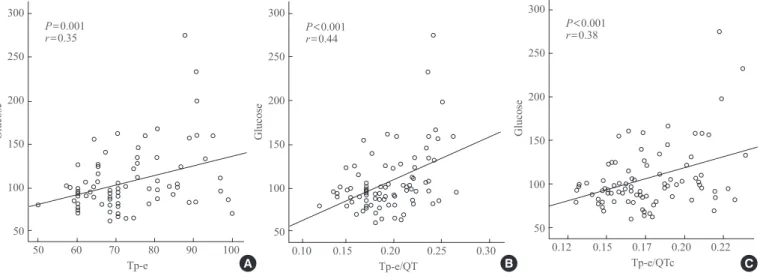
Fig. 3. Correlation between glucose level and (A) peak and the end of the T wave (Tp-e) interval, (B) Tp-e/QT ratio, and (C) Tp-e/cor-rected QT interval (QTc) ratio.
Glucose
Tp-e
P=0.001
r=0.35 300
250
200
150
100
50
50 60 70 80 90 100 A
Glucose
Tp-e/QT
P<0.001
r=0.44 300
250
200
150
100
50
0.10 0.15 0.20 0.25 0.30 B
Glucose
Tp-e/QTc
P<0.001
r=0.38 300
250
200
150
100
50
Table 2 shows the results of Tp-e, Tp-e/QT ratio, and Tp-e/ QTc ratio in the study and the control groups. The mean Tp-e in-terval was significantly prolonged in the study group compared to the controls (79.4±10.3, 66.4±8.1 msn, respectively; P<0.001). Comparing the mean Tp-e/QT ratio, the results showed that dia-betic patients had a prolonged Tp-e/QT ratio (0.21±0.03, 0.17± 0.02, respectively; P<0.001). Tp-e/QTc ratio was also signifi-cantly higher in the study group compared to the control group (0.19±0.02, 0.16±0.02, respectively; P<0.001).
There was a significant positive correlation between the HbA1c level and Tp-e interval (r=0.53, P<0.001), Tp-e/QT ra-tio (r=0.57, P<0.001), and Tp-e/QTc ratio (r=0.52, P<0.001) (Fig. 2). There was also a positive correlation between the serum glucose level and Tp-e interval (r=0.35, P=0.001), Tp-e/QT ra-tio (r=0.44, P<0.001), and Tp-e/QTc ratio (r=0.38, P<0.001) (Fig. 3). There were no significant correlation between gender, age, BMI, blood pressure with Tp-e interval, Tp-e/QT ratio, and Tp-e/QTc ratio.
DISCUSSION
The major new findings of this study are that TDR indices of Tp-e interval, Tp-e/QT, and Tp-e/QTc ratios are increased in patients with T2DM. Moreover, we found a positive correlation between HbA1c level and glucose level with Tp-e interval, Tp-e/QT ratio, and Tp-e/QTc ratio.
Tp-e interval and Tp-e/QT ratio are well appreciated mark-ers of increased dispmark-ersion of ventricular repolarization [8,9]. Our findings of increased Tp-e interval, Tp-e/QT ratio, and Tp-e/QTc ratio in T2DM is important and the results may illu-minate the pathophysiological mechanisms of increased preva-lence of ventricular arrhythmias by indicating increased ven-tricular repolarization heterogeneity.
Inhomogeneity in the duration of cardiac action potential causes the electrical instability leading arrhythmias. This situa-tion can be demonstrated in the electrophysiology laboratory via monophasic action potential mapping [11]. QT duration (QTd) is the most frequently used non-invasive method to re-veal electrical heterogeneity of the myocardium. In order to quantify the inhomogenity of the myocardium, in addition to QTd, TDR was introduced in the beginning of the 2000’s [12]. Isolated cells from different layers of the myocardium exhibit-ed that myocardium comprises 3 distinct myocyte types name-ly, endocardial, epicardial, and midmyocardial M cells [9]. De-spite the fact that these myocytes are morphologically similar, they exhibit different electrophysiological characteristics.
Mid-myocardial M cells have typically the longest action potential duration. The earliest completion of repolarization occurs in the epicardial cells. The peak of T wave represents the end of the epicardial action potential, and the end of T wave repre-sents the end of the midmyocardial action potential. Therefore, Tp-e interval is a reflection of TDR [12]. Sicouri and Antzelev-itch [13] reported an association between ventricular arrhyth-mogenesis and Tp-e prolongation in animal model. It was shown that prolongation of Tp-e interval is associated with in-creased mortality in Brugada syndrome, long QT syndromes, in hypertrophic cardiomyopathy, obstructive sleep apnea and in patients undergoing primary percutaneous coronary interven-tion for myocardial infarcinterven-tion [14-17]. Addiinterven-tionally, Tasolar et al. [18] have shown that the TDR decreases as the collateral circulation increases in stable coronary artery disease. Our un-derstanding from this findings is that cardiac ischemia resulting from the coronary artery disease is also one of the factors aug-menting TDR. The patients with T2DM may also have occult coronary artery disease. Silent cardiac ischemia in diabetic pa-tients may be responsible for prolonged Tp-e interval.
Furthermore, when myocardium is exposed to the conditions prolonging repolarization phase such as drugs or bradycardia, action potential duration of the M cells is more prolonged than the other cell types. Thereby these conditions does not only cause to prolongation of QT interval but also to increased TDR. It has been previously shown in diabetic animal models that hyperglycemia alters ionic currents of the sarcolemma leading to action potential prolongation [19]. This shows that hypergly-cemia has direct effects on ventricular repolarization phase. Electrophysiological properties of ventricular myocardium is directly affected by diabetes. Prolongation of action potential may alter the endocardial to epicardial repolarization produc-ing Tp-e interval changes on ECG. Diabetic age of our study population (12±9 years) was also enough to develop hypergly-cemic complications. Therefore QT interval prolongation may be the result of the hyperglycemia independently of the pres-ence of cardiovascular disease or hypertension. In our study, it seems that due to their more sensitivity, action potential dura-tion of the M cells are more increased than epicardial cells. This situation may be the reason of the increased TDR in dia-betic group.
Determi-nants of SCD risk in T2DM include, presence of coronary ar-tery disease, impaired left ventricular function and abnormali-ties of electrical propagation reflected in ECG as repolarization abnormalities. Atherosclerosis Risk in Communities (ARIC) study showed that the presence of diabetes was associated with a 2.6-fold increase in SCD [24]. Thus our results may explain the increased SCD risk by showing that dispersion of ventricu-lar repoventricu-larization is increased in T2DM.
Cardiac autonomic neuropathy is an another concern in T2DM. Diabetic autonomic neuropathy is related with in-creased sympathetic tone and dein-creased parasympathetic tone [25]. Alterations in cardiac autonomic activity in DM may be responsible for ventricular arrhythmias by increasing the het-erogeneity of ventricular repolarization. Watanabe et al. [26] reported that the prolonged TDR is associated with ventricular arrhythmias. It has been reported that increased sympathetic activity and altered cardiac autonomic activity are closely re-lated to heterogeneity of ventricular repolarization and in-creased risk of ventricular arrhythmias [27]. Voulgari et al. [28] showed that spatial QRS-T angle is increased in patients with T2DM who has cardiac autonomic neuropathy. Our results that showed the heterogeneity of ventricular repolarization in T2DM may be explicable in regard to altered autonomic activi-ty in DM.
Several investigators studied repolarization patterns in DM and they have reported controversial results. QT, QTc, and QT dispersion have been used in these studies. It was demonstrated that T2DM is associated with QT prolongation and other cardi-ac repolarization abnormalities [29,30]. Naas et al. [31] showed that both QT dispersion and maximal QTc interval were signif-icant predictors of cardiac death in patients with T2DM. Simi-larly, Sawicki et al. [32] demonstrated that increased QT dis-persion was an independent predictor of mortality in patients with DM. In a cohort study, patients with T2DM showed a high prevalence of prolonged QTc and QT dispersion but only pro-longed QTc was a predictor of mortality [33]. However, some investigators reported that QT and QTc intervals were not pro-longed in DM [22]. The measurement of QT parameters may be challenging for assessing predisposition to ventricular ar-rhythmias in DM. QT interval and its parameters have often been criticized as poor indicators of ventricular arrhythmogen-esis [34,35]. The studies reached different conclusions regard-ing the association between QT parameters prolongation and cardiac end points. Previous study has evaluated the Tp-e inter-val and other QT parameters in patients with diabetes [36]. However, there has been a debate on dynamic changes in Tp-e
interval like as QT interval so we measured also Tp-e/QT ratio and Tp-e/QTc ratio that is known to be relatively constant pa-rameters and incorporation of these indices may have improved the accuracy of our study. In our study, QT and QTc intervals were not different between the study and the control groups. However, we found that the other indices of ventricular repo-larization (namely Tp-e, Tp-e/QT ratio and Tp-e/QTc ratio) are increased in patients with T2DM. Increased Tp-e interval, Tp-e/QT ratio, and Tp-e/QTc ratio maybe related to alterations in neurohormonal balance that could predispose to ventricular arrhythmias. It is also possible that an increased ventricular re-polarization parameters of ECG is related with metabolic dis-turbances and some medications that may affect the ventricular repolarization. In the present study, increased Tp-e, Tp-e/QT ratio, and Tp-e/QTc ratio can be interpreted as reflecting in-creased risk of ventricular arrhythmias associated with altered ventricular repolarization.
Our study has some limitations. We did not evaluate the as-sociation between ventricular arrhythmias and Tp-e interval. Therefore, we are not sure about prognostic importance of Tp-e interval prolongation and higher Tp-e/QT ratio in our patients. However, Tp-e interval and Tp-e/QT ratio are accepted as im-portant prognostic markers in many different patient groups. Number of patients in our study is relatively small. A larger pa-tient population would provide more precise results.
In conclusion, T2DM patients, as compared to healthy con-trols, have shown prolonged Tp-e interval and increased Tp-e/ QT ratio and Tp-e/QTc ratio on the ECG which could be a marker of increased TDR and represents a risk for future ar-rhythmias. Prospective randomized studies in a larger popula-tion would provide more precise results and a response as to the predictive value of these ECG parameters in T2DM.
CONFLICTS OF INTEREST
No potential conflict of interest relevant to this article was re-ported.
ORCID
Alptug Tokatli http://orcid.org/0000-0003-0341-3962
REFERENCES
1. Fang ZY, Prins JB, Marwick TH. Diabetic cardiomyopathy:
En-docr Rev 2004;25:543-67.
2. Boulton AJ, Vinik AI, Arezzo JC, Bril V, Feldman EL,
Free-man R, et al. Diabetic neuropathies: a statement by the Amer-ican Diabetes Association. Diabetes Care 2005;28:956-62. 3. Vinik AI, Erbas T. Diabetic autonomic neuropathy. Handb
Clin Neurol 2013;117:279-94.
4. Verrier RL, Antzelevitch C. Autonomic aspects of
arrhyth-mogenesis: the enduring and the new. Curr Opin Cardiol 2004;19:2-11.
5. Magyar J, Rusznak Z, Szentesi P, Szucs G, Kovacs L.
Ac-tion potentials and potassium currents in rat ventricular muscle during experimental diabetes. J Mol Cell Cardiol 1992;24:841-53.
6. Shimoni Y, Firek L, Severson D, Giles W. Short-term
dia-betes alters K+ currents in rat ventricular myocytes. Circ Res 1994;74:620-8.
7. Zabel M, Klingenheben T, Franz MR, Hohnloser SH.
Assess-ment of QT dispersion for prediction of mortality or arrhyth-mic events after myocardial infarction: results of a prospec-tive, long-term follow-up study. Circulation 1998;97:2543-50. 8. Kors JA, Ritsema van Eck HJ, van Herpen G. The meaning
of the Tp-Te interval and its diagnostic value. J Electrocar-diol 2008;41:575-80.
9. Gupta P, Patel C, Patel H, Narayanaswamy S, Malhotra B,
Green JT, et al. T(p-e)/QT ratio as an index of arrhythmo-genesis. J Electrocardiol 2008;41:567-74.
10. American Diabetes Association. Diagnosis and classification
of diabetes mellitus. Diabetes Care 2011;34(Suppl 1):S62-9. 11. Statters DJ, Malik M, Ward DE, Camm AJ. QT dispersion:
problems of methodology and clinical significance. J Car-diovasc Electrophysiol 1994;5:672-85.
12. Antzelevitch C. T peak-Tend interval as an index of
transmu-ral dispersion of repolarization. Eur J Clin Invest 2001;31:555-7.
13. Sicouri S, Antzelevitch C. A subpopulation of cells with
unique electrophysiological properties in the deep subepicardi-um of the canine ventricle. The M cell. Circ Res 1991;68: 1729-41.
14. Topilski I, Rogowski O, Rosso R, Justo D, Copperman Y,
Glikson M, et al. The morphology of the QT interval pre-dicts torsade de pointes during acquired bradyarrhythmias. J Am Coll Cardiol 2007;49:320-8.
15. Shimizu M, Ino H, Okeie K, Yamaguchi M, Nagata M,
Hayashi K, et al. T-peak to T-end interval may be a better predictor of high-risk patients with hypertrophic cardiomy-opathy associated with a cardiac troponin I mutation than
QT dispersion. Clin Cardiol 2002;25:335-9.
16. Haarmark C, Hansen PR, Vedel-Larsen E, Pedersen SH,
Graff C, Andersen MP, et al. The prognostic value of the Tpeak-Tend interval in patients undergoing primary percu-taneous coronary intervention for ST-segment elevation myocardial infarction. J Electrocardiol 2009;42:555-60. 17. Kilicaslan F, Tokatli A, Ozdag F, Uzun M, Uz O, Isilak Z,
et al. Tp-e interval, Tp-e/QT ratio, and Tp-e/QTc ratio are prolonged in patients with moderate and severe obstructive sleep apnea. Pacing Clin Electrophysiol 2012;35:966-72. 18. Tasolar H, Ballı M, Cetin M, Otlu YO, Altun B, Bayramoglu
A. Effects of the coronary collateral circulation on the Tp-e interval and Tp-e/QT ratio in patients with stable coronary artery disease. Ann Noninvasive Electrocardiol 2015;20:53-61.
19. Nishiyama A, Ishii DN, Backx PH, Pulford BE, Birks BR,
Tamkun MM. Altered K(+) channel gene expression in dia-betic rat ventricle: isoform switching between Kv4.2 and Kv1.4. Am J Physiol Heart Circ Physiol 2001;281:H1800-7.
20. Barthel P, Bauer A, Muller A, Junk N, Huster KM, Ulm K,
et al. Reflex and tonic autonomic markers for risk stratifica-tion in patients with type 2 diabetes surviving acute myo-cardial infarction. Diabetes Care 2011;34:1833-7.
21. Panikkath R, Reinier K, Uy-Evanado A, Teodorescu C,
Hattenhauer J, Mariani R, et al. Prolonged Tpeak-to-tend interval on the resting ECG is associated with increased risk of sudden cardiac death. Circ Arrhythm Electrophysiol 2011;4:441-7.
22. Balkau B, Jouven X, Ducimetiere P, Eschwege E. Diabetes
as a risk factor for sudden death. Lancet 1999;354:1968-9. 23. Jouven X, Lemaitre RN, Rea TD, Sotoodehnia N, Empana
JP, Siscovick DS. Diabetes, glucose level, and risk of sud-den cardiac death. Eur Heart J 2005;26:2142-7.
24. Schroeder EB, Chambless LE, Liao D, Prineas RJ, Evans
GW, Rosamond WD, et al. Diabetes, glucose, insulin, and heart rate variability: the Atherosclerosis Risk in Communi-ties (ARIC) study. Diabetes Care 2005;28:668-74.
25. Acar E, Ural D, Bildirici U, Sahin T, Yılmaz I. Diabetic
cardiomyopathy. Anadolu Kardiyol Derg 2011;11:732-7. 26. Watanabe N, Kobayashi Y, Tanno K, Miyoshi F, Asano T,
Kawamura M, et al. Transmural dispersion of repolariza-tion and ventricular tachyarrhythmias. J Electrocardiol 2004;37:191-200.
27. Valensi PE, Johnson NB, Maison-Blanche P, Extramania F,
neu-ropathy on heart rate dependence of ventricular repolariza-tion in diabetic patients. Diabetes Care 2002;25:918-23. 28. Voulgari C, Moyssakis I, Perrea D, Kyriaki D, Katsilambros
N, Tentolouris N. The association between the spatial QRS-T angle with cardiac autonomic neuropathy in subjects with type 2 diabetes mellitus. Diabet Med 2010;27:1420-9. 29. Ewing DJ, Boland O, Neilson JM, Cho CG, Clarke BF.
Au-tonomic neuropathy, QT interval lengthening, and unex-pected deaths in male diabetic patients. Diabetologia 1991; 34:182-5.
30. Bellavere F, Ferri M, Guarini L, Bax G, Piccoli A, Cardone
C, et al. Prolonged QT period in diabetic autonomic neu-ropathy: a possible role in sudden cardiac death? Br Heart J 1988;59:379-83.
31. Naas AA, Davidson NC, Thompson C, Cummings F,
Ogs-ton SA, Jung RT, et al. QT and QTc dispersion are accurate predictors of cardiac death in newly diagnosed non-insulin dependent diabetes: cohort study. BMJ 1998;316:745-6.
32. Sawicki PT, Kiwitt S, Bender R, Berger M. The value of
QT interval dispersion for identification of total mortality risk in non-insulin-dependent diabetes mellitus. J Intern Med 1998;243:49-56.
33. Christensen PK, Gall MA, Major-Pedersen A, Sato A,
Ross-ing P, Breum L, et al. QTc interval length and QT dispersion as predictors of mortality in patients with non-insulin-de-pendent diabetes. Scand J Clin Lab Invest 2000;60:323-32. 34. Bravenboer B, Hendriksen PH, Oey LP, Gispen WH, van
Huffelen AC, Erkelens DW. Is the corrected QT interval a reliable indicator of the severity of diabetic autonomic neu-ropathy? Diabetes Care 1993;16:1249-53.
35. Sahu P, Lim PO, Rana BS, Struthers AD. QT dispersion in
medicine: electrophysiological holy grail or fool’s gold? QJM 2000;93:425-31.
36. Clemente D, Pereira T, Ribeiro S. Ventricular repolarization