Use among Malaysian Pharmacy Patrons: A National
Cross Sectional Study
Mohamed Azmi Hassali1, Abdul Haniff Mohamad Yahaya1, Asrul Akmal Shafie1, Fahad Saleem1,2*, Gin Nie Chua1, Hisham Aljadhey3
1Discipline of Social and Administrative Pharmacy, School of Pharmaceutical Sciences, Universiti Sains Malaysia, Pinang, Malaysia,2Department of Pharmacy, University of Balochistan, Quetta, Pakistan,3College of Pharmacy, King Saud University, Riyadh, Saudi Arabia
Abstract
Objective:The study aims to evaluate the predictors of non-prescription medicine purchasing patterns among pharmacy patrons in Malaysia.
Methods:A cross-sectional nationwide study was undertaken in 2011 in sixty randomly selected community pharmacies across 14 Malaysian states. A pharmacy exit survey was conducted over a 6-month period across Malaysia. A one-stage random cluster sampling technique was employed as there was no national sampling framework available for conducting this survey. Face-to-face interviews using a validated and pre-tested questionnaire were conducted by trained data collectors. The non-prescription medicine purchasing pattern was explored and analysed descriptively. Chi-square/Fisher exact test was used to determine the association between study variables. Multinomial logistic regression analysis was used to determine the predictors of type of non-prescription medicine purchased.
Results:A total of 2729 pharmacy patrons agreed to participate in 60 selected pharmacy outlets. A total of 3462 non-prescription medicine were purchased during the study period with an average of 1.3 medicines per participant. Most of the non-prescription medicine purchased was meant for alimentary tract and metabolism (31.8%), followed by respiratory system (19.4%) and musculoskeletal system (15.8%) usage. Factors found to be associated with the choice of non-prescription medicine purchased were age group [x2 = 170.75, (df = 57), p,0.01], locality [x2 = 48.16, (df = 19), p,0.01],
gender [x2 = 32.93, (df = 13), p = 0.002], ethnic group [x2 = 118.89, (df = 39), p,0.01] and type of occupation [x2 = 222.434,
(df = 117), p,0.01]. Non-prescription medicine purchased defined about 20% of the variance in the combination of predictors such as locality, gender, age, ethnicity, type of occupation and household income.
Conclusion:The predictors for selection of non-prescription medicine were locality (urban or rural), gender, age, ethnicity, type of occupation and household income per month. Future studies need to explore the safety and effectiveness of using these non-prescription medicines.
Citation:Hassali MA, Mohamad Yahaya AH, Shafie AA, Saleem F, Chua GN, et al. (2013) Patterns and Predictors of Non-Prescription Medicine Use among Malaysian Pharmacy Patrons: A National Cross Sectional Study. PLoS ONE 8(4): e59231. doi:10.1371/journal.pone.0059231
Editor:Claire Thorne, UCL Institute of Child Health, University College London, United Kingdom ReceivedSeptember 14, 2012;AcceptedFebruary 13, 2013;PublishedApril 3, 2013
Copyright:ß2013 Hassali et al. This is an open-access article distributed under the terms of the Creative Commons Attribution License, which permits unrestricted use, distribution, and reproduction in any medium, provided the original author and source are credited.
Funding:The study was funded by the Universiti Sains Malaysia through Universiti Research Grant (COMPACT Study 1). The funders had no role in study design, data collection and analysis, decision to publish, or preparation of the manuscript.
Competing Interests:The authors have declared that no competing interests exist. * E-mail: fahaduob@gmail.com
Introduction
In recent years, there has been an increasing trend for self-medication with non-prescription medicines (NPM). In parallel, more products have been deregulated for purchase without a prescription [1]. Population-based survey in developed countries such as Australia, Scotland, United Kingdom and other Asian countries like Taiwan and Singapore found that between a half and two-thirds of the population used NPM, including comple-mentary and over-the-counter medicines (OTC) [2–8].
A study in the United States found that the average profit margin from NPM sales ranged from 32–36% compared to only 25% profit from the sales of prescription medicines [9]. In Malaysia, the lack of dispensing rights might encourage
commu-nity pharmacists to focus on sales of NPM. Indeed, there was increase in Malaysian total healthcare expenditure on OTC medicine from Ringgit Malaysia (RM) 1.1 billion in 2001 to RM 1.5 billion in 2006 [10]. Unfortunately, the report focused more on sales of the product than the population’s utilization of NPM.
NPM utilized by the general public would provide baseline information on the self-medication status of the population.
In Malaysia, NPM encompasses pharmacist only medicines (POM), OTC medicines and traditional medicines. Pharmacist only medicines comprise of group C poisons under the Poison Schedule of Poison Act 1952, whereby they can only be sold by registered pharmacists in Malaysia [11]. Only community pharmacy outlets employing a registered pharmacist are eligible to sell such medicines. Over-the-counter and traditional medicines are sold by any retailer in Malaysia. Thus, the availability of NPM in community pharmacies and other retail outlets depends on their legal status. Within this context, NPM utilization by Malaysians should be evaluated in the community pharmacy setting to have a better insight of the purchasing pattern. Thus, the aim of this study is to evaluate the predictors of non-prescription medicine purchasing patterns among pharmacy patrons in Malaysia.
Methodology
Design
The study was designed as a nationwide, questionnaire based, cross-sectional survey targeting community pharmacy patrons across Malaysia. A pharmacy ‘‘exit survey’’ was developed and administered to consenting community pharmacy patrons of 60 randomly selected community pharmacies across 14 Malaysian states.
Sampling and Sample Size
The projected sample size of respondents needed was 2564 pharmacy patrons based on a 95% confidence interval and margin of error of 5% with an estimated 50% response rate [12]. The study used the simplified cluster sampling method, which allowed the random selection of 60 community pharmacy patrons in 10 clusters from 14 selected Malaysian states. This method is suitable for use by teams of data collectors who lack skills in sampling, and where comprehensive sampling frameworks are not available. The method does not randomly select the consumer, but instead requires the interviewer to follow a particular path through the community, sampling all community pharmacy consumers for 10 days. Hence, the selection of participants was based on conve-nience rather than being random. Although the method suffers some bias, its validity is good, and it has been widely used by teams of researchers to collect data for a wide range of health and social issues [13].
Data Collection Method
Undergraduate students from School of Pharmaceutical Sci-ences, Universiti Sains Malaysia were provided half a day training regarding data collection procedures. The training was conducted by the research team. The data collectors interviewed the community pharmacy patrons who agreed to participate upon exiting the pharmacy outlets. The study was conducted from March 2009 to September 2009. The questionnaires consisted of two parts: demographic data and information on NPM purchased. The names of NPM purchased were collected and categorized according to the anatomical therapeutic chemical (ATC) classifi-cation up to level two (main therapeutic group). The ATC system is used for the classification of drugs and is controlled by the World Health Organization (WHO). This pharmaceutical coding system divides drugs into different groups according to the organ or system on which they act and/or their therapeutic and chemical characteristics. Each bottom-level ATC code stands for a pharmaceutically used substance, or a combination of substances, in a single indication.
The data collection tool was validated by a group of reviewers consisting of two senior lecturers stationed as School of Pharma-ceutical Sciences, Universiti Sains Malaysia, two community pharmacists working in Penang Island and two pharmacists from Malaysian Ministry of Health. In addition, the data collection tool was also declared reliable as the alpha value was in acceptable ranges (0.75).
Data Analysis
In the descriptive analysis, the continuous variables were represented as means and standard deviation while the categorical variables were represented as frequency and percentages. Chi-square/Fischer Exact analysis was used to identify the demo-graphic factors associated with the type of NPM purchased. Multinomial logistic regression analysis was used to determine the predictors of type of non-prescription medicine purchased. The analysis was conducted by Predictive Analytics Software (PASW) v. 18. A p-value of less than 0.05 was considered as statistically significant.
Ethical Approval
Ethical approval for the conduct of this study was given by the Malaysian Institute of Public Health (NMRR-10-1028-7676). Written consent was taken from the pharmacy owners as well as community pharmacy patrons prior to data collection. In addition, the patrons were also informed about the research initiatives, confidentiality of their responses and their right to withdraw from the study.
Results
Sample Characteristics
A total of 3000 questionnaires were distributed to pharmacy patrons at selected pharmacy outlets. However, only 2800 questionnaires were returned, of which 2729 were utilized for the final analysis.
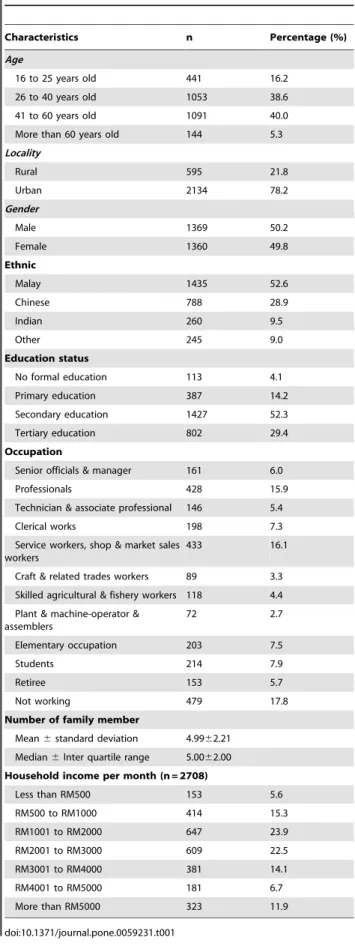
The mean age of the participants was 40.25 years (SD = 13.85). The proportion of male and female participants was similar. The percentage of urban participants was higher than that of rural participants. The demographic characteristics of the participants are summarized in Table 1.
Types of Non-prescription Medicine Purchased
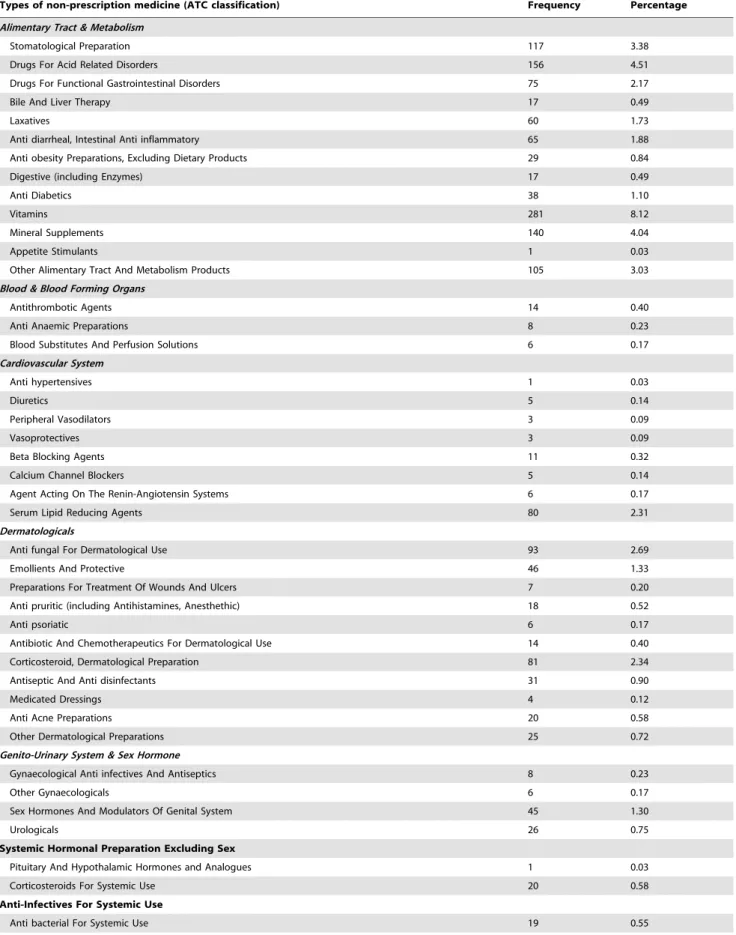
A total of 3462 NPM were purchased during the study period with mean being 1.27 (SD = 0.60) per participant. The types of NPM purchased are summarized in Table 2.
The most frequently purchased NPM based on level one (anatomical group) ATC classification were for the alimentary tract and metabolism (31.8%), followed by respiratory system (19.4%), and musculoskeletal system (15.8%). Of alimentary tract and metabolism medicines, vitamins (281/1101 = 25.5%), drugs for acid-related disorders (156/1101 = 14.2%), and mineral supplements (140/1101 = 12.7%) were among the most frequently purchased NPM. Of respiratory system medicines, antihistamines for systemic use (279/672 = 41.5%), cough and cold preparations (200/672 = 29.8%), and nasal preparations (131/672 = 19.5%) were the most frequently purchased medicines. Customers who purchased musculoskeletal system medicines mostly purchased anti-inflammatory and anti-rheumatic products (357/ 547 = 65.3%), topical products for joint paint and muscle pain (122/547 = 22.3%), and muscle relaxants (21/547 = 3.8%).
the most frequently purchased NPM. The most frequently purchased medicines were anti-inflammatory and anti-rheumatic products (10.3%), followed by analgesics (9.9%), vitamins (8.1%), antihistamines for systemic use (8.1%), cough and cold prepara-tions (5.8%), drugs for acid-related disorders (4.5%), and mineral supplements (4.0%).
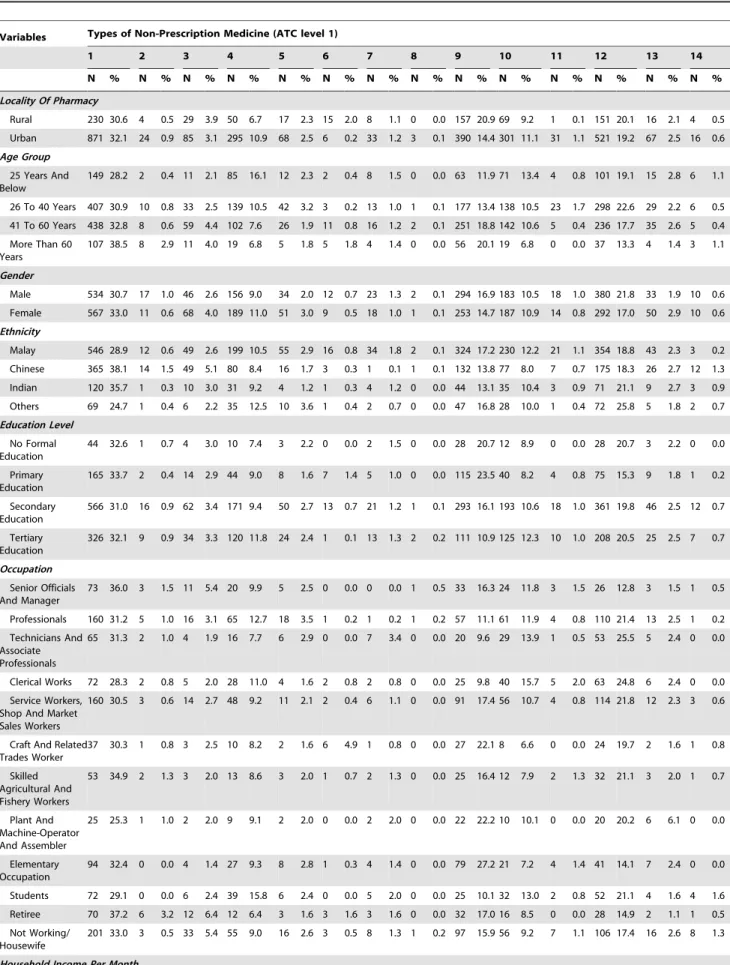
Pattern of Non-prescription Medicine Purchases
Table 3 summarizes the pattern of NPM purchases based on the demographic characteristics of the purchasers. There was a significant difference between types of medicine purchased by rural and urban residents [x2 (df = 13) = 69.35, p,0.01]. Rural customers purchased more cardiovascular system (3.9% vs. 3.1%) and musculoskeletal system medicines (20.9% vs. 14.4%) than urban customers. The latter purchased more alimentary tract and metabolism medicines (32.1% vs. 30.6%) and dermatological medicines (10.9% vs. 6.7%) than rural customers.
There was also a significant difference in the selection of NPM among different age groups [x2 (df = 39) = 149.17, p,0.01]. Elderly people (more than 60 years old) purchased mostly alimentary tract and metabolism medicines, musculoskeletal system medicines, and blood and blood-forming organ medicines. Younger customers (25 years and below) mostly purchased dermatological medicines (149, 28.2%), anti-infectives for systemic use (101, 19.1), and nervous system medicines (85, 16.1).
The selection of NPM also differed significantly between men and women [x2 (df = 13) = 32.93, p = 0.002]. Men mostly purchased musculoskeletal system medicines, respiratory system medicines, and anti-infectives for systemic use. Women purchased more alimentary tract and metabolism medicines, cardiovascular system medicines, and dermatological medicines.
Ethnicity was also significantly associated with type of NPM purchased [x2 (df = 39) = 118.89, p,0.01]. Customers of Malay ethnicity mostly purchased anti-infectives for systemic use and musculoskeletal system medicines, while Chinese customers purchased more alimentary and cardiovascular system medicines. Indian customers purchased more respiratory system medicines than other groups.
Level of education was found to have a significant association with the type of NPM purchased [x2 (df = 39) = 74.74, p,0.01]. Customers with a tertiary level of education purchased more dermatological and nervous system medicines compared to other groups. Customers who had not received any formal education purchased more musculoskeletal system medicines, anti-infectives for systemic use and respiratory system medicines.
Type of occupation was also significantly associated with the selection of NPM [x2 (df = 143) = 280.70, p,0.01]. Musculoskel-etal system medicines were commonly purchased by those subjects who working in a field of elementary occupations, dermatological medicines by students, and alimentary tract and metabolism medicines by senior officials, managers, and retirees.
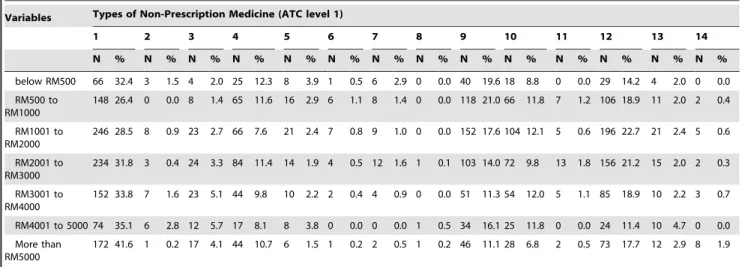
Household income per month was also associated with the type of NPM purchased [x2 (df = 78) = 190.26, p,0.01]. Customers with a household income less than RM500 per month were mostly purchased dermatological and anti-infectives for systemic use. High earners (more than RM5000 per month) mostly purchased medicines in the alimentary tract and metabolism group.
Predictors of Non-prescription Medicines Purchased Table four describes the results of multinomial logistic regression analysis. The regression was performed to identify the predictors of NPM purchased. Locality (urban or rural), gender, age, ethnicity, type of occupation and household income per month were the demographic factors that significantly predicted Table 1.Demographic profile of community pharmacy
consumers (n = 2729).
Characteristics n Percentage (%)
Age
16 to 25 years old 441 16.2
26 to 40 years old 1053 38.6
41 to 60 years old 1091 40.0
More than 60 years old 144 5.3
Locality
Rural 595 21.8
Urban 2134 78.2
Gender
Male 1369 50.2
Female 1360 49.8
Ethnic
Malay 1435 52.6
Chinese 788 28.9
Indian 260 9.5
Other 245 9.0
Education status
No formal education 113 4.1
Primary education 387 14.2
Secondary education 1427 52.3
Tertiary education 802 29.4
Occupation
Senior officials & manager 161 6.0
Professionals 428 15.9
Technician & associate professional 146 5.4
Clerical works 198 7.3
Service workers, shop & market sales workers
433 16.1
Craft & related trades workers 89 3.3 Skilled agricultural & fishery workers 118 4.4 Plant & machine-operator &
assemblers
72 2.7
Elementary occupation 203 7.5
Students 214 7.9
Retiree 153 5.7
Not working 479 17.8
Number of family member
Mean6standard deviation 4.9962.21 Median6Inter quartile range 5.0062.00 Household income per month (n = 2708)
Less than RM500 153 5.6
RM500 to RM1000 414 15.3
RM1001 to RM2000 647 23.9
RM2001 to RM3000 609 22.5
RM3001 to RM4000 381 14.1
RM4001 to RM5000 181 6.7
More than RM5000 323 11.9
Table 2.Types of non-prescription medicine purchased.
Types of non-prescription medicine (ATC classification) Frequency Percentage
Alimentary Tract & Metabolism
Stomatological Preparation 117 3.38
Drugs For Acid Related Disorders 156 4.51
Drugs For Functional Gastrointestinal Disorders 75 2.17
Bile And Liver Therapy 17 0.49
Laxatives 60 1.73
Anti diarrheal, Intestinal Anti inflammatory 65 1.88
Anti obesity Preparations, Excluding Dietary Products 29 0.84
Digestive (including Enzymes) 17 0.49
Anti Diabetics 38 1.10
Vitamins 281 8.12
Mineral Supplements 140 4.04
Appetite Stimulants 1 0.03
Other Alimentary Tract And Metabolism Products 105 3.03
Blood & Blood Forming Organs
Antithrombotic Agents 14 0.40
Anti Anaemic Preparations 8 0.23
Blood Substitutes And Perfusion Solutions 6 0.17
Cardiovascular System
Anti hypertensives 1 0.03
Diuretics 5 0.14
Peripheral Vasodilators 3 0.09
Vasoprotectives 3 0.09
Beta Blocking Agents 11 0.32
Calcium Channel Blockers 5 0.14
Agent Acting On The Renin-Angiotensin Systems 6 0.17
Serum Lipid Reducing Agents 80 2.31
Dermatologicals
Anti fungal For Dermatological Use 93 2.69
Emollients And Protective 46 1.33
Preparations For Treatment Of Wounds And Ulcers 7 0.20
Anti pruritic (including Antihistamines, Anesthethic) 18 0.52
Anti psoriatic 6 0.17
Antibiotic And Chemotherapeutics For Dermatological Use 14 0.40
Corticosteroid, Dermatological Preparation 81 2.34
Antiseptic And Anti disinfectants 31 0.90
Medicated Dressings 4 0.12
Anti Acne Preparations 20 0.58
Other Dermatological Preparations 25 0.72
Genito-Urinary System & Sex Hormone
Gynaecological Anti infectives And Antiseptics 8 0.23
Other Gynaecologicals 6 0.17
Sex Hormones And Modulators Of Genital System 45 1.30
Urologicals 26 0.75
Systemic Hormonal Preparation Excluding Sex
Pituitary And Hypothalamic Hormones and Analogues 1 0.03
Corticosteroids For Systemic Use 20 0.58
Anti-Infectives For Systemic Use
the purchase of NPM. The pseudo R-square analysis (Cox and Snell) found that 20% of the variation in NPM purchased is explainable by the demographic variables of the respondents.
Discussion
This study was conducted to investigate and explore the pattern of NPM use among Malaysian citizens who utilized the community pharmacies. Similar studies have been conducted in developed countries such as New Zealand and Australia. The findings of such studies are important in pharmaceutical marketing and to explore the practice of self-medication with NPM [5].
In the current study, the NPM purchased were categorized according to the ATC classification, up to the second level. To our
knowledge, there is currently no standardized classification of NPM. For this reason, comparison with the current NPM market and other studies is difficult. The ATC classification introduced by the World Health Organization is the ‘gold standard’ for international drug utilization research [14]. A drawback of our study was that we only used the ATC classification and not the defined daily dose (DDD). This was because the dose of the NPM that been purchased was not recorded. However, this does not affect the usefulness of the data that was gathered.
The alimentary tract and metabolism group of medicines were the most frequently purchased NPM in this study, particularly vitamins, minerals, and drugs for acid disorders. This was expected as most of the medicines in the group were either pharmacist only medicines or over-the-counter medicines. Vitamins and minerals Table 2.Cont.
Types of non-prescription medicine (ATC classification) Frequency Percentage
Anti mycotics For Systemic Use 22 0.64
Anti-Neoplastic & Immunomodulating Agents
Immune Sera And Immunoglobulins 2 0.06
Endocrine Therapy 1 0.03
Musculo-Skeletal System
Anti-inflammatory And Anti-rheumatic Products 357 10.31
Topical Products For Joints And Muscle Pains 122 3.52
Muscle Relaxants 21 0.61
Anti gout Preparations 16 0.46
Drug For Treatment Of Bone Diseases 2 0.06
Other Drugs For Disorder Of The Musculoskeletal Systems 29 0.84
Nervous System
Anaesthetic 2 0.06
Analgesics 344 9.94
Psycholeptics 2 0.06
Psycho analeptics 6 0.17
Other Nervous System Drugs 16 0.46
Anti-Parasitic Products, Insecticides And Repellents
Anti protozoals 5 0.14
Anti helmintics 20 0.58
Ecto parasiticides (including Scabicides, Insecticides and Repellent) 7 0.20
Respiratory System
Nasal Preparations 131 3.78
Throat Preparations 7 0.20
Drugs For Obstructive Airway Diseases 39 1.13
Cough And Cold Preparations 200 5.78
Antihistamine For Systemic Use 279 8.06
Other Respiratory System Products 16 0.46
Sensory Organs
Opthalmologicals 69 1.99
Orthologicals 14 0.40
Others
Other Therapeutic Products 2 0.06
General Nutrients 16 0.46
All Other Non-Therapeutic Products 2 0.06
Table 3.Pattern of non-prescription medicine by customers’ demographic.
Variables Types of Non-Prescription Medicine (ATC level 1)
1 2 3 4 5 6 7 8 9 10 11 12 13 14
N % N % N % N % N % N % N % N % N % N % N % N % N % N %
Locality Of Pharmacy
Rural 230 30.6 4 0.5 29 3.9 50 6.7 17 2.3 15 2.0 8 1.1 0 0.0 157 20.9 69 9.2 1 0.1 151 20.1 16 2.1 4 0.5 Urban 871 32.1 24 0.9 85 3.1 295 10.9 68 2.5 6 0.2 33 1.2 3 0.1 390 14.4 301 11.1 31 1.1 521 19.2 67 2.5 16 0.6
Age Group
25 Years And Below
149 28.2 2 0.4 11 2.1 85 16.1 12 2.3 2 0.4 8 1.5 0 0.0 63 11.9 71 13.4 4 0.8 101 19.1 15 2.8 6 1.1
26 To 40 Years 407 30.9 10 0.8 33 2.5 139 10.5 42 3.2 3 0.2 13 1.0 1 0.1 177 13.4 138 10.5 23 1.7 298 22.6 29 2.2 6 0.5 41 To 60 Years 438 32.8 8 0.6 59 4.4 102 7.6 26 1.9 11 0.8 16 1.2 2 0.1 251 18.8 142 10.6 5 0.4 236 17.7 35 2.6 5 0.4 More Than 60
Years
107 38.5 8 2.9 11 4.0 19 6.8 5 1.8 5 1.8 4 1.4 0 0.0 56 20.1 19 6.8 0 0.0 37 13.3 4 1.4 3 1.1
Gender
Male 534 30.7 17 1.0 46 2.6 156 9.0 34 2.0 12 0.7 23 1.3 2 0.1 294 16.9 183 10.5 18 1.0 380 21.8 33 1.9 10 0.6 Female 567 33.0 11 0.6 68 4.0 189 11.0 51 3.0 9 0.5 18 1.0 1 0.1 253 14.7 187 10.9 14 0.8 292 17.0 50 2.9 10 0.6
Ethnicity
Malay 546 28.9 12 0.6 49 2.6 199 10.5 55 2.9 16 0.8 34 1.8 2 0.1 324 17.2 230 12.2 21 1.1 354 18.8 43 2.3 3 0.2 Chinese 365 38.1 14 1.5 49 5.1 80 8.4 16 1.7 3 0.3 1 0.1 1 0.1 132 13.8 77 8.0 7 0.7 175 18.3 26 2.7 12 1.3 Indian 120 35.7 1 0.3 10 3.0 31 9.2 4 1.2 1 0.3 4 1.2 0 0.0 44 13.1 35 10.4 3 0.9 71 21.1 9 2.7 3 0.9 Others 69 24.7 1 0.4 6 2.2 35 12.5 10 3.6 1 0.4 2 0.7 0 0.0 47 16.8 28 10.0 1 0.4 72 25.8 5 1.8 2 0.7
Education Level
No Formal Education
44 32.6 1 0.7 4 3.0 10 7.4 3 2.2 0 0.0 2 1.5 0 0.0 28 20.7 12 8.9 0 0.0 28 20.7 3 2.2 0 0.0
Primary Education
165 33.7 2 0.4 14 2.9 44 9.0 8 1.6 7 1.4 5 1.0 0 0.0 115 23.5 40 8.2 4 0.8 75 15.3 9 1.8 1 0.2
Secondary Education
566 31.0 16 0.9 62 3.4 171 9.4 50 2.7 13 0.7 21 1.2 1 0.1 293 16.1 193 10.6 18 1.0 361 19.8 46 2.5 12 0.7
Tertiary Education
326 32.1 9 0.9 34 3.3 120 11.8 24 2.4 1 0.1 13 1.3 2 0.2 111 10.9 125 12.3 10 1.0 208 20.5 25 2.5 7 0.7
Occupation
Senior Officials And Manager
73 36.0 3 1.5 11 5.4 20 9.9 5 2.5 0 0.0 0 0.0 1 0.5 33 16.3 24 11.8 3 1.5 26 12.8 3 1.5 1 0.5
Professionals 160 31.2 5 1.0 16 3.1 65 12.7 18 3.5 1 0.2 1 0.2 1 0.2 57 11.1 61 11.9 4 0.8 110 21.4 13 2.5 1 0.2 Technicians And
Associate Professionals
65 31.3 2 1.0 4 1.9 16 7.7 6 2.9 0 0.0 7 3.4 0 0.0 20 9.6 29 13.9 1 0.5 53 25.5 5 2.4 0 0.0
Clerical Works 72 28.3 2 0.8 5 2.0 28 11.0 4 1.6 2 0.8 2 0.8 0 0.0 25 9.8 40 15.7 5 2.0 63 24.8 6 2.4 0 0.0 Service Workers,
Shop And Market Sales Workers
160 30.5 3 0.6 14 2.7 48 9.2 11 2.1 2 0.4 6 1.1 0 0.0 91 17.4 56 10.7 4 0.8 114 21.8 12 2.3 3 0.6
Craft And Related Trades Worker
37 30.3 1 0.8 3 2.5 10 8.2 2 1.6 6 4.9 1 0.8 0 0.0 27 22.1 8 6.6 0 0.0 24 19.7 2 1.6 1 0.8
Skilled Agricultural And Fishery Workers
53 34.9 2 1.3 3 2.0 13 8.6 3 2.0 1 0.7 2 1.3 0 0.0 25 16.4 12 7.9 2 1.3 32 21.1 3 2.0 1 0.7
Plant And Machine-Operator And Assembler
25 25.3 1 1.0 2 2.0 9 9.1 2 2.0 0 0.0 2 2.0 0 0.0 22 22.2 10 10.1 0 0.0 20 20.2 6 6.1 0 0.0
Elementary Occupation
94 32.4 0 0.0 4 1.4 27 9.3 8 2.8 1 0.3 4 1.4 0 0.0 79 27.2 21 7.2 4 1.4 41 14.1 7 2.4 0 0.0
Students 72 29.1 0 0.0 6 2.4 39 15.8 6 2.4 0 0.0 5 2.0 0 0.0 25 10.1 32 13.0 2 0.8 52 21.1 4 1.6 4 1.6 Retiree 70 37.2 6 3.2 12 6.4 12 6.4 3 1.6 3 1.6 3 1.6 0 0.0 32 17.0 16 8.5 0 0.0 28 14.9 2 1.1 1 0.5 Not Working/
Housewife
201 33.0 3 0.5 33 5.4 55 9.0 16 2.6 3 0.5 8 1.3 1 0.2 97 15.9 56 9.2 7 1.1 106 17.4 16 2.6 8 1.3
are usually purchased as dietary supplements. The increasing use of these products in Malaysia can be explained in part by the heightened awareness on health and general well being in recent years. The direct to consumer’s advertisement also plays a role in this situation. Furthermore, the liberalisation of Medicines (Advertisement and Sale) Act 1956 has affected the purchasing trend of NPM [15]. The Advertising Standards Authority of Malaysia functions to provide guidance via the Malaysian Code of Advertising Practice to promote and enforce high ethical standards
in advertising. The Medicine Advertisement Board of the Ministry of Health regulates the advertisement of pharmaceutical products, including vitamins and dietary supplements, under the Medicines (Advertisement & Sale) Act of 1956 (revised in 1983). The Medicine Advertisements Board Regulation of 1976 was imple-mented to ensure responsible advertising of medicines, appliances, and remedies that can be purchased by the public without a prescription [16]. Thus; there is a need to not only monitor the Table 3.Cont.
Variables Types of Non-Prescription Medicine (ATC level 1)
1 2 3 4 5 6 7 8 9 10 11 12 13 14
N % N % N % N % N % N % N % N % N % N % N % N % N % N %
below RM500 66 32.4 3 1.5 4 2.0 25 12.3 8 3.9 1 0.5 6 2.9 0 0.0 40 19.6 18 8.8 0 0.0 29 14.2 4 2.0 0 0.0 RM500 to
RM1000
148 26.4 0 0.0 8 1.4 65 11.6 16 2.9 6 1.1 8 1.4 0 0.0 118 21.0 66 11.8 7 1.2 106 18.9 11 2.0 2 0.4
RM1001 to RM2000
246 28.5 8 0.9 23 2.7 66 7.6 21 2.4 7 0.8 9 1.0 0 0.0 152 17.6 104 12.1 5 0.6 196 22.7 21 2.4 5 0.6
RM2001 to RM3000
234 31.8 3 0.4 24 3.3 84 11.4 14 1.9 4 0.5 12 1.6 1 0.1 103 14.0 72 9.8 13 1.8 156 21.2 15 2.0 2 0.3
RM3001 to RM4000
152 33.8 7 1.6 23 5.1 44 9.8 10 2.2 2 0.4 4 0.9 0 0.0 51 11.3 54 12.0 5 1.1 85 18.9 10 2.2 3 0.7
RM4001 to 5000 74 35.1 6 2.8 12 5.7 17 8.1 8 3.8 0 0.0 0 0.0 1 0.5 34 16.1 25 11.8 0 0.0 24 11.4 10 4.7 0 0.0 More than
RM5000
172 41.6 1 0.2 17 4.1 44 10.7 6 1.5 1 0.2 2 0.5 1 0.2 46 11.1 28 6.8 2 0.5 73 17.7 12 2.9 8 1.9
1 = Alimentary Tract & Metabolism, 2 = Blood & Blood Forming Organs, 3 = Cardio-Vascular System, 4 = Dermatological, 5 = Genito-Urinary System & Sex Hormone, 6 = Systemic Hormonal Preparation Excluding Sex, 7 = Anti-Infectives For Systemic Use, 8 = Anti Neoplastic & Immune Modulating Agents, 9 = Musculo-Skeletal System, 10 = Nervous System, 11 = Anti Parasitic, Insecticides And Repellent, 12 = Respiratory System, 13 = Sensory Organs, 14 = Others.
doi:10.1371/journal.pone.0059231.t003
Table 4.Results of multinomial logistic regression analysis to determine predictors for type of non-prescription medicines purchased.
Parameters
22 Log Likelihood Chi-Square df P value
Model Fitting Information
Intercept Only 11642.851
Final 10897.313 745.539 377 ,0.001
Goodness-of-Fit
Pearson 25046.189 27976 1.000
Deviance 9785.437 27976 1.000
Likelihood Ratio Tests
Intercept 10897.313 0.000 0
Number of family member 10905.691 8.378 13 0.818
Locality 10953.044 55.731 13 ,0.001
Gender 10929.871 32.558 13 0.002
Ethnicity 10981.573 84.261 39 ,0.001
Types of occupation 11071.043 173.730 143 0.041
Household income per month 11047.418 150.106 78 ,0.001
Age 11583.265 75.952 13 ,0.001
Education level 10934.000 36.687 39 0.576
purchasing trend of NPM but also the consequences of changes in direct-to-consumer advertising.
The high percentage of customers who purchased musculoskel-etal system medicines such as inflammatory and anti-rheumatic products and topical products for joint paint and muscle pain is alarming; particularly as anti-inflammatories were the most frequently purchased medicine and most anti-inflamma-tories consist of non-steroidal anti-inflammatory drugs. The misuse of such medicines could lead to potential risks such as gastroin-testinal bleeding and renal impairment [17,18]. Thus, the selling of NPM must be monitored periodically to ensure rational utilization of these medicines.
Antihistamines for systemic use, cough and cold preparations, and nasal preparations were the most frequently purchased medicine in the respiratory system group. As the utilization of NPM reflects self-medication practices, there is a risk of potential misuse of medicines and a potential delay in treating serious medical conditions. A study on the intention and frequency of use of medicines should be carried out to determine the magnitude of the misuse of NPM in our society.
This study also identified the association between occupation and NPM selection besides the demographic factors that had been evaluated in many other studies. The elementary occupations in the list include cleaners and helpers, agricultural, forestry and fishery labourers, and labourers in the mining, construction, manufacturing, and transport sectors. These groups are at high risk of developing musculoskeletal disorders such as repetitive strain injury (RSI), occupational overuse syndrome (OOS), and cumulative trauma disorder (CTD) [19]. This may explain the frequent purchase of musculoskeletal system medicines among those working in elementary occupations. Many studies have reported the high risk of myocardial infarction among senior officials and managers [20]. The frequent purchase of alimentary tract and metabolism medicines such as drugs for acid-related disorders is worrying. Confusion between cardiovascular disease symptoms and gastrointestinal disorders might be an underlying
cause. Appropriate consultation and symptom assessment by community pharmacists would help customers to select the correct non-prescription medicine and thus avoid this problem.
This study found that the predictors of NPM purchase in Malaysian customers were locality (urban or rural), gender, age, ethnicity, type of occupation and household income per month. These factors predicted about 20% of the NPM purchased. A factor that was not studied was the health status of the customers. Another important aspect that should be studied further was for whom the medicine was intended and for what indication. Our recommendation is to incorporate such factors in further research in the near future.
Conclusion
Malaysian consumers mainly purchased NPM to treat problems with the alimentary tract and metabolism. The choice of NPM was associated with socio-demographic profile. The predictors of NPM purchase were locality (urban or rural), gender, age, ethnicity, type of occupation and household income per month. The develop-ment of a national policy on NPM should be supported to ensure good self-medication practice among the Malaysian population. Future studies need to explore the safety and effectiveness of using these NPM.
The study focused on NPM purchased and did not inquire the intent of NPM purchased. Furthermore, paucity of information towards NPM purchase restricted the analysis to second level of ATC. Another limitation of the study is that it did not report defined daily dose.
Author Contributions
Conceived and designed the experiments: MAH. Performed the experi-ments: AHMY AAS. Analyzed the data: FS HA GC. Contributed reagents/materials/analysis tools: MAH HA GC AAS. Wrote the paper: AHMY MAH FS HA GC.
References
1. Bond C (2001) POM to P-implications for practice pharmacists. Prim Care Pharm 2: 5–7.
2. News (1997). Americans at risk from self-medication, survey reveals. Am J Health Syst Pharm 54: 2664–2666.
3. Benrimoj S, Stewark K, Robinson M (1988) Non-prescription medication consumer survey, 1987. The Medicine Group, Sydney.
4. Bradley C, Blenkinsopp A (1996) Over the counter drugs: the future for self medication. Brit Med J 312: 835–837.
5. Emmerton L, Shaw J (2011) Nonprescription medicine purchases in New Zealand. J Pharm Mark Manage 15: 97–111.
6. Porteous T, Bond C, Hannaford P, Sinclair H (2005) How and why are non-prescription analgesics used in Scotland? Fam Pract 22: 78–85.
7. Quah SR (1985) Self-medication in Singapore. Singapore Med J 26: 123–129. 8. Tsai AC, Liou JC, Chang J, Chuang YL, Lin SH, et al. (2006) Prevalence and determinants of dietary supplement and non-prescription medicine use by men and women over 53 years old in Taiwan. Results from a population-based cross-sectional survey. Aust J Aging 25: 191–197.
9. Covington TR (2006) Nonprescription drug therapy: Issues and opportunities. Am J Pharm Edu 70: 1–5.
10. Euromonitor International (2007) OTC Healthcare in Malaysia. Available: http://www.euromonitor.com/malaysia. Accessed 2 September, 2012. 11. Laws of Malaysia (2009) Poisons Act 1952 (Revised-1989). Available: http://
cornerstone.my/pharmacy_portal/aeimages//File/Poisons_Act_1952_Act_ 366.pdf. Accessed 1 September, 2012.
12. Raosoft Inc (2011) Sample Size Calculator. Available: http://www.raosoft.com/ samplesize.html. Accessed 1 September, 2012.
13. Bennett S, Woods T, Liyanage WM, Smith DL (1991) A simplified general method for cluster-sample surveys of health in developing countries. World Health Stat Q 44: 98–106.
14. World Health Organization (2003) Introduction to drug utilization research. Oslo, Norway: 1–47. Available: http://www.whocc.no/filearchive/ publications/drug_utilization_research.pdf. Assessed 5 September, 2012. 15. Dharmender S (2010) Rules on healthcare ads relaxed, says Liow. The Star.
Available: http://thestar.com.my/news/story.asp?file = /2010/9/24/nation/ 7093952&sec = nation. Accessed 28 August, 2012.
16. Hassali MA,, Saleem F, Aljadhey H, Khan TM 2012 Evaluating the Content of Advertisements for Dietary Supplements in Malaysian Women’s Magazines. Drug Inf J 46: 723–728.
17. Carson JL, Strom BL, Soper KA, West SL, Morse ML (1987) The association of nonsteroidal anti-inflammatory drugs with upper gastrointestinal tract bleeding. Arch Intern Med 147: 85–88.
18. Perneger TV, Whelton PK, Klag MJ (1994) Risk of kidney failure associated with the use of acetaminophen, aspirin, and nonsteroidal antiinflammatory drugs. N Eng J Med 331: 1675–1679.
19. Cabec¸as JM (2006) Occupational Musculoskeletal Disorders in Europe: Impact, Risk factors and Preventive Regulations. Enterprise and Work Innovation Studies 2: 95–104.