Plant Community Responses to Simultaneous
Changes in Temperature, Nitrogen
Availability, and Invasion
Elise S. Gornish1*, Thomas E. Miller2
1Department of Plant Sciences, University of California Davis, Davis, California, United States of America,
2Department of Biological Sciences, Florida State University, Tallahassee, Florida, United States of America
Abstract
Background
Increasing rates of change in climate have been observed across the planet and have con-tributed to the ongoing range shifts observed for many species. Although ecologists are now using a variety of approaches to study how much and through what mechanisms in-creasing temperature and nutrient pollution may influence the invasions inherent in range shifts, accurate predictions are still lacking.
Methods and Results
In this study, we conducted a factorial experiment, simultaneously manipulating warming, nitrogen addition and introduction ofPityopsis aspera, to determine how range-shifting spe-cies affect a plant community. We quantified the resident community using ordination scores, then used structural equation modeling to examine hypotheses related to how plants respond to a network of experimental treatments and environmental variables. Varia-tion in soil pH explained plant community response to nitrogen addiVaria-tion in the absence of in-vasion. However, in the presence of invasion, the direct effect of nitrogen on the community was negligible and soil moisture was important for explaining nitrogen effects. We did not find effects of warming on the native plant community in the absence of invasion. In the presence of invasion, however, warming had negative effects on functional richness directly and invasion and herbivory explained the overall positive effect of warming on the plant community.
Conclusions and Significance
This work highlights the variation in the biotic and abiotic factors responsible for explaining independent and collective climate change effects over a short time scale. Future work should consider the complex and non-additive relationships among factors of climate change and invasion in order to capture more ecologically relevant features of our changing environment.
OPEN ACCESS
Citation:Gornish ES, Miller TE (2015) Plant Community Responses to Simultaneous Changes in Temperature, Nitrogen Availability, and Invasion. PLoS ONE 10(4): e0123715. doi:10.1371/journal. pone.0123715
Academic Editor:Shuijin Hu, North Carolina State University, UNITED STATES
Received:December 19, 2014
Accepted:March 6, 2015
Published:April 16, 2015
Copyright:© 2015 Gornish, Miller. This is an open access article distributed under the terms of the
Creative Commons Attribution License, which permits unrestricted use, distribution, and reproduction in any medium, provided the original author and source are credited.
Data Availability Statement:All data have been uploaded to Figshare and can be accessed through
http://figshare.com/authors/Elise_Gornish/475488. Data are also available upon request from Elise Gornish.
Introduction
One of the most dramatic effects of climate change has been the worldwide increase in the fre-quency and extent of movement by species into new places [1,2]. Multiple climate change driv-ers, including rising atmospheric temperatures and nutrient pollution, have been shown to affect the invasion of new species by changing or by reducing limiting resources [3,4]. For ex-ample, climate change can shift resource availability directly [5], making it easier for a coloniz-er to establish a population by taking advantage of new conditions. Altcoloniz-ernatively, climate-induced extinction of natives can change resource availability indirectly by affecting the extant native community [6], making a habitat more or less conducive to invasion. A subsequent eco-logical cascade often follows these invasions [7,8,9,10].
Recent studies have attempted to quantify the combined effects of invasion and other cli-mate change factors in order to capture a more realistic understanding of biological response to a changing environment. Many of these studies have found that simultaneous factors of cli-mate change have non-additive effects (e.g., [11,12,13,14], but see [15,16]). In fact, a recent review documented a negative relationship between the number of climate change factors and overall effect size in plants [17]. Collectively, these studies suggest that we might not be able to make realistic predictions of the comprehensive effects of climate change based on experiments that simply record the response of ecological communities to a single changing environmental condition. Non-additive effects also hint at complex relationships among factors of climate change, ecological response, and underlying mechanisms that can explain these effects. For ex-ample, Verheyen and colleagues [18] found that both temperature and nitrogen deposition negatively affected the regeneration success of a threatened shrub, but the factors driving these relationships differed. Temperature was responsible for a reduction in seed number per cone, while nitrogen deposition enhanced cone predation [18]. In order to develop a better under-standing of the relationship between climate change and biological response, process based studies that attempt to identify the biotic and abiotic factors actually explaining these responses must become a more common component of field experiment.
Very few studies have investigated the combined effects of two of the most important com-ponents of climate change—increasing temperature and nitrogen deposition- and newly estab-lished species on native communities [19], despite expectation of an interaction [20,21]. Complex dynamics are expected to occur because ecological response to all three of these fac-tors can be similar, despite differences in the variables that ultimately explain these effects. For example, nutrient cycling can be modified as a result of nitrogen deposition, increasing temper-ature and the presence of invasion (e.g., [1,22]). The mechanism driving these changes, howev-er can diffhowev-er between nitrogen deposition and warming (i.e. changes in litthowev-er; [23,24]), and invasion (i.e., [1]).
A more complete understanding of the relationships between climate change elements and invasive species requires the manipulation of all factors separately and in combination, while quantifying effects directly on resources, as well as in changes of the resident plant community. In this work, we asked, over a short time scale (1) how does increased temperature and nitro-gen deposition influence a resident plant community and (2) how can invasion influence the plant community response to elevated temperature and nitrogen? We hypothesized warming and elevated nitrogen deposition to increase the abundance of invasive species found in our plant communities. This is because extinctions and range shifts often occur in response to
increased temperature and nitrogen, which subsequently reduce community stability [25]. And, communities in transition may be more vulnerable to the effects of invasion [26]. We also expected invasion to enhance elevated temperature and nitrogen [27,28] because these factors can modify habitats in similar ways, subsequently increasing overall effects when occurring at the same time. Further, we hypothesized that plant diversity would be reduced by the simulta-neous effects of warming, nitrogen addition, and invasion compared to any of these indepen-dently [29,30]. However, we expected that the factors explaining community response to combinations of invasion and warming, and invasion and nitrogen deposition would be differ-ent than factors mediating community response to warming and nitrogen deposition alone.
Materials and Methods
This study was conducted in a 1.6 hectare old-field at Tall Timbers Research Station, just south of the Florida-Georgia border. Tall Timbers provided a permit to access the experimental site. This area was last used for agriculture ca. 150 years ago, and prior to the start of the experi-ment, the field had been disked annually. The field harbors a diverse community, dominated by native grasses and legumes and did not involve endangered or protected species. The soil type is a slightly acidic sandy loam. Precipitation at the site averages 100 cm per year, and the average annual temperature is 20°C.
The two year experiment was initiated in 2011, using a randomized block design with three main factors, each with two levels: nitrogen (N addition and no N addition), warming (warm-ing and no warm(warm-ing), and invader (invader present and absent), for a total of 8 treatments. To minimize leaching of nitrogen between plots, the plots were arranged in a split-plot design, with N treatments arranged together within blocks with warming and invader treatments ran-domized within these blocks. Each block of treatments was replicated 5 times, for a total of 40 plots [31]. Each plot was 4 m2, but measurements were only collected from the center 1 m2to minimize edge effects. Plots were separated by 1 m. This experiment was nested within a larger study, so data from some plots will not be discussed here (e.g. nitrogen + warming).
We implemented the nitrogen treatments by applying sodium nitrate (NaNO3) at the soil surface in the amount of 4 g/m² per year, based on projected dry + wet nitrogen deposition rates for northern Florida [32]. Six applications of equal amounts of NaNO3were applied dur-ing the growdur-ing season (May—October) in 2011 and 2012. The warming treatment was applied with open-top hexagonal chambers constructed of a wood frame wrapped with 4 mil clear polyethylene plastic sheet [33]. Due to uneven micro-topography, the chambers sat approxi-mately 3 cm off the ground, allowing for air circulation beneath the base of the greenhouses. The chambers acted as solar traps and increased the average ambient temperature at the soil surface by ~ 2.5° C. Chambers increased night temperatures on average 25% more than they in-creased day temperatures. In warming control plots, we installed‘sham’greenhouse chambers with squares cut out of each plastic panel, reducing the cover of plastic sheeting by 85%. The ambient temperature in‘sham’plots did not differ significantly from the ambient temperature of nitrogen control plots (no sham). Average daytime light at the soil surface did not differ be-tween sham and non sham greenhouse chambers across the growing season. The plastic was replaced annually on all greenhouses.
individuals ofP.asperafrom existing populations in Tall Timbers into each of the invasion treatment plots. Twenty holes were excavated and refilled in plots that did not receive trans-plants to simulate disturbance due to transplanting.
Data were collected on biotic and abiotic factors that may be susceptible to elevated nitro-gen, temperature, and invasion. These included soil characteristics, such as water-holding ca-pacity, pH, percentage organic matter, and soil moisture; and vegetation characteristics, such as species diversity, percent invasive species, availability of understory light, foliar water con-tent, dominant plant height, foliar toughness, and percent leaf damage from herbivores and pathogens.
Soil characteristics
In August 2012, two sets of samples were collected from the top 7 cm of the soil profile from four random locations in each plot to determine soil moisture and soil organic matter using standard methods [35]. For both percent soil moisture and organic matter, the four measure-ments from each plot were averaged. In each plot, another set of soil cores 10 cm in depth were taken from four random locations, and soil pH of each core was measured using a Fieldscout SoilStick pH meter (Spectrum Technologies, Inc.). Again, these four measurements were aver-aged to provide a single soil pH value per plot for analysis. Single measurements of these soil characteristics were collected because we were interested in the relative differences among plots, and not necessarily absolute values of the measurements. Because, in general, soil charac-teristics maintain relative differences through time (e.g., [35]), we were confident that a single measurement would be reflective of soil differences among plots through the duration of the experiment.
The final abiotic characteristic measured was photosynthetically active light (PAR). PAR was estimated by measuring spectral irradiance using a LI-COR (LI-190) quantum PAR sensor at three random points on the soil surface between 1100–1300 hours EST on a cloudless day in August in 2012. These measurements were averaged within a plot to obtain one value of under-story light per plot.
Vegetation characteristics
Percent cover by species was estimated visually in each plot at peak biomass (in August of 2011 and 2012). These data were used to determine vegetation cover, species richness (number of unique species), and percent invasive species (not includingP.aspera). Functional richness was also quantified from the census data. Species were categorized into functional groups based on growth forms: native and invasive grass; native and invasive forb; legume; shrub; vine.
Some destructive sampling was necessary to quantify how vegetation was affected by the ex-perimental treatments. As a standard, we measured several characteristics of a dominant plant
Trichostema dichotomum(Laminaceae), an annual herb that naturally occurred in high
abun-dances across all plots. The amount of water in the vascular tissue ofT.dichotomumwas deter-mined as cellular relative water content (RWC) using modified rapid estimate procedures [36]. In June of 2012, three leaves were collected at random fromT.dichotomumindividuals in each plot and were weighed to determine a fresh weight (FW). Samples were then immersed in de-ionized water for 3 hours in a dark fridge and reweighed to determine turgid weight (TW). Fi-nally, the samples were placed in an oven at 85°C for 24 hours and then reweighed for dry weight (DW). RWC was then found by dividing TW-DW from FW-DW.
As a proxy for biomass, we also measured the height of the four tallest individuals ofT.
dichotomumin each plot in both July 2011 and 2012 as the height of this species in
used these measurements to determine an average biomass per plot. A penetrometer was used to measure leaf toughness by calculating the weight necessary to puncture a hole through a leaf [37].
We also assessed herbivory and pathogen damage onT.dichotomumindividuals across plots. The fourth leaf from the top of an individualT.dichotomumwas collected from four in-dividuals in each plot. Percent herbivore damage was assessed by determining how much of the total leaf area was missing due to herbivory (percent tissue removed). Percentage pathogen damage was estimated by determining how much of the total leaf area was discolored by brown lesions [38].
Analysis
To reduce the data on species abundances to a form that was more amenable for structural equation modeling, we used NMDS ordination analyses on the 15 most common species [39], each of which was1% proportion of the species found across the plots. We used the NMDS axes 1 and 2 (two dimensions were chosen by interpreting a scree plot of dimensionality vs. stress) to characterize the plant communities in each treatment group: the nitrogen plots (nitrogen only, nitrogen + invasion, and control) and the warming plots (warming only, warm-ing + invasion, and control). We used a Bray-Curtis dissimilarity measure with the vegan pack-age in R (using metaMDS) for our analysis. For each treatment group we conducted regression analysis between the NMDS scores and the percent cover of the 15 species used in the ordina-tion to make biological interpretaordina-tions of scores.
We first conducted univariate analyses to examine main and interactive effects of nitrogen addition, warming and invasion on NMDS axes scores using ANOVA. We then used structural equation modeling (SEM; using AMOS version 5.0.1; [40]) to represent and investigate the re-lationships among treatments, environmental response variables and the NMDS results [41]. This approach allowed us to identify plausible causal pathways among variables to understand the mechanisms driving changes in the native plant community in response to experimental treatments.
Since including all 18 measured environmental variables into SE models is not a parsimoni-ous approach, we first wanted to identify the subset of environmental factors that most likely played a role in explaining treatment effects on the resident plant community. To do this, we overlaid data from all measured environmental variables as vectors onto the NMDS ordination to identify measured variables that had strong correlations with one or both axes (S1 Table). Environmental variables that demonstrated significant correlations with NMDS axes were then included in SEM development. For this reason, our application of SEM can be considered to be partially model-building instead of strictly hypothesis testing.
between the observed and predicted covariance matrices (lower is better); and two goodness of fit measures, the Akaike Information Criterion (AIC), and the root mean square error of ap-proximation (RMSEA). Apvalue indicating the significance of the Chi-squared discrepancy function (which represents a likelihood-ratio test) was also identified for each model. This value indicates the similarity between observed and predicted covariance matrices. We used the same approaches described above to develop SEMs with data from the warming treatment plots.
We also wanted to detect if and how the presence of invasion affects the network of interac-tions among environmental variables that drive responses of the plant community to nitrogen addition and warming. To do this, we used multigroup modeling to directly compare models in the absence and presence of invasion (models compared were nitrogen only vs. nitrogen + in-vasion models, and warming only vs. warming + inin-vasion). We first conducted an invariance (similarity) test which compared the comparative fit index (ΔCFI; [43]) between the configural model (no equality constraints imposed) and the measurement model (all equality constraints imposed). If invariance was found, we proceeded to sequentially modify equality constraints on each factor so that we could assess invariance among models where parameters were freely estimated using aΔCFI cutoff of 0.01 [44].
Results and Discussion
The resident community contained over 53 species; some of the more abundant species includ-ed a flatsinclud-edge,Cyperus stigosus, along with the annual herbsAmbrosia artemisiifoliaand
Tri-chostema dichotomum, the perennial herbsPolypremum procumbens,Rhexia maiana, and
Campsis radicans, and two small shrubs,Rubus flagellarisandR.cuneifolius. The species varied
in their responses to the treatments. The addition ofPityopsis aspera, for example, seemed to increase the abundance ofT.dichotomumandCyperus stigosus, but decreased other species, such asR.flagellarisandCampsis radicans(S2 Fig). Nitrogen addition plots had almost 70%
moreP.procumbensthan control plots, but fewer individuals ofHelianthus angustifoliusand
Monarda punctata. The warming treatment was correlated with slight increases in many
spe-cies, but especiallyPolypremum procumbens,A.artemisifolia, andT.dichotomum. Other spe-cies showed decreases to the warming, includingS.canadensisandR.flagellaris. Although there was no significant difference in species richness across plots, nitrogen plots were com-prised of a smaller number of invasive annuals (p= 0.003) and a larger number of native climb-ing plants (p= 0.03).
Percent damage by herbivory and pathogens and soil moisture were lowest in the nitrogen addition plots. Conversely, soil pH was highest in the nitrogen plots (Table 1). This was not en-tirely unexpected as nitrogen application has been shown to increase pH through increased above- and below-ground plant growth, which results in excess nitrate capture, biocarbonate release and the ultimate reduction of soil acidity [45]. In the warming plots, leaf toughness was lowest and demonstrated the least variation compared to plots exposed to all other treatments. Percent soil organic material was also highest in these plots (Table 2). The ANOVA results sug-gest that NMDS1 scores were most affected by the interaction between warming and invasion (p= 0.07), compared to all other treatment effects. The NMDS2 scores were affected by nitro-gen addition (p= 0.05), warming (p= 0.05), and warming + invasion (p= 0.01).
Nitrogen addition
The metaMDS analysis suggests that our NMDS results were relatively robust (stress = 0.23; R2= 0.92). Higher values of NMDS1 were correlated with increasing cover of the dominantT.
relatively rare speciesH.angustifolius(p = 0.02), andR.cuneifolius(p<0.0001). Alternatively,
higher values of NMDS2 reflected increasing cover ofM.punctata(p= 0.01), and the dominant graminoidC.strigosus(p= 0.008). Overall, functional richness was negatively correlated with NMDS1 (p= 0.02) and positively correlated with NMDS2 (p= 0.03).
Table 1. Means and (SD) for environmental factors from plots exposed to the nitrogen treatment (data from warming treatment plots excluded).
No nitrogen added Nitrogen added
Invasion - Invasion + Invasion - Invasion +
Species richness 2011* 9.4 (3.0) 11.4 (2.6) 11.4 (4.5) 12.2 (3.1)
Species richness 2012* 9.6 (2.9) 9.7 (2.4) 10.4 (2.3) 9.2 (2.2)
% Invasive 2011 16.5 (9.2) 7.4 (6.5) 7.8 (4.6) 11.2 (1.7)
% Invasive 2012* 17.0 (8.7) 5.9 (5.3) 10.1 (2.6) 14.0 (9.2)
Functional richness 4.5 (0.7) 4.5 (0.8) 4.7 (0.5) 4.6 (0.7)
Foliar water content 0.1 (0.0) 0.1 (0.1) 0.2 (0.3) 0.2 (0.3)
Biomass 2011 100.1 (13.7) 96.6 (15.2) 96.5 (18.8) 97.2 (17.7)
Biomass 2012 74.6 (14.7) 75.9 (10.5) 86.0 (13.6) 78.2 (13.7)
Foliar toughness 87.3 (33.1) 92.7 (53) 73.8 (26.8) 77.3 (32.0)
Soil pH* 5.1 (0.4) 5.4 (0.2) 7.2 (3.1) 5.6 (0.4)
Soil moisture* 9.2 (1.0) 9.0 (0.7) 8.8 (1.5) 9.2 (2.2)
% Soil organic 3.8 (2.7) 3.0 (0.7) 2.9 (0.3) 3.0 (0.5)
Water holding capacity 27.5 (1.2) 27.8 (1.4) 27.3 (2.3) 34.2 (13.3)
Solar radiation 109.9 (87.8) 158.1 (120.7) 83.8 (65.9) 84.8 (59.2)
% Herbivory 4.6 (4.6) 3.5 (4.3) 6.0 (9.6) 0.0 (0.0)
% Pathogen 3.0 (2.6) 2.8 (3.2) 8.0 (12.6) 4 (3.5)
Factor names followed by an*were included in the structural equation models for nitrogen plots.
doi:10.1371/journal.pone.0123715.t001
Table 2. Means and (SD) for environmental factors from plots exposed to the warming treatment (data from nitrogen addition plots excluded).
No warming Warming
Invasion - Invasion + Invasion - Invasion +
Species richness 2011 8.6 (2.9) 12.6 (2.3) 11 (2.9) 12.6 (2.1)
Species richness 2012* 9.6 (2.7) 8.8 (2.5) 8.6 (1.3) 10.0 (3.1)
% Invasive 2011* 15.4 (8.1) 4.5 (6.3) 11.7 (9.1) 11.2 (4.3)
% Invasive 2012 13.3 (14.7) 6.5 (6.1) 7.5 (16.8) 19.4 (13.5)
Functional richness 4.4 (0.5) 4.2 (0.8) 4.4 (0.8) 4.6 (0.7)
Foliar water content 0.1 (0.0) 0.2 (0.1) 0.1 (0.0) 0.1 (0.0)
Biomass 2011 97.0 (16.8) 97.0 (6.7) 95.2 (7.7) 101.5 (13.1)
Biomass 2012 72.8 (6.9) 81.3 (8.3) 90.2 (11.6) 93.6 (17.4)
Foliar toughness 94.1 (43.4) 112.4 (70.0) 61.5 (20.8) 69.9 (20.8)
Soil pH* 5.2 (0.1) 5.5 (0.2) 5.2 (0.4) 5.5 (0.7)
Soil moisture 9.6 (0.7) 8.8 (0.6) 9.5 (0.4) 8.7 (0.7)
% Soil organic 2.9 (0.7) 3.0 (0.5) 3.2 (0.4) 3.4 (0.5)
Water holding capacity 27.3 (1.1) 27.7 (1.1) 27.4 (1.7) 27.1 (0.7)
Solar radiation 71.6 (78.1) 176.0 (140.5) 120.5 (97.0) 71.9 (44.8)
% Herbivory* 4.2 (5.8) 5.8 (4.8) 12.5 (25) 3.6 (3.3)
% Pathogen* 3.0 (2.5) 4.2 (4.2) 5.8 (5.9) 3.6 (2.3)
Factor names followed by an*were included in the structural equation models for warming plots.
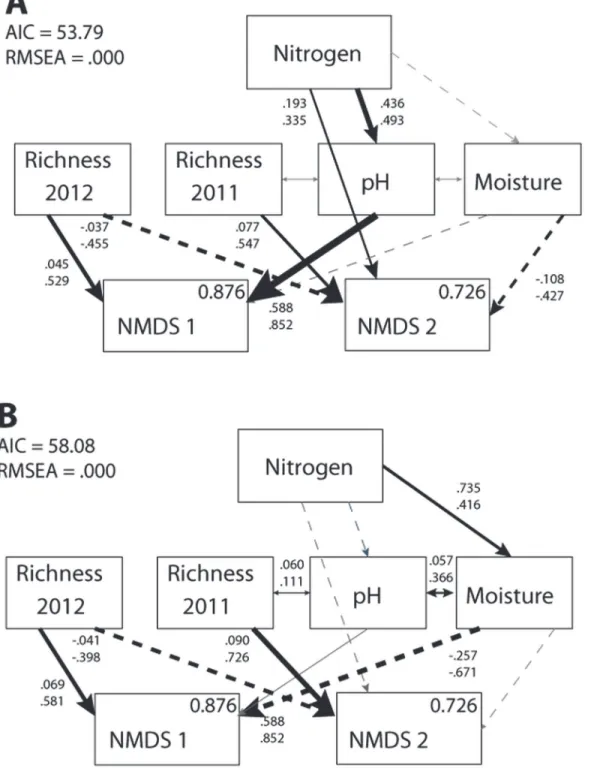
Five predictor variables were included in the first SE model (constructed using nitrogen ad-dition and control data) because of correlations with NMDS axes (S2 Table), including species richness in 2011 (r2= 0.483,p= 0.002) and 2012 (r2= 0.583,p= 0.001); percentage invasive plants per plot in 2012 (r2= 0.216,p= 0.08), soil pH (r2= 0.225,p= 0.07), and soil moisture (r2= 0.212,p= 0.07). Because percent invasive plants per plot in 2012 was strongly correlated with species richness in 2012 (S2 Table), the percent invasive variable was excluded from model construction.
In the absence of invasion, the most parsimonious model predicting nitrogen effects dem-onstrated that species richness in 2011 and 2012 had opposing relationships with the native plant community (Fig 1A). There was a positive relationship between species richness in 2011 and NMDS2 scores (increased functional richness and cover by a dominant graminoid), but these community values had a negative relationship with species richness in 2012. Elevated soil pH increased functional species richness (Table 1), possibly explained by changes in species-specific plant growth capabilities (e.g., [46,47,48]). The subsequent change in NMDS1 scores was likely due to disproportionate benefit of dominant and invasive species to the modification of soil pH [49]. Nitrogen addition likely affected unmeasured plant traits related to competi-tion, such as the growth rate or stomatal conductance of rare species, subsequently modifying the dominance structure of the community. Finally, the direct path from nitrogen to NMDS2 indicates that a portion of the nitrogen treatment effect on changes in the native plant commu-nity was not accounted for by any of the environmental variables present in the model (Fig 1A).
In general, paths in the second SEM (including invasion only and nitrogen + invasion) were similar in direction (but not in magnitude) to those found in the nitrogen only model (Fig 1B). In the presence of invasion, species richness in 2011 and 2012 had opposite correlations with the native plant community in 2012. Differences between models did exist, however. In the presence of invasion, soil pH no longer explained changes in community composition.P. as-peracould have amended soil nitrogen availability or fixation rates [50], obfuscating nitrogen effects on soil acidity (e.g., [51]), and explaining the loss of the role of soil pH in the model. Additionally, in the presence of invasion, nitrogen indirectly affected the native plant com-munity through changes in soil moisture (Fig 1B), instead of through changes in soil pH (ΔCFI = 0.163). This increase in soil moisture could have resulted from the experimental inva-sion ifP.asperasupplied adequate shade to reduce moisture loss at the soil surface through its living tissue [52], or through litter deposition [53].
Warming
Two dimensions of the NMDS (stress = 0.23) resulted in a non-metric R2= 0.94. Higher values of NMDS1 were correlated with increases in the cover of common (but not dominant) species:
C.radicans(p= 0.009),R.flagellaris(p<0.001), andS.auriculata(p= 0.05), in addition to the
dominant graminoidCyperus strigosus(p= 0.01). Higher values of NMDS1 were also correlat-ed with decreases in the cover of the exotic graminoidPaspalum urvillei(p= 0.004). Alterna-tively, higher values of NMDS2 were correlated with increases in the cover of the common shrubR.cuneifolius(p= 0.001), and with decreases in the cover of the commonCampsis radi-cans(p= 0.008), andR.flagellaris(p= 0.02). Overall, functional richness was positively corre-lated with NMDS1 (p= 0.08), but demonstrated no relationship with NMDS2.
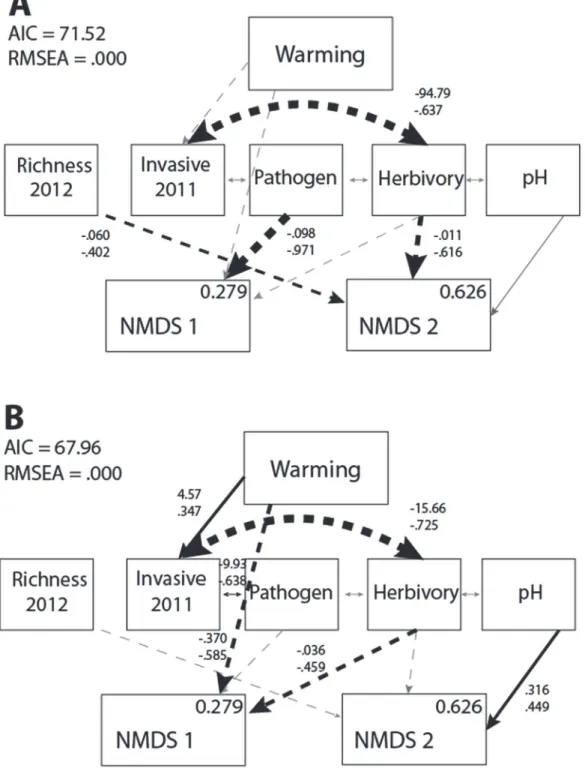
result of a non-random reduction in the abundance of species with traits that are particularly vulnerable to changes in temperature [55,56]. Other predictor variables included foliar herbiv-ory damage (r2= 0.217,p= 0.06), foliar pathogen damage (r2= 0.177,p= 0.09), and soil Fig 1. Results of the nitrogen SEM.Nitrogen effects on plant community NMDS scores in the (A) absence (χ² = 1.79, d.f. = 9,p= 0.994) and (B) presence of invasion (χ² = 6.08, d.f. = 9,p= 0.732). Black arrows with values indicate significant paths, gray arrows indicate insignificant paths, solid arrows indicate positive relationships, and dashed arrows indicate negative relationships. Path values indicate unstandardized (top) and standardized (bottom) coefficients. Within box values indicate R2values, which represent the proportion of variance explained for each response variable.
pH (r2= 0.315,p= 0.01). These changes in pathogen and herbivory loads can be important drivers of productivity and composition across resource and environmental gradients [57]. Be-cause species richness in 2011 was strongly correlated with species richness in 2012 and percent invasive species in 2011 (S2 Table), this variable was excluded from model construction.
In the absence of invasion, the most parsimonious model predicting warming effects dem-onstrated that increased pathogen damage was negatively correlated with functional richness, potentially through an increase in exotic species as NMDS1 scores decrease (Fig 2A). Species richness in 2012 and herbivory acted in concert to reduce NMDS2 scores, which was character-ized by a reduction in dominant cover across plots. Finally, the effects of percent invasive spe-cies in 2011 and pH modified the native plant community, but only indirectly through other environmental factors such as herbivory and pathogen damage.
The presence of the invasion treatment significantly modified the way in which warming af-fected the native plant community (ΔCFI = 0.141). In the presence of invasion, warming direct-ly decreased functional richness and increased the cover of exotics, while indirectdirect-ly affecting NMDS1 scores through invasion and herbivory (Fig 2B). Invasive species have been shown to facilitate further invasion [58], and, although this is also expected in the presence of warming [59], the explanatory role of invasive species in 2011 occurs with an intermediary pathway to herbivore damage. Warming served to reduce herbivory on a dominant plant, perhaps because individuals experiencing herbivory responded to elevated temperatures by shortening their life cycle [60], which subsequently reduced foliar damage [61]. The presence of the invasiveP. as-peracould have served to modify the presence of herbivory indirectly, for example, by facilitat-ing differences in plant defenses or soil characteristics, or directly by reducfacilitat-ing herbivore presence [62]. Warming could have encouraged this response as well [63], but perhaps this sig-nal of herbivore damage could only be identified when the effect was exacerbated by the pres-ence of a novel invasive species.
Invasion also modified direct paths from environmental factors to NMDS scores. For exam-ple, although species richness in 2012 and pathogen damage no longer played a direct role in explaining changes in the native plant community, decreasing acidity (increasing pH values) appeared to encourage the cover of the graminoid dominantC.strigosus. Increasing damage from herbivory continued to have a significant effect on the native plant community, but, in the presence of invasion, resulted in a decrease in both functional richness and the cover of some common species (Table 2).
Conclusion
Supporting Information
S1 Fig. Relationship between main stem height and adult biomass forTrichostema dichoto-mum.
(DOCX)
Fig 2. Results of the warming SEM.Warming effects on plant community NMDS scores in the (A) absence (χ² = 15.519, d.f. = 16,p= 0.487) and (B) presence of invasion (χ² = 10.002, d.f. = 16,p= 0.867). Arrow characteristics and all values as inFig 1.
S2 Fig. Mean ± SD for the 15 most abundant plant species found across plots.(A) control, (B) nitrogen, and (C) warming treatments in the absence (white bars) and presence (black bars) of invasion. Species are arranged in functional groups. Annual herbs: AMAR =Ambrosia
artemisiifolia, TRDI =Trichostema dichotomum. Perennial herbs: SOCA =Solidago
canaden-sis, HEAU =Helianthus austifolia, MOPU =Monarda punctate, POPR =Polypremum procum-bens, DICA =Dichondra carolinensis, RHMA =Rhexia maiana; Vines: CARA =Campsis
radicans, SMAU =Smilax auriculata; Shrubs: RUCU =Rubus cuneifolius, RUFL =Rubus
fla-gellaris; and Graminoids: PAUR =Paspalum urvillei, CYST= Cyperus strigosus, PANO =
Pas-palum notatum.
(DOCX)
S1 Table. NMDS scores and correlations of measured environmental variables and ordina-tion axes.
(DOCX)
S2 Table. Scatterplot of relationships among measured environmental variables.
(DOCX)
Acknowledgments
The authors would like to thank the many volunteers that helped to set up the experiment and collect data. Jessica Hellmann provided helpful comments on earlier drafts of the manuscript. This work was supported, in part, by Tall Timbers Research Reserve.
Author Contributions
Conceived and designed the experiments: ESG. Performed the experiments: ESG. Analyzed the data: ESG. Contributed reagents/materials/analysis tools: ESG TEM. Wrote the paper: ESG TEM.
References
1. Vitousek PM. (1990) Biological invasions and ecosystem processes: towards an integration of popula-tion biology and ecosystem studies. Oikos 57: 7–13.
2. Bradley BA, Blumenthal DM, Wilcove DS, Ziska LH. (2010) Predicting plant invasions in an era of global change. Trends in Ecology & Evolution 25: 310–318.
3. Maskell LC, Bullock JM, Smart SM, Thompson K, Hulme PE. (2006) The distribution and habitat associ-ations of non-native plant species in urban riparian habitats. Journal of Vegetation Science 17: 499– 508.
4. Siemann E, Rogers WE, Grace JB. (2007) Effects of nutrient loading and extreme rainfall events on coastal tallgrass prairies: invasion intensity, vegetation responses, and carbon and nitrogen distribu-tion. Global Change Biology 13: 2184–2192.
5. Norby RJ. (1998) Nitrogen deposition: a component of global change analyses. New Phytologist 139: 189–200.
6. McLaughlin JF, Hellmann JJ, Boggs CL, Ehrlich PR. (2002) Climate change hastens population extinc-tions. Proceedings of the National Academy of Science U.S.A. 99: 6070–6074. PMID:11972020
7. Sharp BR, Whittaker RJ. (2003) The irreversible cattle-driven transformation of a seasonally flooded Australian savanna. Journal of Biogeography 30: 783–802.
8. Parmesan C, Matthews J. (2006) Biological impacts of climate change. In (eds. Groom MJ, Meffe GK, Carroll CR): Principles of Conservation Biology. Sinauer Associates, Inc., Sunderland, pp: 333–360.
9. White PCL, Ford AES, Clout MN, Engeman RN, Roy S, Saunders G. (2008) Alien invasive vertebrates in ecosystems: pattern, process and the social dimension. Wildlife Research 35: 171–179.
11. Cleland EE, Chiariello NR, Loarie SR, Mooney HA, Field CB. (2006) Diverse responses of phenology to global changes in a grassland ecosystem. Proceedings of the National Academy of Sciences, USA 103: 13740–13744. PMID:16954189
12. Hovenden MJ, Wills KE, Chaplin RE, Vander Schoor JK, Williams AL, Osanai Y, et al. (2008) Warming and elevated CO2 affect the relationship between seed mass, germinability and seedling growth in
Austrodanthonia caespitosa, a dominant Australian grass. Global Change Biology 14: 1–9.
13. Sheppard S, Stanley MC. (2014) Does elevated temperature and doubled CO2increase growth of
three potentially invasive plants? Invasive Plant Science and Management 7: 237–246.
14. Xia J, Niu S, Wan S (2009) Response of ecosystem carbon exchange to warming and nitrogen addition during two hydraulically contrasting growing seasons in a temperate steppe. Global Change Biology 15: 1544–1556.
15. Dijkstra FA, Blumenthal D, Morgan JA, Pendall E, Carrillo Y, Follett RF. (2010) Contrasting effects of el-evated CO2and warming on nitrogen cycling in a semiarid grassland. New Phytologist 187: 426–437.
doi:10.1111/j.1469-8137.2010.03293.xPMID:20487311
16. Xia J, Wan S. (2013) Independent effects of warming and nitrogen addition on plant phenology in the Inner Mongolian steppe. Annals of Botany 111: 1207–1217. doi:10.1093/aob/mct079PMID: 23585496
17. Leuzinger S, Luo Y, Beier C, Dieleman W, Vicca S, Korner C. (2011) Do global change experiments overestimate impacts on terrestrial ecosystems? Trends in Ecology & Evolution 26: 236–241.
18. Verheyen K, Adriaenssens S, Gruwez R, Michalczyk IM, Ward LK, Rosseel Y, et al. (2009)Juniperus communis: victim of the combined action of climate warming and nitrogen deposition? Plant Biology 11: 49–59. doi:10.1111/j.1438-8677.2009.00214.xPMID:19778368
19. Didham RK, Tylianakis JM, Gemmell NJ, Rand TA, Ewers RM. (2007) Interactive effects of habitat modification and species invasion on native species decline. Trends in Ecology & Evolution 22: 489– 496.
20. Hellmann JJ, Byers JE, Bierwagen BG, Dukes JS. (2008) Five potential consequences of climate change for invasive species. Conservation Biology 22: 534–543. doi:10.1111/j.1523-1739.2008. 00951.xPMID:18577082
21. Eisenhauer N, Fisichelli NA, Frelich LE, Reich PB. (2012) Interactive effects of global warming and ‘global worming’on the initial establishment of native and exotic herbaceous plant species. Oikos 121: 1121–1133.
22. Wu ZT, Dijkstra P, Koch GW, Penuelas J, Hungate BA. (2011) Responses of terrestrial ecosystems to temperature and precipitation change: a meta-analysis of experimental manipulation. Global Change Biology 17: 927–942.
23. Aerts R. (2006) The freezer defrosting: global warming and litter decomposition rates in cold biomes. Journal of Ecology 94: 713–724.
24. Dieleman WIJ, Vicca S, Dijkstra FA, Hagedorn F, Hovenden MJ, Larsen KS, et al. (2012) Simple addi-tive effects are rare: a quantitaaddi-tive review of plant biomass and soil process responses to combined ma-nipulations of CO2 and temperature. Global Change Biology 18: 2681–2693. doi: 10.1111/j.1365-2486.2012.02745.xPMID:24501048
25. Kareiva PM, Kingsolver JG, Huey RB (eds.) (1993) Biotic interactions and global change. Sunderland, Massachusetts: Sinauer Associates: 559.
26. Pino J, Maria Segui J, Alvarez N. (2006) Invisibility of four plant communities in the Llobregat delta (Cat-alonia, NE of Spain) in relation to their historical stability. Hydrobiologia 570: 1573–5117.
27. Rustad LE, Campbell JL, Marion GM, Norby RJ, Mitchell MJ, Hartley AE, et al. (2001) A meta-analysis of the response of soil respiration, net nitrogen mineralization, and aboveground plant growth to experi-mental ecosystem warming. Oecologia 126: 543–562.
28. Blankinship JC, Niklaus PA, Hungate BA. (2011) A meta-analysis of responses of soil biota to global change. Oecologia 165: 553–565. doi:10.1007/s00442-011-1909-0PMID:21274573
29. Woodward FI, Kelly CK. (2008) Responses of global plant diversity capacity to changes in carbon diox-ide and climate. Ecology Letters 11: 1229–1237. doi:10.1111/j.1461-0248.2008.01240.xPMID: 18803643
30. Vila M, Espinar JL, Hejda M, Hulme PE, Jarosik V, Maron JL, et al. (2011) Ecological impacts of inva-sive alien plants: a meta-analysis of their effects on species, communities and ecosystems. Ecology Letters 14: 702–708. doi:10.1111/j.1461-0248.2011.01628.xPMID:21592274
31. Gornish ES. (2014) Demographic effects of warming, elevated soil nitrogen, and native community re-duction on the colonization of a perennial plant. Population Ecology 5: 545–656.
33. Marion GM, Henry GHR, Frechman DW. (1997) Open-top designs for manipulating field temperature in high-latitude ecosystems. Global Change Biology 3: 20–32.
34. Dullinger S, Willner W, Plutzar C, Englisch T, Schratt-Ehrendorfer L, Moser D, et al. (2012) Post-glacial migration lag restricts range filling of plants in the European Alps. Global Ecology & Biogeography 8: 829–840.
35. Richards JH, Caldwell MM. (1987) Hydraulic life: Substantial nocturnal water transport between soil lay-ers byArtemisia tridentataroots. Oecologia 73: 486–489.
36. Smart RE, Bingham GE. (1974) Rapid estimates of relative water content. Plant Physiology 53: 258– 260. PMID:16658686
37. Feeny P. (1970) Seasonal changes in oak leaf tannins and nutrients as a cause of spring feeding by winter moth caterpillars. Ecology 51: 565–581.
38. Schurch S, Roy BA. (2004) Comparing single- vs. mixed-genotype infections ofMycosphaerella grami-nicolaon wheat: effects on pathogen virulence and host tolerance. Evolutionary Ecology 18: 1–14.
39. McCune B, Grace JB. (2002) Analysis of Ecological Communities. MjM Software Design, Gleneden Beach, OR, USA.
40. Arbuckle JL. (2006) Amos (Version 7.0) [Computer Program]. Chiago: SPSS.
41. Grace J. (2006) Structural Equation Modeling and Natural Systems. Cambridge University Press.
42. Grace J. (2003) Examining the relationship between environmental variables and ordination axes using latent variables and structural equation modeling. In: Structural Equation Modeling (Pugesek BH, Tomer A, Von Eye A, eds.) Cambridge University Press. PMID:20157639
43. Bentler PM. (1990) Comparative fit indexes in structural models. Psychological Bulletin 107: 238–246. PMID:2320703
44. Cheung GW, Rensvold RB. (2002) Evaluating goodness-of-fit indexes for testing measurement invari-ance. Structural Equation Modeling 9: 233–255.
45. Weligama C, Sale PW, Conyers MK, Liu DL, Tang C. (2010) Nitrate leaching stimulated subsurface root growth of wheat and increases rhizosphere alkalization in a highly acidic soil. Plant and Soil 328: 119–132.
46. Pavlovkin J, Pal’ove-Balang P, Kalarovic L Zelinova V. (2009) Growth and functional responses of dif-ferent cultivars ofLotus corniculatusto aluminum and los pH stress. Journal of Plant Physiology 166: 1479–1487. doi:10.1016/j.jplph.2009.03.005PMID:19409655
47. Kobayashi O, Higuchi K, Miwa E, Tadano T. (2010) Growth injury induced by high pH in rice and toma-to. Soil Science and Plant Nutrition 56: 407–411.
48. Parsons WFJ, Ehrenfeld JG, Handel SN. (1998) Vertical growth and mycorrhizal infection of woody plant roots as potential limits to the restoration of woodlands on landfills. Restoration Ecology 6: 280– 289.
49. Giesler R, Hogberg M, Hogberg P. (1998) Soil chemistry and plants in Fennoscandia boreal forest as exemplified by a local gradient. Ecology 79: 119–137.
50. Ehrenfeld JG. (2003) Effects of exotic plant invasions on soil nutrient cycling processes. Ecosystems 6: 503–523.
51. Ainsworth A. (2010) Interactions of fire and nonnative species across an elevation/plant community gra-dient in Hawaii Volcanoes National Park. Biotropica 42: 647–655.
52. Kidron GJ. (2009) The effect of shrub canopy upon surface temperatures and evaporation in the Negev Desert. Earth Surface Processes and Landforms 34: 123–132.
53. Wolkovich EM, Bolger DT, Cottingham KL. (2009) Invasive grass litter facilitates native shrubs through abiotic effects. Journal of Vegetation Science 20: 1121–1132.
54. Chapin FS, Shaver GR, Giblin AE, Nadelhoffer KJ. Laundre JA. (1995) Responses of arctic tundra to experimental and observed changes in climate. Ecology 76: 694–711.
55. Grime JP. (2002) Declining plant diversity: empty niches or functional shifts? Journal of Vegetation Sci-ence 13: 457–460.
56. Zavaleta ES, Hulvey KB. (2004) Realistic species losses disproportionately reduce grassland resis-tance to biological invaders. Science 306: 1175–1177. PMID:15539600
57. Hawkes CV, Sullivan JJ. (2001) The impact of herbivory on plants in different resource conditions: A meta-analysis. Ecology 82: 2045–2058.
58. Richardson DM, Pysek P. (2006) Plant invasions: merging the concepts of species invasiveness and community invisibility. Progress in Physical Geography 30: 409–431.
60. Post ES, Pedersen C, Wilmers CC, Forchhammer MC. (2008) Phenological sequences reveal aggre-gate life history response to climatic warming. Ecology 89: 363–370. PMID:18409426
61. Inouye DW. (2008) Effects of climate change on phenology, frost damage, and floral abundance of montane wildflowers. Ecology 89: 353–362. PMID:18409425
62. Le Guigo P, Rolier A, Le Corff JL. (2012) Plant neighborhood influences colonization of Brassicaceae by specialist and generalist aphids. Oecologia 169: 753–761. doi:10.1007/s00442-011-2241-4PMID: 22218942
63. Logan JA, Regniere J, Powell JA. (2003) Assessing the impacts of global warming on forest pest dy-namics. Frontiers in Ecology and the Environment 1: 130–137.