Metabolic and Kidney Disorders Correlate
with High Atazanavir Concentrations in
HIV-Infected Patients: Is It Time to Revise
Atazanavir Dosages?
Cristina Gervasoni1*, Paola Meraviglia1, Davide Minisci1, Laurenzia Ferraris1, Agostino Riva1, Simona Landonio1, Valeria Cozzi2, Nitin Charbe2, Lara Molinari1, Giuliano Rizzardini1,5, Emilio Clementi3,4, Massimo Galli1, Dario Cattaneo2
1Department of Infectious Disease, L. Sacco University Hospital, Milan, Italy,2Unit of Clinical
Pharmacology, L. Sacco University Hospital, Milan, Italy,3Clinical Pharmacology Unit, Consiglio Nazionale delle Ricerche Institute of Neuroscience, Department of Biomedical and Clinical Sciences, L. Sacco University Hospital, Universitàdegli Studi di Milano, Milan, Italy,4E. Medea Scientific Institute, Bosisio Parini, Italy,5School of Clinical Medicine, Faculty of Health Science, University of the Witwatersrand, Johannesburg, South Africa
*cristina.gervasoni@unimi.it
Abstract
Introduction
Ritonavir-boosted atazanavir (ATV/r) is a relatively well tolerated antiretroviral drug. Howev-er, side effects including hyperbilirubinemia, dyslipidemia, nephrolithiasis and cholelithiasis have been reported in the medium and long term. Unboosted ATV may be selected for some patients because it has fewer gastrointestinal adverse effects, less hyperbilirubinemia and less impact on lipid profiles.
Methods
We investigated the distribution of ATV plasma trough concentrations according to drug dosage and the potential relationship between ATV plasma trough concentrations and drug-related adverse events in a consecutive series of 240 HIV-infected patients treated with ATV/r 300/100 mg (68%) or ATV 400 mg (32%).
Results
43.9% of patients treated with ATV/r 300/100 mg had ATV concentrations exceeding the upper therapeutic threshold. A significant and direct association has been observed between the severity of hyperbilirubinemia and ATV plasma trough concentrations (ATV concentra-tions: 271 [77–555], 548 [206–902], 793 [440–1164], 768 [494–1527] and 1491 [1122–1798] ng/mL in patients with grade 0, 1, 2, 3 and 4 hyperbilirubinemia, respectively). In an explorato-ry analysis we found that patients with dyslipidemia or nephrolitiasis had ATV concentrations significantly higher (582 [266–1148], and 1098 [631–1238] ng/mL, respectively) (p<0.001), as compared with patients with no ATV-related complications (218 [77–541] ng/mL).
OPEN ACCESS
Citation:Gervasoni C, Meraviglia P, Minisci D, Ferraris L, Riva A, Landonio S, et al. (2015) Metabolic and Kidney Disorders Correlate with High Atazanavir Concentrations in HIV-Infected Patients: Is It Time to Revise Atazanavir Dosages?. PLoS ONE 10(4): e0123670. doi:10.1371/journal.pone.0123670
Academic Editor:Carlo Federico Perno, University of Rome Tor Vergata, ITALY
Received:June 25, 2014
Accepted:March 6, 2015
Published:April 15, 2015
Copyright:© 2015 Gervasoni et al. This is an open access article distributed under the terms of the Creative Commons Attribution License, which permits unrestricted use, distribution, and reproduction in any medium, provided the original author and source are credited.
Data Availability Statement:All relevant data are within the paper.
Funding:The authors have no support or funding to report.
Competing Interests:The authors have declared
Conclusions
A significant proportion of patients treated with the conventional dosage of ATV (300/100) had plasma concentrations exceeding the upper therapeutic threshold. These patients that are at high risk to experience ATV-related complications may benefit from TDM-driven ad-justments in ATV dosage with potential advantages in terms of costs and toxicity.
Introduction
Ritonavir-boosted atazanavir (ATV/r) is one of the two protease inhibitors (PI) selected as the preferred choices in the American Department of Health and Human Services (DHHS) and European guidelines for the initial treatment of patients infected with human immunodeficien-cy virus-1 (HIV-1) [1,2]. This drug is relatively well tolerated in most patients; however, side ef-fects including hyperbilirubinemia, which may result in visible jaundice or scleral icterus, dyslipidemias, nephrolithiasis and cholelithiasis have been reported in the medium and long term [3–6]. Ritonavir enhanced ATV concentrations and improved virologic activity more than unboosted ATV [7]. Nevertheless, unboosted ATV may be selected for some patients be-cause it has fewer gastrointestinal adverse effects, less hyperbilirubinemia and less impact on lipid profiles than ATV/r.
Therapeutic drug monitoring (TDM) of ATV plasma trough concentrations is adopted for the routine management of patients only in a minority of centres worldwide. However, consid-erable inter-individual variability has been observed in plasma concentrations of ATV after standard dosing, mainly related to drug-to-drug interactions and inherited differences in the hepatic metabolism [8–12]. Significant correlations have been reported between plasma ATV trough concentrations and clinical outcome. In treatment-experienced as well as naïve HIV pa-tients the highest probability of achieving undetectable viral load has been associated with ATV plasma concentrations>150 ng/mL [11–14]. Accordingly, this threshold concentration
is currently recommended by international guidelines for the optimal management of patients on ATV-based antiretroviral regimens [15]. More scanty data are available concerning the rela-tionships between ATV exposure and toxicity. A threshold ATV concentration of 800 ng/mL has been proposed as a risk factor for hyperbilirubinemia [14,16,17], whereas no specific asso-ciations have been reported for other ATV-related complications.
In the present study we sought to: I) assess the distribution of ATV plasma trough concen-trations in HIV-infected patients according to drug dosage and II) verify a direct association between ATV plasma concentration and the degree of hyperbilirubinemia. As an exploratory analysis we also investigated the potential relationship between ATV concentrations and other drug-related adverse events (nephrolithiasis and dyslipidemia).
Materials and Methods
Study population
consent for diagnostic evaluations, drug administration and all other medical procedures/inter-ventions performed exclusively for routine treatment purposes) was collected to the first outpa-tient visit. Paoutpa-tients provided also written informed consent for their records (anonymized) to be used for future research purpose. In compliance with privacy laws, the patients’ identifica-tion code was encrypted before performing the statistical analyses. Given the retrospective ob-servational nature of the present investigation, no formal approval from the local ethics committee was required according to the legislation of the national drug agency.
Adherence of patients to therapy was verified through direct questioning during every out-patient visits. Data on self-reporting adherence were matched with data from our Pharmacy Department in order to verify that patients have accepted the package with the antiretrovirals dose required to fully cover the time between two visits. Only patients with high adherence to antiretroviral medications (above 95% of the doses) were considered.
Study design
This study is based on a retrospective analysis of routine TDM of ATV carried out as day-by-day clinical practice for the optimisation of drug dosing in HIV-infected patients between Jan-uary 2010 and May 2013. HIV-infected patients treated with ATV for at least three months and with one assessment of ATV plasma trough concentrations were included. ATV plasma trough concentrations were stratified as below, within or above the therapeutic window, which was set at 150–800 ng/mL according to the available literature [14,16,17].
Clinical information on ATV-related complications were recorded in each patient as fol-lows. Hyperbilirubinaemia was scored from grade 0 to grade 4 in accordance with the AIDS Clinical Trials Group Guidelines for total bilirubin levels [18]: grade 0 (<1.3 mg/dL); grade 1
(1.3–1.9 mg/dL); grade 2 (1.9–3.1 mg/dL); grade 3 (3.1–6.1 mg/dL); and grade 4 (>6.1 mg/dL).
Patients with the homozygous UGT1A128 genotype were excluded from the analysis (higher risk to experience hyperbilirubinemia irrespective of ATV plasma concentrations). Dyslipide-mia was defined by the concomitant presence of all these conditions: 1) total cholesterol>200
mg/dL or serum triglycerides>180 mg/dL; 2) at least a 20% increase in serum cholesterol or
serum triglyceride levels compared to baseline; 3) normal serum lipid levels at the last visit be-fore starting ATV. Nephrolitiasis was defined as episode of acute flank pain plus one of the fol-lowing: 1) new-onset hematuria confirmed by urine analysis, 2) documented presence of stones or radiological findings suggestive of renal stones 3) stone passage confirmed by either the patient or attending physician; in the absence of urinary oxalate or urate crystals and with normal value of serum uric acid. Patients with history of nephrolitiasis before starting treat-ment with ATV were not included in the present study.
Pharmacokinetic evaluations
gradient conditions on a reversed phase C18 column (Xbridge, 2.1X100 mm 3.5 microm parti-cle sizes, Waters, Milan, Italy) maintained at 50°C. Mass-spectrometric analysis was performed in positive electron spray ionisation mode. For quantification, multiple-reaction monitoring (MRM) mode was applied to monitor the transitions from the precursor ion (M+H)+ to the product ion (m/z 705.35 to m/z 335.3 for ATV). The method was linear over the ATV concen-tration ranges of 20 to 9000 ng/mL. The lower limit of quantification of the method set at 20 ng/mL. Between and within-day imprecision and inaccuracy were less than 15%, as requested by Consensus Guidelines on Bioanalytical Method Validations [20]. In addition our laboratory participates in an external quality control programme for the continuous monitoring of the method’s performance (the Dutch KKGT, available athttp://www.kkgt.nl).
Statistical analyses
Results were given as mean (± standard deviation) or median (plus interquartile range) accord-ing to distribution of the data based on results of the Kolmogorov-Smirnov normality test. ATV plasma trough concentrations were stratified according to drug dosage (ATV dose, fre-quency of daily drug administration and concomitant ritonavir use) and to therapeutic window (set at 150–800 ng/mL). All comparisons between two groups were carried out using the un-paired t test or Mann-Whitney test, whereas the ANOVA or Kruskall-Wallis tests were consid-ered when comparing more than 2 groups, according to the distribution of the data.
The independent association between plasma ATV concentrations and dyslipidemia was as-sessed by means of uni- and multi-variate regression analyses using the event (toxicity yes or no) as dichotomic dependent variable and as independent covariates clinical, demographic and pharmacologic data that resulted significantly associated with the event in the univariate models (MEDCALC, Software). A p value of less than 0.05 was considered as statistically significant.
Results
Patients
’
characteristics
Two-hundred forty HIV-infected adult patients were included in the present study. Demo-graphic and clinical data of at the time of TDM are listed inTable 1. Patients were at 901 ± 870 days of therapy with ATV, mainly treated at the conventional ATV/r dosage 300/100 mg qd (68%), given concomitantly with tenofovir-based antiretroviral regimens (56%). Ninety-two percent of them were Caucasians. Thirty-nine (16%) out of the 240 patients evaluated (28 on ATV 300/100 mg and 11 on ATV 400 mg) had detectable viral load at the time of TDM (medi-an, interquartile range 2.36, 1.97–3.25 log cp/mL).
Distribution of ATV plasma trough concentrations
A wide distribution was observed in the ATV plasma trough concentrations, with median values of 546 [204–1030] ng/mL, resulting in a mean inter-patient variability of 110.3%. Four percent of the determinations resulted<20 ng/mL. As expected, mean ATV plasma concentrations
were higher in patients using ritonavir-boosted ATV than in patients using unboosted ATV (given at 400 qd or 200 bid) (650 [357–1204] vs. 238 [99–551] ng/mL, p<0.0001).
As shown inFig 1, a significant proportion of patients with ATV plasma trough concentra-tions out of the therapeutic drug window were identified. 43.9% of patients treated with ATV 300/100 qd had ATV concentrations exceeding the upper therapeutic threshold, whereas unboosted ATV 400 mg was associated with the highest proportion of values<150 ng/mL
ATV plasma concentrations and hyperbilirubinemia
One-hundred forty-seven (61%) out of the 240 HIV-positive patients enrolled in the present study experienced hyperbilirubinemia of grade1. As shown inFig 2, a significant and direct association has been observed between the severity of hyperbilirubinemia and ATV plasma trough concentrations (ATV concentrations: 271 [77–555], 548 [206–902], 793 [440–1164], 768 [494–1527] and 1491 [1122–1798] ng/mL in patients with grade 0, 1, 2, 3 and 4 hyperbilir-ubinemia, respectively, with p<0.01 of grade 2, 3, and 4 vs. grade 0). The same trend was
con-firmed also when repeating the above mentioned comparisons stratifying data according to boosted or unboosted ATV intakers (Table 3).
ATV plasma concentrations and other drug-related adverse events
Overall, 55 out of the 240 HIV-positive patients developed dyslipidemia, namely hypercholester-olemia (n = 26, mean increase 46±22%) or hypertriglyceridemia (n = 45, mean increase
114±76%). Patients with dyslipidemia had ATV concentrations significantly higher as compared with patients with no ATV-related complications (582 [266–1148] vs. 218 [77–541] ng/mL, p<0.01). This was confirmed also when repeating the above mentioned comparisons according
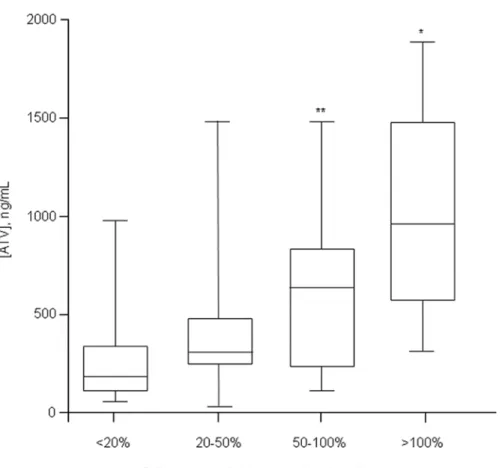
to ritonavir or not administration (Table 3). Moreover, in order to demonstrate a direct relation-ship between ATV concentrations and lipid increase, we attempted to correlate ATV concentra-tions with the magnitude of lipid levels increase as compared to baseline. Using this approach we found a direct association between ATV concentrations and the percentage increase in serum
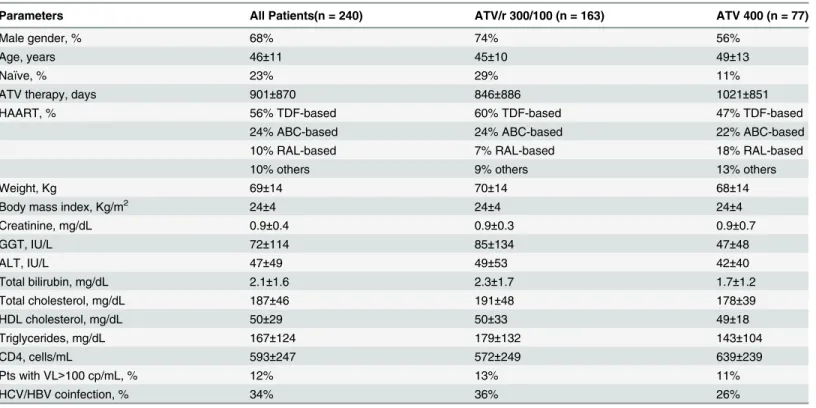
Table 1. Main demographic, hematologic and biochemical characteristics of HIV-positive patients receiving atazanavir as part of their antiretrovi-ral regimen.
Parameters All Patients(n = 240) ATV/r 300/100 (n = 163) ATV 400 (n = 77)
Male gender, % 68% 74% 56%
Age, years 46±11 45±10 49±13
Naïve, % 23% 29% 11%
ATV therapy, days 901±870 846±886 1021±851
HAART, % 56% TDF-based 60% TDF-based 47% TDF-based
24% ABC-based 24% ABC-based 22% ABC-based
10% RAL-based 7% RAL-based 18% RAL-based
10% others 9% others 13% others
Weight, Kg 69±14 70±14 68±14
Body mass index, Kg/m2 24±4 24±4 24±4
Creatinine, mg/dL 0.9±0.4 0.9±0.3 0.9±0.7
GGT, IU/L 72±114 85±134 47±48
ALT, IU/L 47±49 49±53 42±40
Total bilirubin, mg/dL 2.1±1.6 2.3±1.7 1.7±1.2
Total cholesterol, mg/dL 187±46 191±48 178±39
HDL cholesterol, mg/dL 50±29 50±33 49±18
Triglycerides, mg/dL 167±124 179±132 143±104
CD4, cells/mL 593±247 572±249 639±239
Pts with VL>100 cp/mL, % 12% 13% 11%
HCV/HBV coinfection, % 34% 36% 26%
TDF: tenofovir; ABC: abacavir; RAL: raltegravir; GGT: gamma-glutamyltransferase; ALT: alanine aminotransferase; HCV: hepatitis C virus; HBV: hepatitis B virus; VL: viral load
triglycerides levels (Fig 3). A similar, but not significant trend, was also observed for cholesterol (data not shown).
At univariate analysis ATV concentrations (p<0.001), concomitant HAART (p = 0.079),
ri-tonavir use (p = 0.009) and patients’gender (p = 0.046) were associated with the development of dyslipidemia, while no association was found with other clinical covariates (Table 4). In the multivariable regression analysis only ATV concentrations (p<0.01) and ritonavir use
(p = 0.02) remained independently associated with dyslipidemia.
Fig 1. Box-plot of atazanavir (ATV) plasma trough concentrations clustered according to drug dosage.Dashed lines represent the upper and lower limits of the therapeutic window of ATV concentrations (150–800 ng/mL).
doi:10.1371/journal.pone.0123670.g001
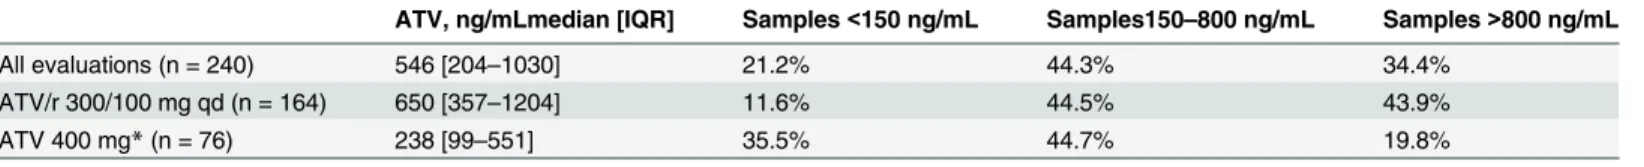
Table 2. Distribution of atazanavir (ATV) plasma trough concentrations according to daily drug dosage.
ATV, ng/mLmedian [IQR] Samples<150 ng/mL Samples150–800 ng/mL Samples>800 ng/mL
All evaluations (n = 240) 546 [204–1030] 21.2% 44.3% 34.4%
ATV/r 300/100 mg qd (n = 164) 650 [357–1204] 11.6% 44.5% 43.9%
ATV 400 mg*(n = 76) 238 [99–551] 35.5% 44.7% 19.8%
*given either as 400 mg qd or 200 mg bid; IQR: interquartile range
Eleven out of the 240 HIV-positive patients enrolled in the present study experienced epi-sodes of nephrolitiasis indirectly attributed to ATV after having excluded other clinical condi-tions predisposing to kidney stones. As shown inTable 3these patients were mainly treated with ritonavir (82%) and had ATV concentrations significantly higher as compared with
Fig 2. Box plot of ATV plasma trough concentrations clustered according to the grade of
hyperbilirubinemia (scored as grade 0, 1, 2, 3 or 4 based on total bilirubin concentrations below 1.3 mg/dL, between 1.3–1.9, 1.9–3.1, 3.1–6.1, or above 6.1 mg/dL, respectively).*p<0.01 vs grade 0.
doi:10.1371/journal.pone.0123670.g002
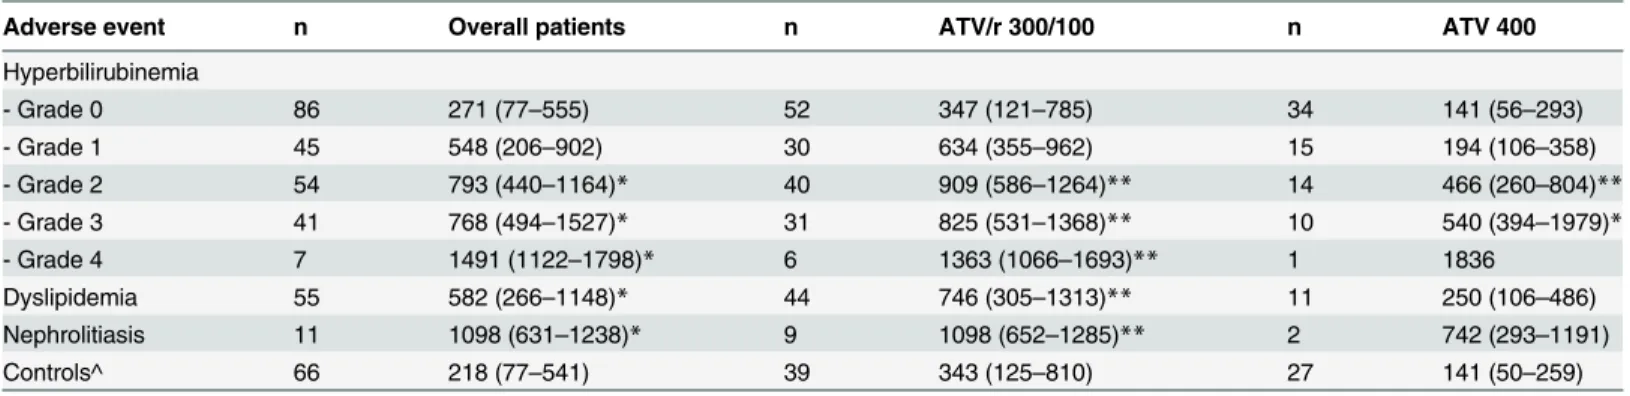
Table 3. Atazanavir (ATV) plasma trough concentrations measured in patients that did or did not experienced drug-related adverse events.
Adverse event n Overall patients n ATV/r 300/100 n ATV 400
Hyperbilirubinemia
- Grade 0 86 271 (77–555) 52 347 (121–785) 34 141 (56–293)
- Grade 1 45 548 (206–902) 30 634 (355–962) 15 194 (106–358)
- Grade 2 54 793 (440–1164)* 40 909 (586–1264)** 14 466 (260–804)**
- Grade 3 41 768 (494–1527)* 31 825 (531–1368)** 10 540 (394–1979)*
- Grade 4 7 1491 (1122–1798)* 6 1363 (1066–1693)** 1 1836
Dyslipidemia 55 582 (266–1148)* 44 746 (305–1313)** 11 250 (106–486)
Nephrolitiasis 11 1098 (631–1238)* 9 1098 (652–1285)** 2 742 (293–1191)
Controls^ 66 218 (77–541) 39 343 (125–810) 27 141 (50–259)
Data were stratified also according to ritonavir use. ^patients that did not develop ATV-related adverse events; *p<0.01 and
**p<0.05 vs. controls
Fig 3. Box plot of ATV plasma trough concentrations clustered according to the magnitude of triglyceride concentrations increase as compared to values measured at the last visit before starting ATV.*p<0.01 and**p<0.05 vs. patients experiencing20% increase (first column from the left).
doi:10.1371/journal.pone.0123670.g003
Table 4. Univariate and multivariate regression analysis of clinical, demographic and pharmacological covariates associated with the develop-ment of atazanavir (ATV)-related dyslipidemia.
Univariate Multivariate
Variable r-value p-value r- value p-value
Gender 0.14 0.046
Age 0.04 0.502
Body weight 0.04 0.469
Serum creatinine 0.01 0.616
ALT <0.01 0.276
GGT 0.01 0.172
HCV/HBV Coinfection 0.01 0.873
CD4 count 0.02 0.336
Concomitant ARV drugs 0.12 0.079
Days of ATV therapy <0.01 0.980
ATV concentrations 0.35 <0.001 0.33 <0.01
Ritonavir use 0.18 0.009 0.18 0.02
patients with no ATV-related complications (1098 [631–1238 vs. 218 [77–541] ng/mL, p<0.01). Only one out of 240 patients experienced an episode of cholelithiasis 226 days after
starting treatment with ATV (ATV plasma trough concentrations: 438 ng/mL).
Discussion and Conclusion
In this study, we document that a significant proportion of HIV-infected patients treated with ATV at the standard 300/100 mg qd dosage had plasma drug concentrations largely exceeding the upper therapeutic threshold, whereas nearly one third of patients treated with unboosted ATV had drug concentrations below 150 ng/mL, considered as the minimum concentration to be reached for the optimal management of patients on ATV-based antiretroviral regimens [15].
More than 60% of HIV-positive patients enrolled in the present study experienced hyperbi-lirubinemia of grade 1 or more, allowing us to deeply investigate the potential contribution of ATV concentrations on this drug-related adverse event. In our study we firstly confirmed the previously reported relationship between ATV exposure and the increase in total bilirubin con-centrations [14,16,17]. Moreover, we extended previous findings by documenting a direct and linear correlation between ATV trough concentrations and the severity of hyperbilirubinemia. Interestingly, such relationship was established also when excluding patients homozygous for the UGT1A1
28, the genotype associated with a defect in the metabolism of bilirubin [21,22]. Using this approach, we demonstrated that association of ATV exposure with hyperbilirubine-mia still persisted also in patients with the favourable UGT genotype. Accordingly, it could be speculated that in these patients, lacking of an inherited risk to experience the event, ATV-related hyperbilirubinemia might be eventually reversed by reducing ATV doses.
investigating the impact of ATV exposure on dyslipidemia in unboosted regimens. We also ac-knowledged that, as an important additional limitation, no information were available on ritona-vir exposure, because ritonaritona-vir concentrations are not assessed in the routine management of HIV patients. Accordingly, the potential contribution of ritonavir co-administration on episodes of dyslipidemia in patients treated with ATV cannot be completely ruled out.
Cases of complicated and uncomplicated ATV-associated nephrolithiasis have been de-scribed, sometimes leading to obstructive uropathy and acute renal failure [25–28]. The associ-ation between exposure to ATV and increased incidence kidney stones has been subsequently confirmed also by epidemiological studies [5,29]. To the best of our knowledge, our is the first report showing that overexposure to ATV is associated also with increased risk of nephrolitia-sis. It should be, however, acknowledged that as potential limitation of the present observation, the presence of ATV in the stones was not directly verified, and that episodes of drug-related nephrolitiasis were diagnosed indirectly after excluding the presence of oxalate or urate crystals in urinalysis and high value of serum uric acid.
The potential association between exposure to ATV and increased risk to cholelithiasis is still a matter of debate. Indeed, Hamada and co-workers reported a low incidence of complicat-ed cholelitiasis in patients on ATV comparable to other PIs [30]. These results have been par-tially challenged by recent findings from the same authors [31] reporting an increased risk of cholelithiasis in patients treated with ATV for more than two years. In our cohort, we found only one episode of cholelithiasis in a patient treated with ATV for less than one year.
In conclusion, in this study we documented that significant proportion of patients treated with conventional ATV dosages had plasma concentrations exceeding the upper therapeutic threshold. A likely possibility is an inherited deficit in ATV clearance [32] and/or ATV metab-olism; in particular, ATV is a dedicated CYP3A substrate, which includes 3A4 and 3A5, two polymorphic genes [8,9,10]. The administration of unboosted ATV to healthy subjects carrying the defective CYP3A5
3 resulted in significantly higher ATV concentrations compared with values measured in patients expressing CYP3A5 [21]. Assuming that over 90% of patients in our study were Caucasians with a high prevalence of carriers of CYP3A5
3, it is likely that the observed overexposure to ATV concentrations is the result of excessively high dose of ritona-vir-boosted ATV or of needless boosting with ritonavir. This is a first important conclusion of our study that raises concerns on the need of full dose of ritonavir-boosted ATV in Caucasian patients and opens new questions about the ATV dosages that should considered correct (or in label and off label in Europe). This may be particularly relevant in light of the recent findings showing that ritonavir may accumulate at intracellular level at higher degree than other PIs providing additional antiviral activity and eventually allowing the use of reduced PI doses [33]. We also found that such patients have the highest risk of experiencing ATV-related complica-tions and may benefit from TDM-driven adjustments in ATV dosage with potential advantages in terms of costs and toxicity.
Acknowledgments
We would like to thank Mrs Nadia Marazzi for data collection.
Funding: This study was carried out as part of our routine work. The Authors received no specific funding for this work.
Author Contributions
materials/analysis tools: VC NC DC. Wrote the paper: CG AR GR EC MG DC. Interacted with the patients as part of their routine outpatient clinical practice: CG PM DM LF AR SL.
References
1. Guidelines for the Use of Antiretroviral Agents in HIV-1-Infected Adults and Adolescents. (Downloaded fromhttp://aidsinfo.nih.gov/guidelineson 3/1/2014).
2. European AIDS Clinical Society. Guidelines version—October 2013. (Downloaded fromhttp://www. eacsociety.orgon 3/1/2014).
3. Laprise C, Baril JG, Dufresne S, Trottier H. Atazanavir and other determinants of hyperbilirubinemia in a cohort of 1150 HIV-positive patients: results from 9 years of follow-up. AIDS Patient Care STDS. 2013; 27:378–386. doi:10.1089/apc.2013.0009PMID:23829329
4. Jansen K, Sönnerborg A, Brockmeyer N, Thalme A, Svedhem V, Dupke S, et al. Long-term efficacy and safety of atazanavir/ritonavir treatment in a real-life cohort of treatment-experienced patients with HIV type 1 infection. AIDS Res Hum Retroviruses. 2013; 29:564–573. doi:10.1089/AID.2012.0092 PMID:23016535
5. Hamada Y, Nishijima T, Watanabe K, Komatsu H, Tsukada K, Teruya K, et al. High incidence of renal stones among HIV-infected patients on ritonavir-boosted atazanavir than in those receiving other prote-ase inhibitor-containing antiretroviral therapy. Clin Infect Dis. 2012; 55:1262–1269. doi:10.1093/cid/ cis621PMID:22820542
6. Podzamczer D, Andrade-Villanueva J, Clotet B, Taylor S, Rockstroh JK, Reiss P, et al. Lipid profiles for nevirapine vs. atazanavir/ritonavir, both combined with tenofovir disoproxil fumarate and emtricitabine over 48 weeks, in treatment-naïve HIV-1-infected patients (the ARTEN study). HIV Med. 2011; 12:374–382. doi:10.1111/j.1468-1293.2011.00917.xPMID:21518220
7. FocàE, Ripamonti D, Motta D, Torti C. Unboosted atazanavir for treatment of HIV infection: rationale and recommendations for use. Drugs. 2012; 72:1161–1173. doi: 10.2165/11631070-000000000-00000PMID:22646049
8. van Schaik RH, van der Heiden IP, van den Anker JN, Lindemans J. CYP3A5 variant allele frequencies in Dutch Caucasians. Clin Chem. 2002; 48:1668–1671. PMID:12324482
9. Evans WE, McLeod HL. Pharmacogenomics—drug disposition, drug targets, and side effects. N Engl J Med. 2003; 348:538–549. PMID:12571262
10. Wempe MF, Anderson PL. Atazanavir metabolism according to CYP3A5 status: an in vitro-in vivo as-sessment. Drug Metab Dispos. 2011; 39:522–527. doi:10.1124/dmd.110.036178PMID:21148251
11. Le Tiec C, Barrail A, Goujard C, Taburet AM. Clinical pharmacokinetics and summary of efficacy and tolerability of atazanavir. Clin Pharmacokinet 2005; 44:1035–1050. PMID:16176117
12. Solas C, Gagnieu MC, Ravaux I, Drogoul MP, Lafeuillade A, Mokhtari S, et al. Population pharmacoki-netics of atazanavir in human immunodeficiency virus-infected patients. Ther Drug Monit 2008; 30:670–673. doi:10.1097/FTD.0b013e3181897bffPMID:18806695
13. Gianotti N, Seminari E, Guffanti M, Boeri E, Villani P, Regazzi M, et al. Evaluation of atazanavir Ctrough, atazanavir genotypic inhibitory quotient, and baseline HIV genotype as predictors of a 24-week virologi-cal response in highly drug-experienced, HIV-infected patients treated with unboosted atazanavir. New Microbiol 2005; 28:119–125. PMID:16035256
14. Gonzalez de Requena D, Bonora S, Canta F, Marrone R, D’Avolio A, Sciandra M, et al. Atazanavir Ctrough is associated with efficacy and safety: definition of therapeutic range. 12thConference on Ret-roviruses and Opportinistic Infections, Boston, February 22–25, 2005. Abstract no.646.
15. Panel on antiretroviral guidelines for adults and adolescents (2013). Guidelines for the use of antiretro-viral agents in HIV-1-infected adults and adolescents. Available athttp://www.aidsinfo.nih.gov(lat ac-cess August 23, 2013).
16. Smith DE, Jeganathan S, Ray J. Atazanavir plasma concentrations vary significantly between patients and correlate with increased serum bilirubin concentrations. HIV Clin Trials 2006; 7:34–38. PMID: 16632461
17. Cleijsen RM, van de Ende ME, Kroon FP, Lunel FV, Koopmans PP, Gras L, et al. Therapeutic drug monitoring of the HIV protease inhibitor atazanavir in clinical practice. J Antimicrob Chemother. 2007; 60:897–900. PMID:17704117
18. Lennox JL, Landovitz RJ, Ribaudo HJ, Ofotokun I, Na LH, Godfrey C, et al. Efficacy and tolerability of 3 nonnucleoside reverse transcriptase inhibitor-sparing antiretroviral regimens for treatment-naive volun-teers infected with HIV-1: a randomized, controlled equivalence trial. Ann Intern Med. 2014;
19. Fayet A, Béguin A, Zanolari B, Cruchon S, Guignard N, Telenti A, et al. A LC-tandem MS assay for the simultaneous measurement of new antiretroviral agents: Raltegravir, maraviroc, darunavir, and etravir-ine. J Chromatogr B Analyt Technol Biomed Life Sci. 2009; 877:1057–69. doi:10.1016/j.jchromb.2009. 02.057PMID:19332396
20. FDA guidance for industry—Bioanalytical methdod validation. Center for drug evaluation and research, US Department for Health and Human Services, May 2001.
21. Anderson PL, Aquilante CL, Gardner EM, Predhomme J, McDaneld P, Bushman LR, et al. Atazanavir pharmacokinetics in genetically determined CYP3A5 expressors versus non-expressors. J Antimicrob Chemother. 2009; 64:1071–1079. doi:10.1093/jac/dkp317PMID:19710077
22. Rotger M, Taffe P, Bleiber G, Gunthard HF, Furrer H, Vernazza P, et al. Gilbert syndrome and the de-velopment of antiretroviral therapy-associated hyperbilirubinemia. J Infect Dis. 2005; 192:1381–1386. PMID:16170755
23. Carey D, Amin J, Boyd M, Petoumenos K, Emery S. Lipid profiles in HIV-infected adults receiving ata-zanavir and ataata-zanavir/ritonavir: systematic review and meta-analysis of randomized controlled trials. J Antimicrob Chemother. 2010; 65:1878–1888. doi:10.1093/jac/dkq231PMID:20554568
24. Ferraris L, ViganòO, Peri A, Tarkowski M, Milani G, Bonora S, et al. Switching to unboosted atazanavir reduces bilirubin and triglycerides without compromising treatment efficacy in UGT1A1*28 polymor-phism carriers. J Antimicrob Chemother. 2012 Sep; 67(9):2236–42. doi:10.1093/jac/dks175PMID: 22661571
25. Pacanowski J, Poirier JM, Petit I, Meynard JL, Girard PM. Atazanavir urinary stones in an HIV-infected patient. AIDS. 2006; 20(:2131. PMID:17053366
26. Chang HR, Pella PM. Atazanavir urolithiasis. N Engl J Med. 2006; 355:2158–2159. PMID:17108352
27. Anderson PL, Lichtenstein KA, Gerig NE, Kiser JJ, Bushman LR. Atazanavir-containing renal calculi in an HIV-infected patient. AIDS. 2007; 21:1060–1062. PMID:17457108
28. Chan-Tack KM, Truffa MM, Struble KA, Birnkrant DB. Atazanavir-associated nephrolithiasis: cases from the US Food and Drug Administration's Adverse Event Reporting System. AIDS. 2007; 21:1215–1218. PMID:17502736
29. Rockwood N, Mandalia S, Bower M, Gazzard B, Nelson M. Ritonavir-boosted atazanavir exposure is associated with an increased rate of renal stones compared with efavirenz, ritonavir-boosted lopinavir and ritonavir-boosted darunavir. AIDS. 2011; 25:1671–1673. doi:10.1097/QAD.0b013e32834a1cd6 PMID:21716074
30. Hamada Y, Nishijima T, Komatsu H, Teruya K, Gatanaga H, Kikuchi Y, et al. Is ritonavir-boosted ataza-navir a risk factor for cholelithiasis compared to other protease inhibitors? PLoS One 2013; 6:e69845. doi:10.1371/journal.pone.0069845PMID:23875004
31. Nishijima T, Shimbo T, Komatsu H, Hamada Y, Gatanaga H, Kikuchi Y, et al. Cumulative exposure to ri-tonavir-boosted atazanavir is associated with cholelithiasis in patient with HIV-1 infection. J Antimicrob Chemother 2013 [epub ahead of print].
32. Schipani A, Siccardi M, D'Avolio A, Baietto L, Simiele M, Bonora S, et al. Population pharmacokinetic modeling of the association between 63396C->T pregnane X receptor polymorphism and unboosted atazanavir clearance. Antimicrob Agents Chemother. 2010; 54:5242–50. doi:10.1128/AAC.00781-10 PMID:20921307