Association between phase angle, anthropometric
measurements, and lipid profile in HCV-infected
patients
Mariana de Souza Dorna,INara Aline Costa,IErick Prado de Oliveira,IILigia Yukie Sassaki,IFernando Gomes Romeiro,ISergio Alberto Rupp de Paiva,IMarcos Ferreira Minicucci,IGiovanni Faria SilvaI
IUniversidade Estadual Paulista Ju´lio de Mesquita Filho (UNESP), Department of Internal Medicine, Botucatu/SP, Brazil.IISchool of Medicine, Federal University of Uberlandia, Uberlandia/MG, Brazil.
OBJECTIVE:The objective of this study was to investigate the associations between phase angle, anthropometric measurements, and lipid profile in patients chronically infected with the hepatitis C virus.
METHODS:A total of 160 consecutive patients chronically infected with the hepatitis C virus and who received treatment at the hepatitis C outpatient unit of our hospital from April 2010 to May 2011 were prospectively evaluated. Bioelectrical impedance analysis, anthropometric measurements, and serum lipid profile analysis were performed.
RESULTS:Twenty-five patients were excluded. A total of 135 patients with a mean age of 49.8¡11.4 years were studied. Among these patients, 60% were male. The phase angle and BMI means were 6.5¡0.8
˚
and 26.5¡4.8 kg/ m2, respectively. Regarding anthropometric variables, mid-arm circumference, mid-arm muscle circumference, and arm muscle area had a positive correlation with phase angle. In contrast, when analyzing the lipid profile, only HDL was inversely correlated with phase angle. However, in multiple regression models adjusted for age and gender, only mid-arm circumference (p= 0.005), mid-arm muscle circumference (p= 0.003), and arm musclecircumference (p= 0.001) were associated with phase angle in hepatitis C virus-infected patients.
CONCLUSIONS:In conclusion, phase angle is positively correlated with anthropometric measures in our study. However, there is no association between phase angle and lipid profile in these patients. Our results suggest that phase angle is related to lean body mass in patients chronically infected with hepatitis C virus.
KEYWORDS: Phase Angle; Hepatitis C; Cholesterol; Anthropometry; Bioelectrical Impedance Analysis.
Dorna MS, Costa NA, Oliveira EP, Sassaki LY, Romeiro FG, Paiva SA, et al. Association between phase angle, anthropometric measurements, and lipid profile in HCV-infected patients. Clinics. 2013;68(12):1555-1558.
Received for publication onJune 11, 2013;First review completed onJuly 7, 2013;Accepted for publication onJuly 18, 2013
E-mail: mari_dorna@yahoo.com.br
Tel.: 014 3822-2969
& INTRODUCTION
It is estimated that over 170 million people worldwide have hepatitis C in its chronic form (1). Currently, aside from the established consequence of liver injury, chronic hepatitis C virus (HCV) infection is associated with some metabolic disorders. Several studies have highlighted the association between HCV infection and lipid metabolism; however, the relationship between lipid profile and body composition in HCV carriers is less clear (2–4). Although the importance of nutritional assessment in this population is
known, there is not yet a gold standard tool for assessing body composition in these subjects (5).
For more than 20 years, bioelectrical impedance analysis (BIA) has been used to assess body composition in several clinical situations. BIA measures the resistance to the move-ment of an electrical current through the body, allowing for the determination of the fat-free mass and total body water. The body offers two types of resistance to an electrical current, namely, capacitive Xc (reactance) and resistive (simply called resistance) resistance. One measurement of the relationship between capacitance and resistance is the phase angle (PhA), and its association with clinical outcomes has already been shown in different pathological situations (6–12).
There are few studies that have evaluated the association between PhA, anthropometric measures, and outcomes in patients with chronic liver disease. Selberg et al. showed that PhA was poorly correlated with disease severity (6). However, in their study, PhA was correlated with muscle mass and strength (6). In addition, Kahraman et al. evaluated 37 consecutive patients with HCV infection and
Copyrightß2013CLINICS– This is an Open Access article distributed under the terms of the Creative Commons Attribution Non-Commercial License (http:// creativecommons.org/licenses/by-nc/3.0/) which permits unrestricted non-commercial use, distribution, and reproduction in any medium, provided the original work is properly cited.
No potential conflict of interest was reported.
DOI:10.6061/clinics/2013(12)13
RAPID COMMUNICATION
showed that PhA reduction was associated with increased
side effects following pegylated interferon-a and ribavirin
treatment (12).
Although BIA is non-invasive, easy-to-use, portable, and inexpensive, this device is not available at all centers. Thus, in this scenario, anthropometric measures are one method for evaluating body composition (5). Despite the association between PhA and anthropometric data, chronically infected HCV patients have not yet been evaluated.
Therefore, the present study aimed to investigate the associations between PhA, anthropometric measures, and lipid profile in patients chronically infected with HCV.
& MATERIALS AND METHODS
Subjects
The present study was approved by the ethics committee of our institution, and written informed consent was obtained from all subjects. All patients chronically infected with HCV who underwent treatment at the hepatitis C outpatient unit of our hospital from April 2010 to May 2011 were prospectively evaluated. The inclusion criteria were naı¨ve patients or lack of treatment with pegylated interferon and ribavirin for at least 1 year, completion of liver biopsy, and clinical diagnosis of liver cirrhosis. The exclusion criteria were liver cirrhosis with ascites, hepatitis B virus infection, HIV infection, chronic kidney disease, heart failure, and pregnancy. Bioelectrical impedance analysis and anthropometric measurements were performed during the first hospital visit. The lipid profile was considered in cases where it had been measured up to three months prior to the evaluation.
Assessment of Body Composition
Body height and weight were measured and used to calculate the body mass index (BMI) (13). Mid-arm circumference (MAC) was measured using a measuring tape, as previously described (14). Triceps skinfold (TSF) was measured according to the standardization of Harrison et al. (15). Mid-arm muscle circumference (MAMC) and arm muscle area (AMA) were obtained from the
follow-ing respective formulas: MAMC = MAC-(p x TSF) and
MAMC = MAC-px(TSF/10) (16). All measurements were
performed by the same researcher.
Bioelectrical Impedance Analysis
BIA was conducted using a tetrapolar single-frequency
apparatus (Biodynamic-450, Biodynamics Corporation,
USA) that was applied to the skin using adhesive electrodes with the subject lying supine. PhA derived from the BIA was determined as previously described (17), and its values were calculated as follows: PhA = (arc tangent reactance/
resistance * (180
˚
/p)).Lipid Profile Data
Total cholesterol (TC), HDL-cholesterol (HDL), and triglycerides (TG) were measured using a dry-chemistry method. LDL-cholesterol (LDL) was calculated by the Friedwald formula.
Statistical Analysis
Data are expressed as the mean ¡ SD or the median
(including the lower and upper quartiles). The Spearman correlation was employed to evaluate the association
between continuous variables. Multiple linear regressions were used for PhA prediction and adjusted for gender and age. Data analysis was performed using Sigma Stat 3.5 for Windows (Systat Software, Inc., San Jose, CA, USA). P values lower than 0.05 were considered statistically significant.
& RESULTS
Of the 160 consecutive patients initially evaluated, 25 were excluded (10 had incomplete data, 4 had not under-gone liver biopsy, 8 had ascites, 1 was physically disabled, 1 had chronic kidney disease and 1 had heart failure). Thus, a
total of 135 patients with a mean age of 49.8¡11.4 y were
assessed. Demographic, anthropometric, and laboratory data are listed in Table 1. Of the included patients, 60%
were male. The PhA and BMI means were 6.5¡0.8
˚
and26.5¡4.8 kg/m2, respectively.
With regard to anthropometric variables, MAC, MAMC, and AMA presented a positive correlation with PhA. In contrast, when analyzing the lipid profile, only HDL was inversely correlated with PhA.
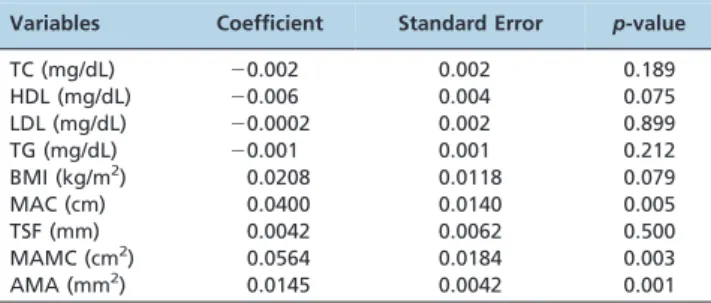
However, in multiple regression models adjusted for age
and gender, only MAC (p= 0.005), MAMC (p= 0.003), and
AMA (p= 0.001) were associated with PhA in HCV-infected
patients (Table 2).
& DISCUSSION
The present study aimed to investigate the associations between PhA, anthropometric measures, and lipid profile in patients chronically infected with HCV. In our study, the mid-arm circumference, mid-arm muscle circumference, and arm muscle area were associated with PhA. There was no association between PhA and lipid profile in these patients.
PhA has been suggested as an indicator of cellular health, where higher values reflect higher cellularity, better cell membrane integrity, and better cell function. In healthy adults, age, gender, and BMI are the major determinants of PhA (7). Because PhA is a marker of the amount and quality
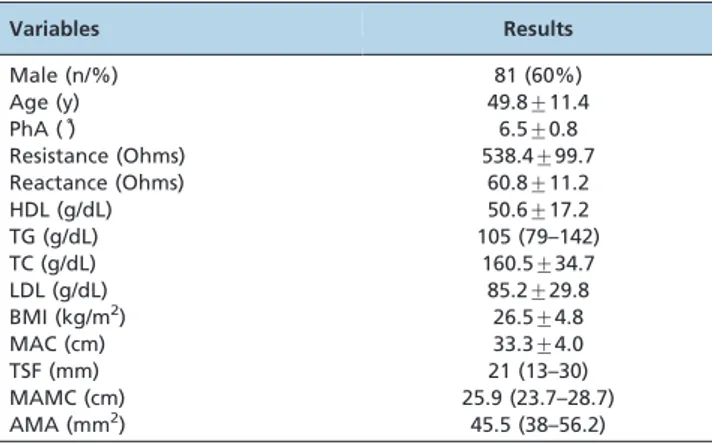
Table 1 -Demographic, anthropometric, and laboratory data from 135 patients with HCV.
Variables Results
Male (n/%) 81 (60%)
Age (y) 49.8¡11.4
PhA (˚) 6.5¡0.8
Resistance (Ohms) 538.4¡99.7
Reactance (Ohms) 60.8¡11.2
HDL (g/dL) 50.6¡17.2
TG (g/dL) 105 (79–142)
TC (g/dL) 160.5¡34.7
LDL (g/dL) 85.2¡29.8
BMI (kg/m2) 26.5
¡4.8
MAC (cm) 33.3¡4.0
TSF (mm) 21 (13–30)
MAMC (cm) 25.9 (23.7–28.7)
AMA (mm2) 45.5 (38–56.2)
PhA: phase angle; total cholesterol: TC; HDL-cholesterol: HDL;
triglycerides: TG; LDL-cholesterol: LDL; BMI: body mass index; MAC: mid-arm circumference; TSF: triceps skinfold; MAMC: mid-mid-arm muscle circumference; AMA: arm muscle area. Data are expressed as the mean¡ SD, median (lower to upper quartile), or percentage.
Phase angle and body composition
Dorna MS et al. CLINICS 2013;68(12):1555-1558
of soft tissue mass and hydration, it has been considered a useful indicator of nutritional status (7).
Several studies found a strong correlation between nutritional status and PhA in patients with gastrointestinal and renal diseases, older adult patients, and patients with anorexia nervosa (18–21). Maggiore et al. demonstrated in hemodialysis patients who albumin, age, subjective global assessment, and protein catabolic rate were associated with PhA (22). However, other studies failed to show these associations (7,23).
Despite these controversies concerning the results, a low PhA is associated with malnutrition, and mortality in some disease states. In patients with liver diseases, the association between PhA and nutritional status is not well established. In a study of cirrhotic patients with multiple etiologies, Selberg et al. showed that PhA discriminated poorly between cirrhosis patients of different Child-Pugh classes, although it was positively correlated with muscle area mass and muscle strength (6).
It is interesting to note that, in our study, there was no correlation between PhA and BMI, although PhA was positively correlated with MAMC and AMA. These results suggest that PhA is more closely correlated with lean body mass than with fat body mass in patients chronically infected with HCV.
In addition to alterations in body composition, HCV infection and its treatment interfere with the lipid profile. Several studies showed that HCV infection may be associated with lower serum cholesterol and triglyceride levels (24–25). Some studies also demonstrated that the plasma lipid profile may be a predictor of therapeutic response in patients with HCV (26–27).
Cholesterol and lipoproteins are required not only for the entry of HCV into hepatocytes but also for its viral assembly and replication (27). The LDL receptor was reported to facilitate HCV endocytosis into the liver; thus, high LDL may compete with HCV and limit the spread of the virus in hepatocytes (28). In addition, cholesterol is synthesized in the liver through the mevalonate pathway, which is also important for viral replication (2).
As stated previously, higher PhA values were associated with better nutritional status. In addition, higher levels of serum lipids were correlated with better outcomes in patients with HCV infection. Thus, our hypothesis was that PhA may also be associated with lipid profile in these patients. Despite all these studies, the relationship between
the PhA and lipid profile in these patients has not yet been evaluated. In our study, PhA was not correlated with lipid profile when data were adjusted for age and gender. In agreement with our results, Santarpia et al. demonstrated the absence of a correlation between PhA and cholesterol in patients with advanced cancer (8).
An important implication of our results is that when BIA is not available, anthropometric measures, which can be used to estimate lean body mass, could be an alternative method of evaluating body composition in patients chroni-cally infected with HCV.
Finally, we should consider the major limitations of the present study, namely, its small sample size and the fact that all of the patients had undergone treatment at a single medical center. In addition, for the BIA, we used a single-frequency apparatus that may have led to biased results in patients with extracellular fluid overload.
In conclusion, PhA was positively correlated with mid-arm circumference, mid-mid-arm muscle circumference, and arm muscle area in our study. However, there was no association between PhA and lipid profile in these patients. Our results suggest that PhA is related to lean body mass in patients chronically infected with HCV.
& ACKNOWLEDGMENTS
This work was supported by CAPES (‘‘Coordenac¸a˜o de Aperfeic¸oamento de Pessoal de Nı´vel Superior’’).
& AUTHOR CONTRIBUTIONS
Dorna MS collected the data and contributed to the conception and design of the study. Costa NA and Oliveira EP collected the data. Sassaki LY and Romeiro FG contributed to the design of the study and translation of the manuscript into English. Paiva SA performed the statistical analysis. Minicucci MF and Silva GF contributed to the conception and design of the study.
& REFERENCES
1. Kawaguchi Y, Mizuta T, Oza N, Takahashi H, Ario K, Yoshimura T, et al. Eradication of hepatitic C virus by interferon improves whole-body insulin resistance and hyperinsulinaemia in patients with chronic hepatitis C. Liver Inter. 2009:29(6):871-7, http://dx.doi.org/10.1111/j. 1478-3231.2009.01993.x.
2. Butt AA, Umbleja T, Andersen JW, Sherman KE, Chung TR, ACTG A5178 Study Team. Impact of piginterferon alpha and ribavirin treatment on lipid profiles and insulin resistance in hepatitis C virus/ HIV-coinfected persons: The AIDS clinical trials group A5178 study. CID. 2012;55(5):631-8, http://dx.doi.org/10.1093/cid/cis463.
3. Kuo YH, Chuang TW, Hung CH, Cheng CH, Wang JH, Hu TH, et al. Reversal hypolipidemia in chronic hepatitis C patients after successful antiviral therapy. J Formos Med Assoc. 2012;110(6):363-71.
4. Corey KE, Kane E, Munroe C, Barlow LL, Zheng H, Chung RT. Hepatitis C virus infection and its clearance alter circulating lipids: implications for long term follow-up. Hepatology. 2009;50(4):1030-7, http://dx.doi. org/10.1002/hep.23219.
5. Campillo B. 2010. Assessment of nutritional status and diagnosis of malnutrition in patients with liver disease. In: Nutrition, Diet Therapy and The Liver, First Edition, ed. Preedy, VR; Lakshman R, Srirajaskanthan R, Watson RR. 33-46. CRC Press: Taylor&Francis Group. USA.
6. Selberg O, Selberg D. Norms and correlates of bioimpedance phase angle in healthy human subjects, hospitalized patients, and patients with liver cirrhosis. Eur J Appl Physiol. 2002;86(6):509-16.
7. Norman K, Stoba¨us N, Pirlich M, Bosy-Whestphal A. Bioelectrical phase angle and impedance vector analysis- clinical relevance and applicability of impedance parameters. Clin Nutr. 2012;31(6):854-61, http://dx.doi. org/10.1016/j.clnu.2012.05.008.
8. Santarpia L, Marra M, Montagnese C, Alfonsi L, Pasanisi F, Contaldo F. Prognostic significance of bioelectrical phase angle in advanced caˆncer: preliminar observations. Nutrition. 2009;25(9):930-1, http://dx.doi.org/ 10.1016/j.nut.2009.01.015.
Table 2 -Multiple linear regression models for phase angle prediction, adjusted for gender and age.
Variables Coefficient Standard Error p-value
TC (mg/dL) 20.002 0.002 0.189
HDL (mg/dL) 20.006 0.004 0.075
LDL (mg/dL) 20.0002 0.002 0.899
TG (mg/dL) 20.001 0.001 0.212
BMI (kg/m2) 0.0208 0.0118 0.079
MAC (cm) 0.0400 0.0140 0.005
TSF (mm) 0.0042 0.0062 0.500
MAMC (cm2) 0.0564 0.0184 0.003
AMA (mm2) 0.0145 0.0042 0.001
Total cholesterol: TC; HDL-cholesterol: HDL; triglycerides: TG; LDL-cholesterol: LDL; BMI: body mass index; MAC: mid-arm circumference; TSF: triceps skinfold; MAMC: mid-arm muscle circumference; AMA: arm muscle area.
CLINICS 2013;68(12):1555-1558 Phase angle and body composition
Dorna MS et al.
9. Barbosa-Silva MC, Barros AJ. Bioelectrical impedance analysis in clinical practice: a new perspective on its use beyond body composition equations. Curr Opin Clin Nutr Metab Care. 2005;8(3):311-7, http://dx. doi.org/10.1097/01.mco.0000165011.69943.39.
10. Kyle UG, Genton L, Pichard C. Low phase angle determined by bioelectrical impedance analysis is associated with malnutrition and nutritional risk at hospital admission. Clin Nutr. 2013;32(2):194-9. 11. Plauth M, Cabre´ E, Riggio O, Assis-Camilo M, Pirlich M, Kondrup J.
Espen Guidelines on Enteral Nutrition: Liver Disease. Clin Nutr. 2006;25(2):285-94, http://dx.doi.org/10.1016/j.clnu.2006.01.018. 12. Kahraman A, Hilsenbeck J, Nyga M, Ertle J, Wree A, Plauth M, et al.
Bioelectrical impedance analysis in clinical practice:implications for hepatitis C therapy BIA and hepatitis C. Virol J. 2010;16(7):191. 13. World Health Organization. Obesity:preventing and managing the
global epidemic. Geneva: World Health Organization; 1997.
14. Callaway CW, Chumlea WC, Bouchard C, Himes JH, Lohman TG, Martin AD, et al. Circumferences. In: Lohman TG, Roche AF, Martorell R, editors. Anthropometric standardizing reference manual. Champaign, Il: Human Kinetics Books;1991.p.39-54.
15. Harrison GG, Buskirk EK, Carter JEL,Ohmston JFE, Lohman TG, Pollock ML, et al. Skinfold thicknesses and measurements technique. In: Lohman TG, Roche AF, Martorell R, editors. Anthropometric standardizing reference manual. Champaign, Il: Human Kinetics Books;1991. 55-80. 16. Frisancho AR. Anthropometric standards for the assessment of growth
and nutritional status. Michigan: The University of Michigan Press; 1990.p.48-53.
17. Kyle UG, Soundar EP, Genton L, Pichard C. Can phase angle determined by bioelectrical impedance analysis assess nutritional risk? A comparison between healthy and hospitalized subjects. Clin Nutr. 2012;31(6):875-81. 18. Oliveira CM, Kubrusly M, Mota RS, Silva CA, Choukroun G, Oliveira VN. The phase angle and mass body cell as markers of nutritional status in hemodialysis patients. J Ren Nutr. 2010;20(5):314-20.
19. Norman K, Smoliner C, Valentini L, Lochs H, Pirlich M. Is bioelectrical impedance vector analysis of value in the elderly with malnutrition and impaired functionality? Nutrition. 2007;23(7-8):564-9, http://dx.doi.org/ 10.1016/j.nut.2007.05.007.
20. Norman K, Smoliner C, Kilbert A, Valentini L, Lochs H, Pirlich M. Disease-related malnutrition but not underweight by BMI is reflected by disturbed electric tissue properties in the bioelectrical impedance vector analysis. Br J Nutr. 2008;100(3):590-5.
21. Scalfi L, Marra M, Caldara A, Silvestri E, Contaldo F. Changes in bioimpedance analysis after stable refeeding of undernourished anorexic patients. Int J Obes Relat Metab Disord. 1999;23(2):133-7, http://dx.doi. org/10.1038/sj.ijo.0800780.
22. Maggiore Q, Nigrelli S, Ciccarelli C, Grimaldi C, Rossi GA, Michelassi C. Nutritional and prognostic correlates of bioimpedance indexes in hemodialysis patients. Kidney Int. 1996;50(6):2103-8, http://dx.doi. org/10.1038/ki.1996.535.
23. Gupta D, Lis CG, Dahlk SL, King J, Vashi PG, Grutsch J, et al. The relationship between bioelectrical impedance phase angle and subjective global assessment in advanced colorectal cancer. Nutr J. 2008;30(7):19, http://dx.doi.org/10.1186/1475-2891-7-19.
24. Perlemuter G, Sabile A, Letteron P, Voga G, Topillo A, Chre´tien Y, et al. Hepatitis C virus core protein inhibits microsomal triglyceride transfer protein activity and very low density lipoprotein secretion: a model of viral-related steatosis. FASEB J. 2002;16(2):185-94, http://dx.doi.org/10. 1096/fj.01-0396com.
25. Hsu CS, Liu CJ, Liu CH, Chen CL, Lai MY, Chen PJ, et al. Metabolic profiles in patients with chronic hepatitis C: a case-control study. Hepatol Int. 2008;2(2):250-7, http://dx.doi.org/10.1007/s12072-008-9064-3.
26. Gopal K, Johnson TC, Gopal S, Wasfish A, Bang CT, Suwandhi P, et al. Correlation between beta-lipoprotein levels and outcome of hepatitis C treatment. Hepatology. 2006;44(2):335-40, http://dx.doi.org/10.1002/ hep.21261.
27. Kuo YH, Chuang TW, Hung CH, Chen CH, Wang JH, Hu TH, et al. Reversal of hypolipidemia in chronic hepatitis C patients after successful antiviral therapy. J Formos Med Assoc. 2011;110(6):363-71, http://dx. doi.org/10.1016/S0929-6646(11)60054-5.
28. Andre´ P, Komurian-Pradel F, Deforges S, Perret M, Berland JL, Sodoyer M, et al. Characterization of low- and very-low-density hepatitis C virus RNA-containing particles. J Virol. 2002;76(14):6919-28, http://dx.doi. org/10.1128/JVI.76.14.6919-6928.2002.
Phase angle and body composition
Dorna MS et al. CLINICS 2013;68(12):1555-1558