Methods and Teaching Strategies Used by
Teacher Education Faculty Members in one
State University in the Philippines
Amado C. Ramos (Ph. D)
Pangasinan State University, Bayambang Campus, Philippines [email protected]
Date Received: November 3, 2015; Date Revised: December 29, 2015
Asia Pacific Journal of Multidisciplinary
Research Vol. 3 No.5, 36-44 December 2015 Part III P-ISSN 2350-7756 E-ISSN 2350-8442
www.apjmr.com
Abstract - Institutions of higher learning across the nation are responding to political, economic, social and technological pressures to be more responsive to students' needs and more concerned about how well students are prepared to assume future societal roles. This study aimed to determine the methods and teaching strategies used by the PSU – CTE faculty members of Bayambang Campus, Bayambang, Pangasinan during the first semester of the school year 2013-2014. The descriptive-correlational method of research was employed in this study where it involved the collection of pertinent data in order to answer questions concerning the current status of the subject of the study. Majority of the faculty members are females, they are master’s degree holders, have a permanent position with an academic rank of instructor, and most of the faculty members are graduate of SUCs. They also have high attitude toward teaching; generally, the faculty members perceived themselves to be often in using teaching approaches and teaching methods; and sometimes in using teaching techniques/styles, instructional support activities, and non-formal activities; and no significant relationships exist between the faculty members’ profile variables and their level of pedagogical approaches in teaching approaches, teaching methods, teaching techniques/styles, non-formal activities and instructional support activities. Teachers should be encouraged to pursue/finish higher education, likewise they should be motivated to conduct research studies like action researches as part of their functions, particularly along their area of specialization. Teachers should be encouraged to explore and view other effective teaching strategies and find more ways to entice other students challenge themselves to create their own strategies to use in the field and to become more global in perspective. The use computer technology can be an effective teaching strategy, especially when students are given information specific to their own situation rather than general information.
Keywords: Teaching Strategy, teacher education instructional support, higher education
INTRODUCTION
Changes in our educational system today give new roles for the subject teacher whether his assignment is in English, Social Studies, Sciences or Mathematics. With technological advances, new techniques and strategies, approaches and methods should find their way into our school system. These new roles and insights were not gained through traditional teaching particularly in tertiary level subjects.
The teacher is the key figure in school. The success of the school and the students in terms of each educational progress rests on the active awareness and leadership of the teacher in carrying out its programs. The teacher then is expected to initiates techniques
The task at hand therefore, is to provide an answer to the fundamental question, that is, “What should count as would-be-teacher for the next millennium?” The goal of every teacher should make each student assimilate any lesson taught to the highest level of achievement [2]. In the same vein, Edmondson and Novak [3] stressed that students should understand not only the facts but also on how these facts are organized and how they are related to one another in order to characterize meaningful learning. Students should be exposed to varied learning experiences because the greater the involvement, the greater the learning, thereby ensuring quality education [4]. It is therefore tantamount to know what appropriate instructional strategy or technique is necessary, what objective has to be established, and the proper approach he has to choose, thus, this will ensure more or less the direction that his effort will take to minimize wastage.
OBJECTIVES OF THE STUDY
This study aimed to determine the methods and teaching strategies used by the PSU – CTE faculty members of Bayambang Campus, Bayambang, Pangasinan, Philippines during the first semester of the school year 2013-2014. Specifically, this study will attempt to answer the following questions: (1) What is the profile of the CTE faculty members in terms of the following personal and school-related variables: sex, highest educational attainment, status of appointment, academic rank, type of college graduated; and attitude toward teaching? (2) What is the level of pedagogical approach used by the faculty members in terms of teaching approaches, teaching methods, teaching techniques/styles, instructional support activities and non-formal activities? and (3) Is there a significant relationship between the level of methods and teaching strategies across their personal and school-related variables?
METHODS
The descriptive-correlational method of research was employed in this study where it involved the collection of pertinent data in order to answer questions concerning the current status of the subject of the study. The purpose of this method gathered information by which were classified, analyzed, and interpreted to come up with the conclusions and recommendations. This study was conducted among the eighty three (83) CTE faculty members. The
primary tool in gathering the needed data was the questionnaire–checklist that elicited the personal and school related information about the faculty members. The questionnaire checklist on methods and teaching strategies was developed by the researcher as a product of his intensive readings from the different references, related studies and other sources. Likewise the researcher utilized the modified Attitude Toward Teaching Scale (ATTS).
The Attitude Toward Teaching Scale (ATTS) was developed by Thurstone [5] which was modified and improved by the researcher. This was tried out to ten (10) randomly selected school teachers of PSU enrolled in Master’s Degree Program. The results were analyzed to determine the validity of the said questionnaires. Utmost care was observed in the construction of the attitudinal items in order to obtain valid and reliable data. In the validation of the modified Attitude Toward Teaching Scale (ATTS), some of the sensitive statements had negative counterparts. The positive statements were assigned the scale of five (5) and the negative ones got the scale of one (1). This is intended to establish the consistency of responses between positive and negative statements, consequently, the instrument was considered reliable. The study was utilized by simple frequency counts and percentages to describe the profile of faculty personnel to type of college graduated from, concentration area, and year level taught. The computed mean values of attitude toward teaching were rated and interpreted as follows: Very High – 4.51-5.00; High - 3.51-4.50; Average – 2.51-3.50; Low – 1.51-2.50; and Very Low – 1.00-1.50.
RESULTS AND DISCUSSION
Profile of CTE Faculty Members
Personal and school-related variables were used as indicators of the profile of faculty members-respondents in this study which includes the sex, highest educational attainment, status of appointment, academic rank, type of college graduated from; and attitude toward teaching.
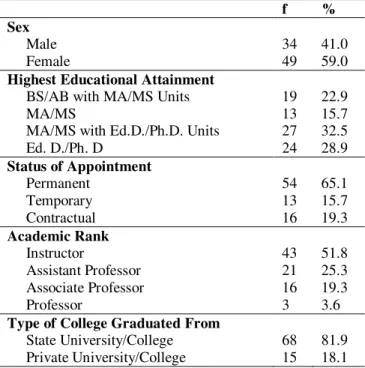
Table 1. Profile of the Faculty Members with Respect to School-Related Variables (N=83)
f %
Sex Male Female 34 49 41.0 59.0
Highest Educational Attainment BS/AB with MA/MS Units MA/MS
MA/MS with Ed.D./Ph.D. Units Ed. D./Ph. D
19 13 27 24 22.9 15.7 32.5 28.9
Status of Appointment
Permanent Temporary Contractual 54 13 16 65.1 15.7 19.3 Academic Rank Instructor Assistant Professor Associate Professor Professor 43 21 16 3 51.8 25.3 19.3 3.6
Type of College Graduated From State University/College Private University/College 68 15 81.9 18.1
It can be seen in Table 1 that 37 (32.5%) of the respondents have earned master’s degree holder with doctorate units. A very significant number 24 (28.9%) have already finished their doctorate degrees while 19 or 22.9% who have finished their master’s degree program; and 13 (15.7%) are bachelor’s degree holders with master’s units. In general, this data shows that faculty members give high importance in pursuing higher education. It is also attributed to the policy of SUCs that permanent or temporary faculty members should be at least master’s degree holders. It is also underscored that despite the demanding tasks of a teacher coupled with family responsibilities, continuing education is still a priority.
The table reveals that the greatest number 54 (65.1%) of the faculty-respondents are permanent. This implies that the respondents are secured in terms of their status of appointment. Singly, while 16 or 19.3% are contractual and (13 or 15.7%) are temporary.
Most of the respondents (43 or 51.8%) are instructors, followed by 21 (25.3%) assistant professors, 16 (19.3%) associate professors and the lowest is professor (3 or 3.6%). This could be due to the fact that faculty members used to be evaluated differently from the SUC’s way of evaluation.
The data show that majority (68 or 81.9%) of the faculty members are products of SUCs while 15 of
them (18.1%) graduated from private institutions. The table clearly shows that there are more respondents who are graduates of SUCs. A reason for this may be due to parents’ preference to send their children to colleges where tuition fees are affordable.
Table 2. Profile of Faculty Members with Respect to Their Attitude Towards Teaching
Indicators AWM VI
Feeling about teaching Ideas about teaching Interest about teaching Feeling about professional development 3.43 3.66 3.76 3.90 Average High High High
Overall 3.69 High
Table 2 presents the faculty member-respondents’ attitude toward teaching. As clearly seen from the table, faculty members have a high attitude toward teaching with a computed average weighted mean of 3.69. Apparently, faculty members have a favorable attitude to enhance learning. This finding is in consonance with Sevilla as cited by Sinlao [6] conjecture that a teacher having a favorable attitude toward her profession will likely leave a strong impact on students, whereas a teacher having a prejudiced behavior can lead to group tensions and conflicts.
Table 3. Teaching Approaches Used By The CTE Faculty Members
Teaching Approaches AWM VI
1. Process Approach 3.40 Always 2. Discovery Approach 3.18 Often 3. Cooperative Learning Approach 3.07 Often 4. Mastery Learning Approach 3.35 Always 5. Integrative Learning Approach 3.10 Often 6. Team Teaching Approach 1.99 Sometimes 7. Experiential Learning Approach 3.20 Often 8. Reflective Teaching Approach 3.16 Often 9. Constructivist Approach 3.12 Often 10. Metacognitive Approach 2.95 Often 11. Inquiry Approach 2.99 Often 12. Center-Based Learning
Approach 2.31 Sometimes 13. Programmed Instruction
Approach 3.10 Often 14. Modular Instructions Approach 2.20 Sometimes 15. Adoptive Instruction Approach 2.63 Often
Teaching approaches are ways in which the teacher engage and support students to encourage questions, set formative assessments, provide constructive feedback, relate new knowledge to what students already know, build in interaction, and putting educational theory into practice. Table 3 summarizes the distribution of faculty members’ level of teaching approaches
A close inspection of the table, reveals that a large majority of the faculty members perceived themselves that they were under the level often. The two teaching approaches where responses fall under the level always were Process Approach (3.40), and Mastery Approach (3.35).This indicates that using process approach enhances an organization's effectiveness and efficiency in achieving its defined objectives; and mastery learning maintains that students must achieve a level of mastery, i.e., 80% on a knowledge test, in prerequisite knowledge before moving forward to learn subsequent information. Thus, if students do not achieve mastery on the test, they are given additional support in learning and reviewing the information, then tested again, this cycle will continue until the learner accomplishes mastery, and may move on to the next stage.
The computed means for each of the individual teaching approach gave varied results. It was found out that there were certain approaches related to teaching whose computed means fall under either the levels, often and sometimes. Specifically, the tasks that the faculty members perceived to have often level were Experiential Learning Approach (3.20), and Discovery Approach. On the other hand, the computed means of other tasks related to teaching approaches fall under the level, sometimes. These tasks were Center-Based Learning Approach (2.31), Modular Instructions Approach (2.20), and Team Teaching Approach (1.99). This justifies that teachers seldom used these such approaches the fact that modular instructions approach meets the needs of today's students less adequate in a traditional instruction with respect to the quality of learning and the content; and team teaching requires a re-orientation on the part of individual staff members and departmental administrators and requires much more than just a common meeting time and space.
Similarly, the average weighted mean of 2.92 for the overall responses on the level of extent falls under often. This indicates that on the average, the faculty
members generally have often level in using teaching approaches.
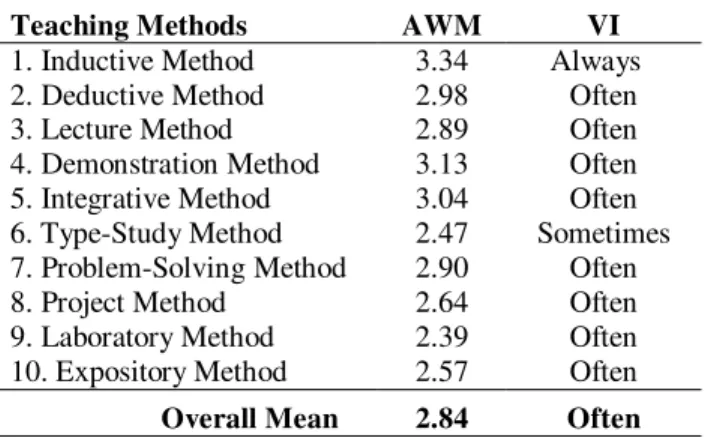
Table 4. Teaching Methods Used By The CTE Faculty Members
Teaching Methods AWM VI
1. Inductive Method 3.34 Always 2. Deductive Method 2.98 Often 3. Lecture Method 2.89 Often 4. Demonstration Method 3.13 Often 5. Integrative Method 3.04 Often 6. Type-Study Method 2.47 Sometimes 7. Problem-Solving Method 2.90 Often 8. Project Method 2.64 Often 9. Laboratory Method 2.39 Often 10. Expository Method 2.57 Often
Overall Mean 2.84 Often
Teaching methods provide a well-balanced program of activities and opportunities for students to make decisions and developing the latent creative abilities. Table 4 provides the distribution of the faculty members’ level of teaching methods.
The table pictures the general perception of the faculty members on their level of ten tasks related to teaching methods. The overall mean of 2.84 falls under the level, often, which indicates that the faculty members, in general are often in using teaching methods. The only task where a majority of responses (3.34) falls under always level was Inductive Method. This may be attributed to the fact that using inductive method as a procedure through which one may arrive at a fact, principle, or truth, where many instances or cases are studied, observed, and compared and the common elements in them discovered and generalized.
The mean of the least task related to teaching method fall under the level, sometimes. This, again, the least used by the faculty members, probably, because in reality, the selection of a typical case is crucial, and the case or topic must be representative of the group.
Table 5. Teaching Techniques and Styles Used by the CTE Faculty Members
Teaching Techniques/Styles AWM VI
1. Role Playing 2.35 Sometimes 2. Micro Teaching 2.30 Sometimes 3. Macro Teaching 2.55 Often 4. Synectics (Formulation of
Analysis) 2.39 Sometimes 5. Peer Tutoring 2.39 Sometimes 6. Field Studies 1.95 Sometimes 7. Jigsaw 2.25 Sometimes 8. Discussions 3.58 Often 9. Brainstorming 3.23 Often 10. Buzz Session 2.57 Often 11. Fishbowl 2.16 Sometimes 12. Symposium 1.90 Sometimes 13. Simulation 2.41 Sometimes 14. Dialogue 2.51 Often 15. Debate 2.45 Sometimes 16. Film Viewing 2.53 Often 17. Seminar-Workshop 1.75 Sometimes 18. Conference 1.87 Sometimes 19. Concept Mapping 2.60 Often 20. Small Grouping 2.78 Often 21. Interview 2.28 Sometimes 22. Panel Discussion 2.52 Often 23. Group/Individual Reporting 2.86 Often 24. Phillips 66 1.73 Sometimes 25. Mnemonic Strategy 2.42 Sometimes 26. Community Resource 1.87 Sometimes 27. Inviting Resource Speaker 1.70 Sometimes 28. Round Table Conference 2.05 Sometimes 29. Socialized Recitation 2.47 Sometimes
Overall Mean 2.33 Sometimes
Referring to the table, it can be surmised from the overall responses of the faculty members that they generally perceived themselves to be sometimes in this particular techniques and styles having a weighted average mean of 2.33. Specifically, the modal responses related to teaching techniques and styles whose computed means fall under either the levels, often or sometimes.
Taking into account the computed means for each task related to teaching techniques and styles, the faculty members rated themselves, often level in discussion (3.58) and brainstorming (3.23). This implies that faculty members often used these techniques because it provides opportunities for students to participate by commenting about points in the lecture or answering questions directly throw out by other students in the class; the purpose of
brainstorming is to allow students to think freely, and write down all of their ideas without making judgments about them. The task that has the least means were inviting resource speaker (1.70) and Phillips 66 (1.73), both of which have means that fall under the level, sometimes. This can be concluded that these tasks may be the least technique because inviting new speakers to speak, students may wonder why you have chosen them, which could make them nervous or suspicious. Often than not, it is difficult to decide on the area of expertise you are looking for; and Phillips 66 is where the teacher states a question about the homework, the reading, or any other pertinent subject or an upcoming event that needs more review and clarification which is too difficult on the part of a teacher.
Table 6. Instructional Support Activities Used by the CTE Faculty Members
Teaching Techniques/Styles WM VI
1. Term Paper Writing 2.33 Sometimes 2. Writing Reaction Paper 2.65 Often 3. Writing Reflection Paper 2.55 Often 4. Journal Entry Writing 2.06 Sometimes 5. Preparing Portfolio 2.24 Sometimes 6. Portfolio Evaluation with Rubrics 2.23 Sometimes 7. Reconstructed Lesson Plan 2.24 Sometimes 8. Lesson Planning 2.55 Often 9. Power Point Presentation 3.13 Often 10. Conducting Case Study 2.24 Sometimes 11. Note Taking 3.24 Sometimes 12. Conducting Action Research 2.30 Sometimes 13. Remedial Instruction 2.42 Sometimes 14. Conducting Enrichment Activities 2.86 Often 15. Textbook/Aid Reading Report 2.95 Often 16. Internet Surfing 3.24 Often 17. Classroom Observation 2.75 Often 18. Conducting Interview 2.33 Sometimes 19. Conducting Community Survey 2.05 Sometimes 20. Writing Short Stories/Poems 2.04 Sometimes 21. Conducting Songs, Jingles &
Rhymes 2.07 Sometimes 22. News Casting 1.93 Sometimes 23. Investigatory Research 2.07 Sometimes 24. Lesson Presentation with the use of
Intel-Teach 2.08 Sometimes 25. Lesson Using Laboratory Manual 2.28 Sometimes
Overall Mean 2.44 Sometimes
computed means and majority of the faculty members’ responses fall under either the levels, often or sometimes. It is worthy to mention here that there were two tasks related to instructional support activities which equally garnered a computed mean compared to means of other tasks, to wit: note taking and internet surfing having a mean of (3.24), respectively. It is indicative therefore that, note taking is the practice of students to record the significant information captured from their teachers’ discussion, freeing their mind from having to recall everything; and on the other hand, internet surfing where students explore from the world wide web by following one interesting link to another, usually without a planned definite objective or search strategy.
The rests
of the tasks related to instructional
support activities have
means fall under the level,
sometimes. On the whole, the overall mean of
2.44 indicates that the faculty members generally
perceived themselves to acquire sometimes level
in using instructional support activities.
Non-formal activities are purposive but
voluntary learning that takes place in a diverse
range of environments and situations for which
teaching/training and learning is not necessarily
their sole or main activity. Do the faculty
members excel in this expectation is a question
this study aims to answer and the findings are
tabulated and presented in Table 7.
Table 7. Non-Formal Activities Used By The Faculty Members
Non-Formal Activities AWM VI
1. Quiz Bee 2.37 Sometimes 2. Academic Olympics 2.14 Sometimes 3. Fieldtrips/Lakbay-Aral 2.12 Sometimes 4. Games/Sports Competition 2.14 Sometimes 5. Monthly School Program 2.01 Sometimes 6. Membership to School
Organization 2.47 Sometimes 7. Membership to Community
Organization 2.08 Sometimes 8. Literary-Musical Contest 1.88 Sometimes 9. Socialization 2.49 Often 10. Popularity/Beauty Contest 1.87 Sometimes 11. Exhibits 2.45 Sometimes 12. Letter to Parent Contest 1.69 Sometimes 13. Student in Free Enterprise 1.76 Sometimes
Overall Mean 2.11 Sometimes
As manifested in the table, the computed mean for the overall responses of the faculty members as regards their level of non-formal activities was 2.11. This mean value is categorized under the level, sometimes and thus, gives the interpretation that the faculty members, in general, are sometimes in using this various non-formal activities. However, the only task where a majority of responses 2.49 falls under often level was socialization. This finding reveals that this activity is the students’ most awaited and well-planned event, but is seldom structured by conventional rhythms.
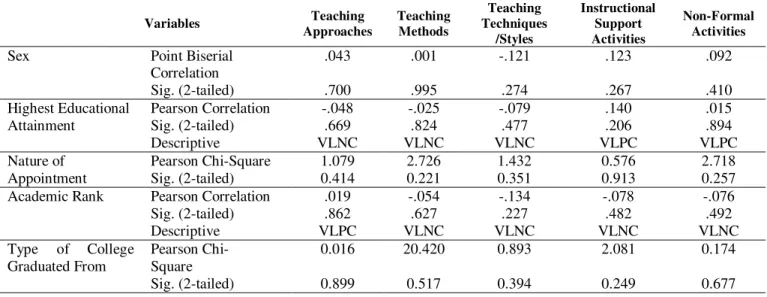
Table 8. Correlation Between the Level of Pedagogical Approaches and Certain School-Related Variables
Variables Teaching
Approaches
Teaching Methods
Teaching Techniques
/Styles
Instructional Support Activities
Non-Formal Activities
Sex Point Biserial Correlation
.043 .001 -.121 .123 .092
Sig. (2-tailed) .700 .995 .274 .267 .410 Highest Educational
Attainment
Pearson Correlation -.048 -.025 -.079 .140 .015 Sig. (2-tailed) .669 .824 .477 .206 .894 Descriptive VLNC VLNC VLNC VLPC VLPC Nature of
Appointment
Pearson Chi-Square 1.079 2.726 1.432 0.576 2.718 Sig. (2-tailed) 0.414 0.221 0.351 0.913 0.257 Academic Rank Pearson Correlation .019 -.054 -.134 -.078 -.076 Sig. (2-tailed) .862 .627 .227 .482 .492 Descriptive VLPC VLNC VLNC VLNC VLNC Type of College
Graduated From
Pearson Chi- Square
0.016 20.420 0.893 2.081 0.174
Table 8 presents the summary relationship between the level of pedagogical approaches and faculty members’ profile variables.
Sex and the Level of Pedagogical Approaches. The table shows the summary of computed point biserial correlation obtained in finding the relationships between the faculty members’ sex and their level of pedagogical approaches in teaching approaches, teaching methods, teaching techniques/styles, non-formal activities and instructional support activities. As reflected in the table, all the computed point biserial correlation which range from -.043 to .123 with significance level of .700 and .267. This indicates that whatever the relationships that exist the faculty members’ sex and their level of pedagogical approaches are considered not statistically significant. Therefore, the corresponding null hypothesis which state that there is no significant relationships that exist between the faculty members’ sex and the level of areas of teaching indicators is accepted.
Highest Educational Attainment and the Level of Pedagogical Approaches. Table presents the summary of computed Pearson r values obtained in determining the relationships between the faculty members’ highest educational attainment and their level of pedagogical approaches in teaching approaches, teaching methods, teaching techniques/styles, non-formal activities and instructional support activities. It is pictured that the computed r values range from .015 to .140, most of which are nearly zero which means that there are most likely no significant relationships that exist between the faculty members’ highest educational attainment and their level of pedagogical approaches. This means that all the computed absolute r values are not significant at the 0.05 level of confidence. This further means that the corresponding null hypothesis is accepted.
Academic Rank and the Level of Pedagogical Approaches. Pearson r was used to determine the relationships between the faculty members’ academic rank and their level of pedagogical approaches in teaching approaches, teaching methods, teaching techniques/styles, non-formal activities and instructional support activities. As presented in the table, all the computed r values which range from .019 to .078 fall within the interpretation, very low performance correlation. In fact, the values are almost near zero which means that there are almost no relationships between the variables at all. This further
means that whatever the relationships that exist between the faculty members’ academic rank and their level of pedagogical approaches are considered highly negligible and are not significant. Therefore, the corresponding null hypothesis which state that there is no significant difference between the faculty members’ academic rank and their level of pedagogical approaches in teaching approaches, teaching methods, teaching techniques/styles, non-formal activities and instructional support activities are accepted.
Status of Appointment and the Level of Pedagogical Approaches. With respect to the faculty members’ nature of appointment, the Chi-Square Statistical Test was employed. With reference to table for critical values of Chi-Square, i.e., probability under Ho that X² ≥ Chi-Square, the critical Chi-Square value at the 0.05 level of significance with the four degrees of freedom is 9.49, but a quick glance at the Table 7 shows that not one of the computed Chi-Square values is equal or greater than 9.49. All the computed Chi-Square values range from 0.576 to 2.726, all of which are much less than the critical Chi-Square value. This signifies that all of the corresponding null hypothesis can not be rejected. It is therefore concluded that there are no significant relationships between the faculty members’ status of appointment and their level of pedagogical approaches in teaching approaches, teaching methods, teaching techniques/styles, non-formal activities and instructional support activities. Based on the accompanying table, it can readily seen that the computed Chi-Square value of 0.576 obtained in finding the relationship between the faculty members’ nature of appointment and their level of pedagogical approaches is the least computed Chi-Square value and it is way off the critical value of 9.49. This points out that there is most likely very miniscule and highly insignificant relationship that exists between the two variables. This also implies that there is no specific pattern at all in the faculty members’ level of pedagogical approaches when group by nature of appointment. Since all other computed Chi-Square values give the same result, i. e., a lot less than the critical Chi-Square value of 9.49, the same interpretations are derived and concluded.
values are considered insignificant at the 0.05 level of confidence. It follows that all the corresponding null hypotheses are rejected at the 0.05 level of significance.
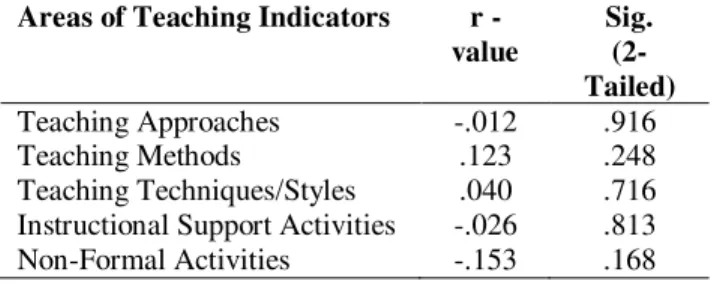
Attitude Toward Teaching and the Level of Pedagogical Approaches. Table 9 shows the summary of computed Pearson r values obtained in determining the relationships between faculty members’ attitude toward teaching and their level of pedagogical approaches in teaching approaches, teaching methods, teaching techniques/styles, non-formal activities and instructional support activities.
Table 9. Summary of Pearson r Values Obtained Between the Faculty Members and Their Level of Areas of Teaching Indicators
Areas of Teaching Indicators r - value
Sig. (2-Tailed)
Teaching Approaches -.012 .916 Teaching Methods .123 .248 Teaching Techniques/Styles .040 .716 Instructional Support Activities -.026 .813 Non-Formal Activities -.153 .168
The relationships between pedagogical approaches and attitude toward teaching have computed r value of -.012 which have significance level of .916. This means that the relationship is not significant at the 0.05 level. With respect to teaching method, its relationship with attitude toward teaching the r values were computed at .128 and teaching techniques/styles at .040 which have significant levels of .248 and .716 respectively are also insignificant at the 0.05 level. In terms of non-formal activities with attitude toward teaching, the r values were computed at -.153 and instructional support activities -.026 which have significance levels of .168 and .813 respectively are likewise not significant at the 0.05 level. The results may be attributed that the faculty members’ attitude toward teaching does not affect the level of pedagogical approaches in teaching approaches, teaching methods, teaching techniques/styles, non-formal activities and instructional support activities.
CONCLUSION AND RECOMMENDATION
Based on the above findings, the following conclusions are derived: (1) Majority of the faculty members are females, they are master’s degree holders, have a permanent position with an academic
rank of instructor, and most of the faculty members are graduate of SUCs. They also have high attitude toward teaching. (2) Generally, the faculty members perceived themselves to be often in using teaching approaches and teaching methods; and sometimes in using teaching techniques/styles, instructional support activities, and non-formal activities. (3) No significant relationships exist between the faculty members’ profile variables and their level of pedagogical approaches in teaching approaches, teaching methods, teaching techniques/styles, non-formal activities and instructional support activities.
The following recommendations are hereby offered, to wit: (1) Teachers should be encouraged to pursue/finish higher education, likewise they should be motivated to conduct research studies like action researches as part of their functions, particularly along their area of specialization. (2) Teachers should be encouraged to explore and view other effective teaching strategies and find more ways to entice other students challenge themselves to create their own strategies to use in the field and to become more global in perspective. (3) The use computer technology can be an effective teaching strategy, especially when students are given information specific to their own situation rather than general information.
REFERENCES
[1] Figley, Marguiles, Stuart and Lewis Eigen. (2012). Applied Programmed Instruction. New York: John Willey and Sons.
[2] Macaraeg, Victoria D. (2007). “A Comparative of
Two Methods of Teaching High School Physics”.
Unpublished Masteral Thesis. De La Salle University. Taft Avenue, Manila.
[3] Edmondson, K. M. & Novak, J. D. (2003). The Interplay of Scientific Epistemological Views, Learning Strategies and Attitudes of College Students. Journal of Research Science Teaching. 1 (30).
[4] Talisayon, V. (2009). Reform in Science Teacher Education, Challenges and Reforms in Philippine Education for the 21ST Century. UPISMED, UP Diliman, Quezon City.
[5] Thurstone, Louis. L. 2009. "The Measurement of Attitude," Chicago, Journal of Social Psychology. University of Chicago. Chicago, USA
Dissertation. Pangasinan State University, Graduate School. Urdaneta, Pangasinan.
Copyrights