AMTD
4, 1181–1197, 2011Filtering of waves close to the tropopause
P. Alexander et al.
Title Page
Abstract Introduction
Conclusions References
Tables Figures
◭ ◮
◭ ◮
Back Close
Full Screen / Esc
Printer-friendly Version Interactive Discussion
Discussion
P
a
per
|
Dis
cussion
P
a
per
|
Discussion
P
a
per
|
Discussio
n
P
a
per
|
Atmos. Meas. Tech. Discuss., 4, 1181–1197, 2011 www.atmos-meas-tech-discuss.net/4/1181/2011/ doi:10.5194/amtd-4-1181-2011
© Author(s) 2011. CC Attribution 3.0 License.
Atmospheric Measurement Techniques Discussions
This discussion paper is/has been under review for the journal Atmospheric Measure-ment Techniques (AMT). Please refer to the corresponding final paper in AMT
if available.
A method to improve the determination of
wave perturbations close to the
tropopause by using a digital filter
P. Alexander1, A. de la Torre2, P. Llamedo2, R. Hierro2, T. Schmidt3, A. Haser3, and J. Wickert3
1
Departamento de F´ısica, Facultad de Ciencias Exactas y Naturales, Universidad de Buenos Aires, 1428 Buenos Aires, Argentina
2
Facultad de Ingenier´ıa, Universidad Austral, Av. J. de Garay 125, 1063 Buenos Aires, Argentina
3
Helmholtz Centre Potsdam, GFZ German Research Centre for Geosciences, Telegrafenberg A17, 14473 Potsdam, Germany
Received: 23 December 2010 – Accepted: 11 February 2011 – Published: 23 February 2011 Correspondence to: P. Alexander ([email protected])
AMTD
4, 1181–1197, 2011Filtering of waves close to the tropopause
P. Alexander et al.
Title Page
Abstract Introduction
Conclusions References
Tables Figures
◭ ◮
◭ ◮
Back Close
Full Screen / Esc
Printer-friendly Version Interactive Discussion
Discussion
P
a
per
|
Dis
cussion
P
a
per
|
Discussion
P
a
per
|
Discussio
n
P
a
per
|
Abstract
Calculations of gravity wave activity all over the globe derived from GPS radio oc-cultation temperature profiles led some years ago to the following question: are the wave amplitude enhancements systematically observed around tropopause levels due to physical processes or are they a simple artifact generated by any digital filter used to
5
isolate the wave components? The latter alternative has been found to be the correct one. This has been concluded after almost a decade of work on global wave clima-tologies obtained from GPS radio occultation satellite data, which allowed to analyze, for the first time, a large amount of atmospheric profiles including both the troposphere and the stratosphere. We present a new filtering method which can be equally applied
10
to temperature or refractivity profiles. The suggested technique significantly reduces artificial enhancements around the tropopause, which represents an improvement in comparison to previous applications of standard filters.
1 Introduction
Atmospheric waves play an important role in the transport of momentum and energy
15
in the lower and middle atmosphere and have a key protagonism in the general circu-lation. In the last decades, a variety of techniques have provided an ever increasing amount of data to describe these dynamical aspects: radar, lidar, aircraft, rocket, ra-diosonde and satellites (e.g., Tsuda et al., 1991; Nastrom and Fritts, 1992; Eckermann and Vincent, 1993; Wu et al., 2006).
20
Among the satellite methods we will briefly describe one of them due to its impor-tance in the present work. A Global Positioning System (GPS) radio occultation (RO) occurs whenever a transmitter on board a satellite from the GPS network at an altitude about 20 000 km rises or sets from the standpoint of a low Earth orbit satellite receiver at a height about 800 km and the ray traverses the atmospheric limb. The aim of the
25
AMTD
4, 1181–1197, 2011Filtering of waves close to the tropopause
P. Alexander et al.
Title Page
Abstract Introduction
Conclusions References
Tables Figures
◭ ◮
◭ ◮
Back Close
Full Screen / Esc
Printer-friendly Version Interactive Discussion
Discussion
P
a
per
|
Dis
cussion
P
a
per
|
Discussion
P
a
per
|
Discussio
n
P
a
per
|
of the signal by the Earth’s atmosphere in the limb path between the transmitter and the receiver. This information can be converted into vertical atmospheric refractivity, pressure, density and temperature profiles. The advantages as compared to other methods are that this technique is nearly an instantaneous snapshot (typically 1 min as compared to the much longer atmospheric processes), it has a global coverage,
5
sub-Kelvin accuracy in temperature measurements from the upper troposphere to the lower stratosphere, good vertical resolution, and it is not interrupted by clouds or bad weather conditions.
According to the linear theory of waves in the atmosphere (see, e.g., Nappo, 2002), measured variables may be separated into background and perturbation structures.
10
The former is assumed to possess much larger time or space scales and is not affected by the fluctuations. The latter is considered to have zero mean over the longer scales. Different methods may be chosen to separate the original data into both parts and their characteristics and assumptions may lead to different results (Z ¨ulicke and Peters, 2006).
15
2 Separation of background and perturbations
When vertical profiles of temperatureTdata from whatever observational technique are processed for wave activity analysis, singular problems emerge for the separation pro-cess between backgroundTBand perturbationT′components around the tropopause.
One alternative to break offbackground and fluctuations is to use a polynomial
func-20
tion to fit the former (e.g., Allen and Vincent, 1995). However, this technique allows no direct control of the wavelength range to be isolated. Another option is to use a digital filter. The larger wavelengths are separated because they are assumed to represent the background, whereas the smallest ones are eliminated because they are considered to be waves in a spectral region outside the study’s scope of interest or
25
AMTD
4, 1181–1197, 2011Filtering of waves close to the tropopause
P. Alexander et al.
Title Page
Abstract Introduction
Conclusions References
Tables Figures
◭ ◮
◭ ◮
Back Close
Full Screen / Esc
Printer-friendly Version Interactive Discussion
Discussion
P
a
per
|
Dis
cussion
P
a
per
|
Discussion
P
a
per
|
Discussio
n
P
a
per
|
particularly at low latitudes, strongly affects the performance of the digital filters usually employed, mainly leading to an artificial enhancement of the amplitudes of the waves that are present in the fluctuating structure to be studied. This has been concluded after almost a decade of work on global wave climatologies obtained from GPS RO satel-lite data (see, e.g., Tsuda et al., 2000; Ratnam et al., 2004; de la Torre et al., 2006;
5
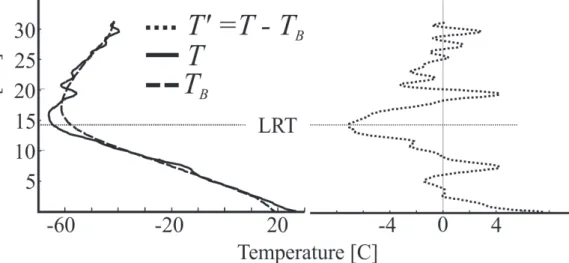
Namboothiri et al., 2008), which allowed to analyze, for the first time, a large amount of temperature profiles including both the troposphere and stratosphere. A large de-viation in the tropopause region between the measured temperature profile by a GPS RO example and the corresponding background determined by a filter may be seen in Fig. 1. This kind of problem has initially led to over-estimations of amplitudes close
10
to the tropopause and once acknowledged has precluded the possibility of perform-ing studies encompassperform-ing the troposphere and stratosphere within the same data-set. A first partial solution was to restrict any analysis to each atmospheric layer or to only one of them. At the time, the possible inference of vertical wavelengths larger than around 15 km was not possible in this kind of works. In addition, wave activity in the
15
tropopause region could not be realistically determined.
Schmidt et al. (2008) discussed the global gravity wave activity derived from CHAl-lenging Minisatellite Payload (CHAMP) GPS RO data by separating tropospheric and stratospheric data and applying a filter in each region. The total temperature back-ground profile was constructed from the two parts and compared to the filtering applied
20
to the complete altitude range. The separate filtering method significantly reduced the usually observed artificial wave activity enhancement in the tropopause region. An as-sessment of the significant errors introduced by the tropopause artificial enhancement when using a digital filter for the “complete” and “separate” methods applied to GPS RO temperature profiles has been recently carried out by de la Torre et al. (2010). We
25
will compare below these two alternatives with the double filtering method.
AMTD
4, 1181–1197, 2011Filtering of waves close to the tropopause
P. Alexander et al.
Title Page
Abstract Introduction
Conclusions References
Tables Figures
◭ ◮
◭ ◮
Back Close
Full Screen / Esc
Printer-friendly Version Interactive Discussion
Discussion
P
a
per
|
Dis
cussion
P
a
per
|
Discussion
P
a
per
|
Discussio
n
P
a
per
|
much larger than in previous missions, which may be sufficient for the determination of a background temperature by averaging at each height over small latitude/longitude bins and time intervals (see, e.g., Alexander et al., 2008; Wang and Alexander, 2010). These authors constructed for each grid cell of given longitude and latitude bands a background temperature profile over a defined time interval. The oscillation
com-5
ponents were obtained by subtracting individual temperature profiles from the appro-priate background. However, for older GPS RO missions or for other observational techniques the number of profiles per cell is too scarce to generate representative backgrounds, and the method is no longer meaningful. In addition, some researchers may legitimately consider that temporal or spatial resolutions higher than the ones
10
mentioned in this paragraph are needed to better separate both parts. All these cases require a solution to the tropopause problem.
3 A new filtering method
Real filters do not have the ideal desired behavior and may need some manual fine tuning procedures. We tried different alternatives and empirically found a method that
15
we call double filtering, which basically implies the use of the same filter twice. We checked the method with two different filters, because it could a priori lead to non-coincident outcomes. An explanation of each of both filters may be respectively found in Scavuzzo et al. (1998) and Sch ¨onwiese (2000). Both are non-recursive and include a Kaiser window (Kaiser, 1966) in the height domain to minimize filtering artifacts due
20
to the non-infinite extension of the data. The two filters led to almost identical out-comes, so we show below results only for the one described by Scavuzzo et al. (1998). We applied the method to temperature and refractivity. In the neutral dry atmosphere refractivity is proportional to total pressure and inversely proportional to temperature. Refractivity has the advantages that it is a lower level product of RO (see, e.g.,
Kursin-25
AMTD
4, 1181–1197, 2011Filtering of waves close to the tropopause
P. Alexander et al.
Title Page
Abstract Introduction
Conclusions References
Tables Figures
◭ ◮
◭ ◮
Back Close
Full Screen / Esc
Printer-friendly Version Interactive Discussion
Discussion
P
a
per
|
Dis
cussion
P
a
per
|
Discussion
P
a
per
|
Discussio
n
P
a
per
|
height, so any inappropriate representation of the background may probably lead to an artificial amplification of any fluctuation.
The method has two steps: (i) use the bandpass filtering to isolate the wavelength range of interest (separate the background and eliminate the noise), (ii) perform on the isolated perturbation component a low pass filtering with a cutoffthat is larger than or
5
equal to the bandpass upper limit (remove large wavelengths representing background behavior or trends still present and force a zero mean). Keep in mind for the second step that the tropopause kink in temperature can be viewed as the surrounding of a long sinusoidal peak. In all the cases studied below we applied in the first step a bandpass between 1 and 10 km and in the second step a cutoffof 10 km.
10
4 Results and discussion
We show the results of some examples in Figs. 3 and 4 for double filtered temperature
T′
D. Biases and non zero means may be seen around the tropopause for a standard
filtering procedure. These problems are removed after applying the suggested second step to find any trend or bias in the isolated perturbation component (AUX).
Ampli-15
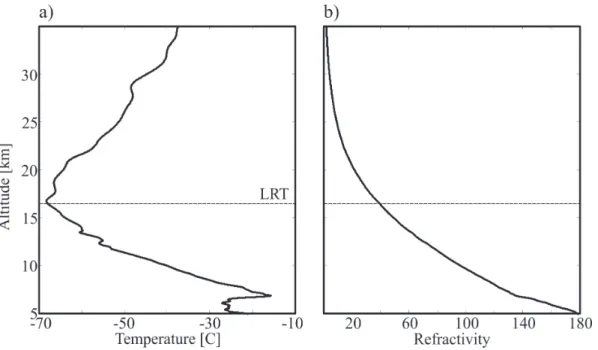
tudes, wavelengths and phase variabilities are not always retained. We repeated the procedure with refractivity and met with similar success. In Figs. 5 and 6 we show the technique applied to relative temperature and refractivity in two examples. Note that the nearly exponential decrease of refractivity with increasing height cannot be appropriately followed by the bandpass filter well above the tropopause and
fluctua-20
tions become magnified and biased at this stage. However, the problem is corrected by the second step in the double filtering method (temperature and refractivity oscilla-tions show nearly equal relative amplitudes and opposite signs as expected in gravity waves).
We also show now how the new method may improve the estimation of wave
ac-25
AMTD
4, 1181–1197, 2011Filtering of waves close to the tropopause
P. Alexander et al.
Title Page
Abstract Introduction
Conclusions References
Tables Figures
◭ ◮
◭ ◮
Back Close
Full Screen / Esc
Printer-friendly Version Interactive Discussion
Discussion
P
a
per
|
Dis
cussion
P
a
per
|
Discussion
P
a
per
|
Discussio
n
P
a
per
|
equivalent to the average relative temperatureT′/T variance (Tsuda et al., 2000). We
will show below the latter quantity, which is the square of the relative temperature aver-aged over a given height interval (relative temperature profiles have been shown in the examples in Figs. 5 and 6). We first created synthetic temperature data between 4 and 27 km height by adding two known components, a backgroundTB plus a perturbation 5
T′. The background temperature was selected from National Center for Environmental
Prediction reanalyses data at intervals of 5◦ latitude, zonally averaged and randomly
chosen between January 1997 and December 2007. The largest altitude interval avail-able for all latitudes and times is 4–27 km. The perturbation temperature was generated as a superposition of monochromatic waves with vertical wavelengths that ranged
be-10
tween 1 and 15 km every 0.5 km and random amplitudes and phases. A modulation function finally matches the perturbations to observed climatologies. More details of the buildup of the synthetic profiles is given by de la Torre et al. (2010). For each latitude there were 500 created profiles, which allowed to calculate mean (reference) values of average temperature variance (mean average variance over 500 profiles) and their
15
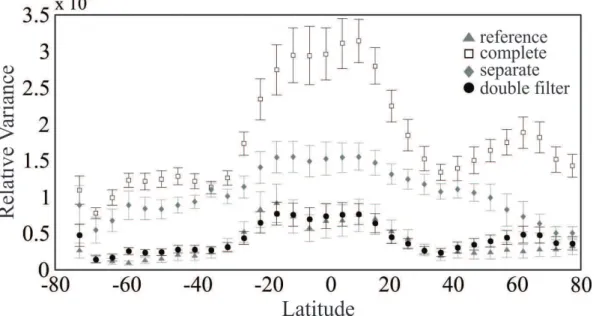
uncertainty (the standard deviation of the average variance over 500 profiles). This in turn was compared with the calculation of the same quantities after applying the “complete”, “separate” and double filtering methods described above. The results are shown in Fig. 7. It may be clearly seen that the method that best follows the “true” values is the double filtering method. The other two methods exhibit order of
magni-20
tude differences at some latitudes. It is noteworthy that in a small area (mainly close to latitude−20◦) the double filtering method underestimates the “true” wave activity. This
strange effect happens because an excessive detrending occurs for some particular temperature profiles.
We were able to satisfactorily circumvent the tropopause problem with the possibility
25
AMTD
4, 1181–1197, 2011Filtering of waves close to the tropopause
P. Alexander et al.
Title Page
Abstract Introduction
Conclusions References
Tables Figures
◭ ◮
◭ ◮
Back Close
Full Screen / Esc
Printer-friendly Version Interactive Discussion
Discussion
P
a
per
|
Dis
cussion
P
a
per
|
Discussion
P
a
per
|
Discussio
n
P
a
per
|
5 Conclusions
The artificial enhancement of gravity wave induced perturbations that is produced by the use of standard filtering procedures around the tropopause is significantly reduced with the suggested double filtering method. Two examples representing difficult cases are shown, which are low latitude temperature profiles with a sharp change in lapse
5
rate. From simulations it may be concluded that the new technique also allows to obtain better estimations of wave activity around the tropopause. The improvement implied by the suggested method will allow the inclusion of waves with longer vertical wavelengths in future calculations along the troposphere and stratosphere. In addition, amplitudes calculated from temperature and refractivity radio occultation data were shown in two
10
examples to produce results which have no significant differences.
Acknowledgements. Manuscript prepared under grants UBA X004, CONICET PIP 11220090100649 and ANPCYT PICT 1999. P. Alexander and A. de la Torre are members of CONICET and P. Llamedo and R. Hierro are respectively holders of a fellowship of CON-ICET and ANPCYT. We thank CHAMP and COSMIC GPS RO data downloaded from COSMIC 15
homepage.
References
Alexander, P. A., Tsuda, T., Kawatani, Y., and Takahashi, M.: Global distribution of atmospheric waves in the equatorial upper troposphere and lower stratosphere: COSMIC observations of wave mean flow interactions, J. Geophys. Res., 113, D24115, doi:10.1029/2008JD010039, 20
2008. 1185
Allen, S. J. and Vincent, R. A.: Gravity wave activity in the lower atmosphere: seasonal and latitudinal variations, J. Geophys. Res., 100, 1327–1350, 1995. 1183
Canziani, P. O., Holton, J. R., Fishbein, E., Froidevaux, L., and Waters, J. W.: Equatorial Kelvin waves: A UARS MLS view, J. Atmos. Sci., 51, 3053–3076, 1994. 1187
25
AMTD
4, 1181–1197, 2011Filtering of waves close to the tropopause
P. Alexander et al.
Title Page
Abstract Introduction
Conclusions References
Tables Figures
◭ ◮
◭ ◮
Back Close
Full Screen / Esc
Printer-friendly Version Interactive Discussion
Discussion
P
a
per
|
Dis
cussion
P
a
per
|
Discussion
P
a
per
|
Discussio
n
P
a
per
|
de la Torre, A., Llamedo, P., Alexander, P., Schmidt, T., and Wickert, J.: Estimated errors in a global gravity wave climatology from GPS radio occultation temperature profiles, Adv. Space Res., 46, 174–179, 2010. 1184, 1187
Eckermann, S. D. and Vincent, R. A.: VHF radar observations of gravity-wave production by cold fronts over southern Australia, J. Atmos. Sci., 50, 785–806, 1993. 1182
5
Kaiser, J. F.: Digital filters, in: System Analysis by Digital Computer, edited by: Kuo, F. F. and Kaiser, J. F., Wiley, New York, 1966. 1185
Kursinski, E. R., Hajj, G. A., Schofield, J. T., Linfield, R. P., and Hardy, K. R.: Observing Earth’s atmosphere with radio occultation measurements using the Global Positioning System, J. Geophys. Res., 102, 23429–23465, 1997. 1185
10
Namboothiri, S. P., Jiang, J. H., Kishore, P., Igarashi, K., Ao, C. O., and Romans, L. J.: CHAMP observations of global gravity wave fields in the troposphere and stratosphere, J. Geophys. Res., 113, D07102, doi:10.1029/2007JD008912, 2008. 1184
Nappo, C. J.: An Introduction to Atmospheric Gravity Waves, Int. Geophys. Ser., 85, Academic, San Diego, 2002. 1183
15
Nastrom, G. D. and Fritts, D. C.: Sources of mesoscale variability of gravity waves, I, topo-graphic excitation, J. Atmos. Sci., 49, 101–110, 1992. 1182
Ratnam, M. V., Tetzlaff, G., and Jacobi, C.: Global and seasonal variations of stratospheric gravity wave activity deduced from the CHAMP/GPS satellite, J. Atmos. Sci., 61, 1610–1620, 2004. 1184
20
Scavuzzo, C. M., Lamfri, M. A., Teitelbaum, H., and Lott, F.: A study of the low-frequency inertio-gravity waves observed during the Pyr ´en ´es experiment, J. Geophys. Res., 103, 1747–1758, 1998. 1185
Schmidt, T., de la Torre, A., and Wickert, J.: Global gravity wave activity in the tropopause region from CHAMP radio occultation data, Geophys. Res. Lett., 35, L16807, 25
doi:10.1029/2008GL034986, 2008. 1184
Sch ¨onwiese, C. D.: Praktische Statistik f ¨ur Meteorologen und Geowissenschaftler, 4. edition, Borntraeger, Berlin, 2006. 1185
Tsuda, T., VanZandt, T. E., Mizumoto, M., Kato, S., and Fukao, S.: Spectral analysis of temper-ature and Brunt-V ¨ais ¨al ¨a frequency fluctuations observed by radiosondes, J. Geophys. Res., 30
AMTD
4, 1181–1197, 2011Filtering of waves close to the tropopause
P. Alexander et al.
Title Page
Abstract Introduction
Conclusions References
Tables Figures
◭ ◮
◭ ◮
Back Close
Full Screen / Esc
Printer-friendly Version Interactive Discussion
Discussion
P
a
per
|
Dis
cussion
P
a
per
|
Discussion
P
a
per
|
Discussio
n
P
a
per
|
Tsuda, T., Nishida, M., Rocken, C., and Ware, R. H.: A global morphology of gravity wave activity in the stratosphere revealed by the GPS occultation data (GPS/MET), J. Geophys. Res., 105, 7257–7273, 2000. 1184, 1187
Wang, L. and Alexander, M. J.: Global estimates of gravity wave parameters from GPS radio occultation temperature data, J. Geophys. Res., 115, D21122, doi:10.1029/2010JD013860, 5
2010. 1185
Wu, D. L., Preusse, P., Eckermann, S. D., Jiang, J. H., de la Torre Ju ´arez, M., Coy, L., and Wang, D. Y.: Remote sounding of atmospheric gravity waves with satellite limb and nadir techniques, Adv. Space Res., 37, 2269–2277, 2006. 1182
Z ¨ulicke, C. and Peters, D.: Simulation of inertia-gravity waves in a poleward-breaking Rossby 10
AMTD
4, 1181–1197, 2011Filtering of waves close to the tropopause
P. Alexander et al.
Title Page
Abstract Introduction
Conclusions References
Tables Figures
◭ ◮
◭ ◮
Back Close
Full Screen / Esc
Printer-friendly Version Interactive Discussion
Discussion
P
a
per
|
Dis
cussion
P
a
per
|
Discussion
P
a
per
|
Discussio
n
P
a
per
|
Fig. 1. A GPS RO temperature profile (solid), the determined background temperature (dashed) and their difference (dotted) on the right (Satellite CHAMP, lon=293.81 deg, lat=
AMTD
4, 1181–1197, 2011Filtering of waves close to the tropopause
P. Alexander et al.
Title Page
Abstract Introduction
Conclusions References
Tables Figures
◭ ◮
◭ ◮
Back Close
Full Screen / Esc
Printer-friendly Version Interactive Discussion
Discussion
P
a
per
|
Dis
cussion
P
a
per
|
Discussion
P
a
per
|
Discussio
n
P
a
per
|
Fig. 5. Bandpass (solid) and double filtered (dashed) relative temperature (black) and refrac-tivity (gray) profiles of a GPS RO event (Satellite COSMIC 1, lon=18.06 deg, lat=−36.30 deg,
AMTD
4, 1181–1197, 2011Filtering of waves close to the tropopause
P. Alexander et al.
Title Page
Abstract Introduction
Conclusions References
Tables Figures
◭ ◮
◭ ◮
Back Close
Full Screen / Esc
Printer-friendly Version Interactive Discussion
Discussion
P
a
per
|
Dis
cussion
P
a
per
|
Discussion
P
a
per
|
Discussio
n
P
a
per
|