*Corresponding author.
E-mail addresses: [email protected] (B. Nazemi)
© 2014 Growing Science Ltd. All rights reserved. doi: 10.5267/j.msl.2014.4.005
Management Science Letters 4 (2014) 851–858
Contents lists available at GrowingScience
Management Science Letters
homepage: www.GrowingScience.com/msl
An empirical investigation on ranking financial risk factors using AHP method
Hassan Ghodrati and Nazemi Bahareh*
Department of Management and Accounting, Kashan Branch, Islamic Azad University, Kashan, Iran
C H R O N I C L E A B S T R A C T
Article history:
Received December 28, 2013 Accepted 10 April 2014 Available online April 14 2014
This paper determines and ranks financial risk factors in Iranian corporations, using analytical hierarchy process (AHP). The present research includes one main question and four sub- questions. Its universe population includes managers, production and financial personnel of great corporations activating in Tehran Stock Exchange, who were selected to explain importance and weight of economic risks indices. The source of great corporations recognition is the Companies Registration Organization in Tehran Province, and according to this, there are 120 corporations. The results have indicated that financing risk maintains the highest priority followed by credit risk, liquidity risk, inflation risk and exchange risk. In terms of different risks associated with financing risk, risk of profit per share has been the number one priority followed by the risk of divisional profit per share, the risk of recessionary or boom and the risk of increasing partial pay profit rate. In terms of credit risk, the risk of loan has been number one priority followed by the risk of inability of loan payment and interest payment. Liquidity risk is another risk factor where demand has been the most important factor followed by rules and regulations and inflation risk. In terms of inflation, producers price risk has been the most important factor followed by consumer price risk, gross domestic product and producers price risk. Finally, in terms of different factors influencing exchange risk, export related issues are considered as the most important factors.
© 2014 Growing Science Ltd. All rights reserved. Keywords:
Risk
Risk Management Economic Risk Ranking AHP
1. Introduction
852
multiple criteria decision making techniques (Wang & Lee, 2007; Shih et al., 2007) such as analytical hierarchy process (AHP) (Saaty, 2004), analytical network process (ANP) (Saaty, 2004), etc.
Lee et al. (2008) proposed an approach based on the fuzzy AHP (FAHP) and balanced scorecard (BSC) for assessing an information technology (IT) department in the manufacturing industry in Taiwan. The BSC concept was implemented to describe the hierarchy with four major BSC perspectives, namely financial, customer, internal business process, and learning and growth. They also used FAHP to handle vagueness and ambiguity of information.
Stoneburner et al. (2002) also provided a comprehensive method for assessing different risk components on the market. Belk and Edelshain (1997) investigated the existing evidence from empirical surveys of foreign exchange risk and its management to confirm or to reject theoretical predictions and the truth of some paradox, and suggested a rationale for its existence. Raz and Michael (2001) identified some tools, which are most widely applied and those that are associated with successful project management in general, and with project risk management. Using a questionnaire the study tried to find which tools are more likely to be applied in those organizations that report better project management performance and in those that value the contribution of risk management processes.
Cooper et al. (2014) proposed a mathematical tool to assess relative risk tolerance using Data Envelopment Analysis (DEA). Using a questionnaire in four groups including propensity, attitude, capacity, and knowledge, they surveyed over 180 individuals their responses were analyzed using the Slacks-based measure type of DEA efficiency model. They reported that the multidimensionality of risk must be taken into account for complete assessment of risk tolerance. This approach also provided some insight into the relationship between risk, its elements and other variables. Specifically, the perception of risk changes by gender as men were generally less risk averse than women. Risk attitude and knowledge scores were consistently lower for women, while there was no statistical difference in their risk capacity and propensity compared to men. The tool can also serve as a “risk calculator” for an appropriate and defensible method to reach legal compliance requirements, known as the “Know Your Client” rule, that exist for Canadian financial institutions and their advisors.
2. The proposed method
In this research, a fuzzy model was used, so its results is not generalizable. Therefore, random sampling was not used and the research concluding is descriptive. Our data were gathered based on expert interviewing, therefore this research plan is survey. Based on the descriptive method the aim of this research is to response following questions:
Main Question: What are the important financial risk factors and their ranks on Iranian corporations?
Sub-questions:
1. What are the financial risk factors on Iranian corporations?
2. What is the importance degree of each financial risk factors?
3. What is the rank of each risk factors Rank based on AHP results?
, ) 1 ( 2 2 / 2 2 2 / q p z N q p z N n (1)
where N is the population size, p1qrepresents the yes/no categories, z/2is CDF of normal
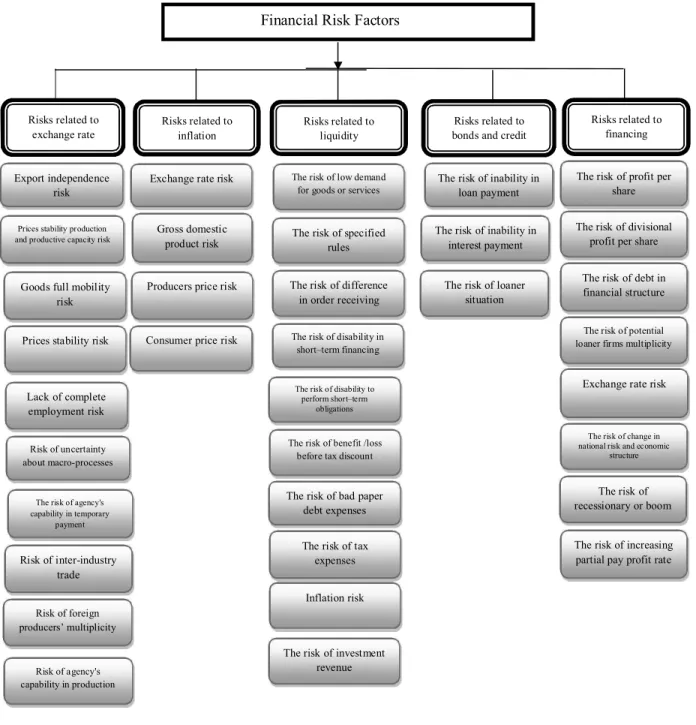
distribution and finally is the error term. Since we have p0.5,z/21.96and N=120, the number of sample size is calculated as n=92. The survey has distributed 120 questionnaires and managed to collect 92 properly filled ones. The questionnaire includes 48 multiple-choice, close-ended questions where 43 questions were associated with subordinate indices and 5 questions were related to main indices. All questions were in Likert scale where 1 demonstrates the least degree of importance and 9 demonstrates the degrees of importance. The participants were asked about some demographic information and their feedback were used to rank various factors. Fig. 1 shows the hierarchy of the proposed study.
Fig. 1. Research Model Financial Risk Factors
Risks related to financing Risks related to
exchange rate Risks related to inflation Risks related to liquidity bonds and creditRisks related to
Risk of inter-industry trade
The risk of agency's capability in temporary
payment
Risk of uncertainty about macro-processes
Lack of complete employment risk Prices stability risk Goods full mobility
risk
Prices stability production and productive capacity risk
Export independence risk
Risk of foreign producers’ multiplicity
Risk of agency's capability in production
The risk of increasing partial pay profit rate
The risk of recessionary or boom
The risk of change in national risk and economic
structure
Exchange rate risk The risk of potential loaner firms multiplicity
The risk of debt in financial structure The risk of divisional
profit per share The risk of profit per
share
The risk of loaner situation The risk of inability in
interest payment The risk of inability in
loan payment
The risk of investment revenue Inflation risk The risk of tax
expenses The risk of bad paper
debt expenses The risk of benefit /loss
before tax discount
The risk of disability to perform short–term
obligations
The risk of disability in short–term financing The risk of difference
in order receiving The risk of specified
rules The risk of low demand
for goods or services
Consumer price risk Producers price risk Gross domestic
854
The proposed study of this paper uses analytical hierarchy process (AHP) to rank different factors (Chang,
1996; Saaty, 2004). First, we describe the statistical community and questions responses and then we rank
risk priorities based on AHP method. Fig. 2 demonstrates the summary of our statistics on people, who participated in our survey,
Job characteristics
Fig. 2. Personal characteristics of the participants
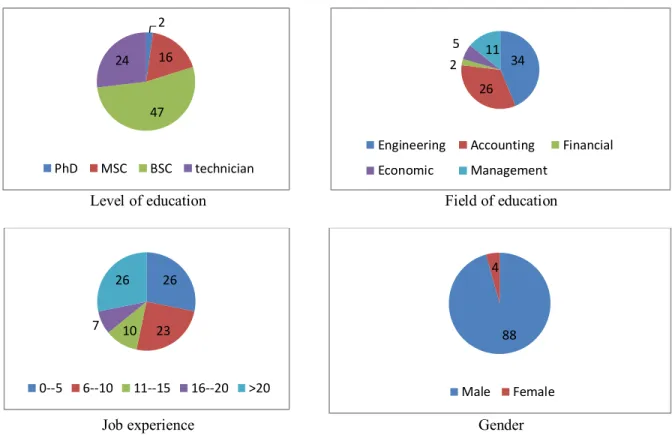
After reviewing global literature and extracting economic risk indices in big corporations, a questionnaire was distributed among experts for making a comment and final selection, which includes the most important economic risk indices. The statistical community was divided based on their responsibilities on different groups. Fig. 3 and Fig. 4 demonstrate the summary of participants’ gender and educational backgrounds.
Level of education Field of education
Job experience Gender
Fig. 3. Personal characteristics of the participants
As we can observe from the figures, the most frequency is related to financial and production personnel. In our survey, 95 percent of participants were male 5 percent of them were female. In
1 2
4 2
37 37
Executive director board director Financial managers
Production managers Financial personnel Production personnel
2
16
47 24
PhD MSC BSC technician
34 26 2
5 11
Engineering Accounting Financial
Economic Management
26
23 10 7
26
0--5 6--10 11--15 16--20 >20
88 4
addition, most people had at least five years of job experiences and maintained a good university background. In The risk factors were evaluated based on expert interviewing. Each factor was evaluated with a question that responded with 1-9 as factor important or effect. Table 1 demonstrates the summary of some basic statistics associated with 48 questions of the survey.
Table 1
The summary of some basic statistics
Question mean median Standard deviation Skewedness Kurtosis
1 8.21 8.11 0.9854 -0.8554 -0.154
2 7.39 7.09 0.9654 -0.587 -0.2547
3
8.32 8.47 0.9457 -0.8587 -0.5848
4
3.214 3.30 0.8540 -0.8658 -0.5415
5
7.14 7.74 0.8945 -0.8745 -0.51458
6
8.21 8.64 0.4815 -0.3580 -0.547
7
8.47 8.01 0.8784 -0.8745 -0.2154
8
7.21 7.29 0.8895 -0.2547 -0.875
9
6.54 6.74 0.5647 -0.6587 -0.3265
10
8.23 8.94 0.8795 -0.5478 -0.5478
11
7.74 7.64 0.5468 -0.5478 -0.6587
12
6.38 6.11 0.8745 -0.4587 -0.22145
13
7.10 7.19 0.8401 -0.6985 -0.3698
14
2.47 2.41 0.6748 -0.4587 -0.2159
15
7.41 7.69 0.564 -0.3254 -0.3658
16
7.20 7.30 0.6478 -0.7854 -0.1547
17
7.14 7.74 0.87 -0.4587 -0.369
18
7.25 7.11 0.6587 -0.2549 -0.6598
19
4.87 4.98 0.687 -0.5478 -0.4587
20
7.74 7.47 0.5678 -0.6587 -0.6589
21
8.32 8.66 0.567 -0.8554 -0.2154
22
8.28 8.41 0.5648 -0.8547 -0.6985
23
6.98 6.02 0.5674 -0.5698 -0.3659
24 6.38 6.47 0.564 -0.7854 -0.2547
25 3.55 3.03 0.897 -0.5587 -0.6985
26 7.21 7.67 0.6587 -0.8754 -0.6985
27 8.31 8.24 0.564 -0.5874 -0.3658
28
8.64 8.60 0.674 -0.906 -0.96985
29
7.12 7.07 0.564 -0.965 -0.6985
30
7.99 7.54 0.587 -0.879 -0.2545
31
7.95 7.64 0.6785 -0.7854 -0.5874
32
8.31 8.42 0.5102 -0.879 -0.65987
33
8.31 8.31 0.7454 -0.8554 -0.25487
34
6.94 6.64 0.865 -0.879 -0.3658
35
8.37 8.37 0.645 -0.9541 -0.32326
36
7.23 7.23 0.685 -0.879 -0.1254
37
2.60 2.60 0.658 -0.9632 -0.5478
38
8.31 8.31 0.854 -0.8554 -0.2154
39
7.1 7.1 0.587 -0.879 -0.6598
40
8.22 8.22 0.657 -0.8554 -0.3658
41
7.15 7.15 0.654 -0.879 -0.3154
42
7.36 7.36 0.687 -0.8554 -0.956
43
3.08 3.08 0.658 -0.9965 -0.5487
44
7.98 7.98 0.849 -0.7854 -0.3998
45
8.69 8.69 0.894 -0.9854 -0.015
46
2.87 2.87 0.859 -0.9658 -0.6596
47
6.98 6.98 0.859 -0.154 -0.5987
48
7.21 7.21 0.689 -0.587 -0.3369
856 Table 2
The summary of priority of the main five risk factors
Measure Financing risk Credit risk Liquidity risk Inflation risk Exchange risk
Priority 0.293 0.251 0.177 0.147 0.128
As we can observe from the results of Table 2, financing risk maintains the highest priority followed by credit risk, liquidity risk, inflation risk and exchange risk. Table 3 shows details of our investigation on ranking risks associated with financing expenses.
Table 3
The summary of risk associated with financing expenses
Priority Description of risk factor
0.271 The risk of profit per share
0.186 The risk of divisional profit per share
0.043 The risk of debt in financial structure
0.088 The risk of potential loaner firms multiplicity
0.114 Exchange rate risk
0.054 The risk of change in national risk and economic structure
0.124 The risk of recessionary or boom
0.120 The risk of increasing partial pay profit rate
As we can observe from the results of Table 3, risk of profit per share is number one priority followed by the risk of divisional profit per share, the risk of recessionary or boom and the risk of increasing partial pay profit rate. Credit risk is another component and Table 4 demonstrates the summary of our ranking.
Table 4
The summary of credit risk
Priority Description of risk factor
0.325 The risk of inability in loan payment
0.154 The risk of inability in interest payment
0.494 The risk of loan situation
Based on the results of Table 4, the risk of loan is number one priority followed by the risk of inability of loan payment and interest payment. The next risk factor is associated with liquidity risk and Table 5 shows details of our ranking using AHP method.
Table 5
The summary of liquidity risk
Priority Description of risk factor
0.191 The risk of low demand for goods or services
0.121 The risk of specified rules
0.042 The risk of difference in order receiving
0.035 The risk of disability in short–term financing
0.16 The risk of disability to perform short–term obligations
0.078 The risk of benefit /loss before tax discount
0.107 The risk of bad paper debt expenses
0.098 The risk of tax expenses
0.099 Inflation risk
0.069 The risk of investment revenue
Table 6
The summary of risk factors associated with inflation
Priority Description of risk factor
0.248 Gross domestic product risk
0.324 Producers price risk
0.125 Producers price risk
0.303 Consumer price risk
The results of Table 6 specify that producers price risk is the most important factor followed by consumer price risk, gross domestic product and producers price risk. Finally, exchange rate risk is the last component of the survey and Table 7 shows details of our survey.
Table 7
The summary of risk factors associated with exchange rate
Priority Description of risk factor
0.140 Export independence risk
0.025 Prices stability production and productive capacity risk
0.036 Goods full mobility risk
0.104 Prices stability risk
0.123 Lack of complete employment risk
0.012 Risk of uncertainty about macro-processes
0.098 The risk of agency's capability in temporary payment
0.032 Risk of inter-industry trade
0.13 Risk of foreign producers multiplicity
0.103 Risk of agency's capability in production
In terms of different factors influencing exchange risk, export related issues are considered as the most important factors. In addition, factors associated with employment, and agency’s capability in production is other important factor.
3. Conclusion
In this paper, we have presented an empirical investigation to rank various risk factors including financing risk, credit risk, liquidity risk, inflation risk and exchange risk using AHP method. The results have indicated that financing risk maintains the highest priority followed by credit risk, liquidity risk, inflation risk and exchange risk. In terms of different risks associated with financing risk, risk of profit per share has been the number one priority followed by the risk of divisional profit per share, the risk of recessionary or boom and the risk of increasing partial pay profit rate. In terms of credit risk, the risk of loan has been number one priority followed by the risk of inability of loan payment and interest payment. Liquidity risk is another risk factor where demand has been the most important factor followed by rules and regulations and inflation risk. In terms of inflation, producers price risk has been the most important factor followed by consumer price risk, gross domestic product and producers price risk. Finally, in terms of different factors influencing exchange risk, export related issues are considered as the most important factors.
Acknowledgement
The authors would like to thank the anonymous referees for constructive comments on earlier version of this paper.
References
Belk, P. A., & Edelshain, D. J. (1997). Foreign exchange risk management—the paradox. Managerial
858
Chang, D. Y. (1996). Applications of the extent analysis method on fuzzy AHP. European journal of
operational research, 95(3), 649-655.
Christoffersen, P., & Gonçalves, S. (2004). Estimation risk in financial risk management. CIRANO.
Cooper, W.W., Kingyens, A.T., Paradi, J.C. (2014). Two-stage financial risk tolerance assessment
using data envelopment analysis. European Journal of Operational Research, 233(1), 273-280
Lee, A. H., Chen, W. C., & Chang, C. J. (2008). A fuzzy AHP and BSC approach for evaluating
performance of IT department in the manufacturing industry in Taiwan. Expert systems with
applications, 34(1), 96-107.
Licht, G., & Nerlinger, E. (1998). New technology-based firms in Germany: a survey of the recent
evidence. Research Policy, 26(9), 1005-1022.
Pongsakdi, A., Rangsunvigit, P., Siemanond, K., & Bagajewicz, M. J. (2006). Financial risk
management in the planning of refinery operations. International Journal of Production
Economics, 103(1), 64-86.
Raz, T., & Michael, E. (2001). Use and benefits of tools for project risk management. International
Journal of Project Management, 19(1), 9-17.
Saaty, T. L. (2004). Decision making—the analytic hierarchy and network processes
(AHP/ANP). Journal of systems science and systems engineering,13(1), 1-35.
Shih, H. S., Shyur, H. J., & Lee, E. S. (2007). An extension of TOPSIS for group decision
making. Mathematical and Computer Modelling, 45(7), 801-813.
Short, J. F. (1984). The social fabric at risk: toward the social transformation of risk
analysis. American sociological review, 49, 711-725.
Stoneburner, G., Goguen, A., & Feringa, A. (2002). Risk management guide for information
technology systems. Nist special publication, 800(30), 800-30.
Wang, Y. J., & Lee, H. S. (2007). Generalizing TOPSIS for fuzzy multiple-criteria group