*Corresponding author. Tel: +98-912-2995919 E-mail address: [email protected] (P. Motamedi)
© 2013 Growing Science Ltd. All rights reserved. doi: 10.5267/j.msl.2013.08.017
Contents lists available at GrowingScience
Management Science Letters
homepage: www.GrowingScience.com/msl
Investigating different factors influencing on return of private banks
Pegah Motamedi*
Master's Degree of Accounting, School of Management and Human Sciences, Tehran North Branch, Islamic Azad University (IAU), Tehran, Iran
C H R O N I C L E A B S T R A C T
Article history: Received May 16, 2013 Received in revised format 28 June 2013
Accepted 10 August 2013 Available online August 11 2013
Return of Investment has always been an interesting area of research among academics as well as investors. Although capital asset pricing model (CAPM) is capable of estimating risk of investment, many people argue that CAPM is not able to predict long-term return, properly. This paper presents an empirical investigation to find the effects of different financial figures including systematic risk (Beta), size of firm, ratio of book value to market share, volume of trade and the ratio of price/earnings (P/E) on return of private banks in Iran. The study gathers the necessary information over the period 2005-2011 from private banks in Iran. The study uses multiple regression technique to find the effects of mentioned variables on return of private banks. The results indicate that there are some meaningful and positive relationship between return of banks and systematic risk (Beta), size, volume of trade and P/E. The study also finds some meaningful and reverse relationship between bank return and book value on market value.
© 2013 Growing Science Ltd. All rights reserved.
Keywords:
Stock return Banking industry Systematic risk Bank size
1. Introduction
Return of investment has always been an interesting area of research among academics as well as investors. Although capital asset pricing model (CAPM) is capable of estimating risk of investment, many people argue that CAPM is not able to predict long-term return, properly (Datar et al., 1998;
Kiel & Nicholson, 2003). Acharya and Pedersen (2005), for instance, solved a simple equilibrium
model with liquidity risk, explicitly. In this liquidity-adjusted CAPM, a security's required return depends on its expected liquidity as well as on the covariances of its own return and liquidity with the market return and liquidity. The empirical results emphasized on the total and relative economic significance of these channels and provided evidence of flight to liquidity. Fama and French (1992,
as lower bid–ask spreads, a lower price effect of trade, or higher turnover–predict lower subsequent returns in both firm-level and aggregate data. The model presented a class of irrational investors, who underreact to the data contained in order flow, thereby boosting liquidity. Billings and Morton (2001) investigated whether the ability of book-to-market to forecast returns derives from systematic errors in the market’s anticipation of future earnings. They extended Beaver and Ryan (2000) by decomposing book-to-market into a more bias component and a delayed lag component. They reported that both components are associated with analyst expectations of future earnings, but the lag component was the dominant factor across all forecast horizons. They also reported that the lag component explained most of the inverse relationship between book-to-market and future returns. Given that lag was built by regressing book-to-market ratios on lagged price changes, their results were consistent with the lag component capturing systematic stock price reversals. They also reported that the components had unique relationship with subsequent earnings prediction revisions, and controlling for these relationships substantially mitigated the components’ capability to forecast returns.
Bortolotti et al. (2007) demonstrated that share issue privatization (SIP) was a major source of domestic stock market liquidity in 19 developed economies. Chan and Faff (2003) performed an investigation into the effect of liquidity in asset pricing. They found that turnover was negatively associated with stock returns and its importance persists even after controlling for book-to-market, size, stock beta and momentum. Chordia and Swaminathan (2000) reported that trading volume was a significant determinant of the lead-lag patterns observed in stock returns. Their results indicated that differential speed of adjustment to information was a substantial source of the cross-autocorrelation patterns in short-horizon stock returns.
Jensen et al. (1997) provided some evidences on size and price-to-book effects in stock returns. Chen (2005) performed an empirical investigation on pervasive liquidity risk and asset pricing. Demir et al. (2004) investigated the returns to short-term and intermediate-horizon momentum strategies in the Australian equity market. They concentrated on ‘practical’ or ‘realistic’ investment strategies, and reported that momentum was prevalent in the Australian market and that the returns were of greater magnitude than previously found in overseas markets. They also examined the interaction of momentum on size and liquidity variables and reported that the observed profits to these investment strategies were not explained by size or liquidity differences among the stocks.
Liu (2006) presented a liquidity-augmented capital asset pricing model. Marshall and Young (2003) investigated liquidity and stock returns in pure order-driven markets by looking into some evidences
from the Australian stock market. Martınez et al. (2005) studied the relationship between asset
pricing and systematic liquidity risk in an empirical investigation of the Spanish stock market. Loukil et al. (2010) investigated the impact of liquidity on stock returns: an empirical investigation of the Tunisian stock market. Penman (1996) investigated the articulation of price-earnings ratios and market-to-book ratios and the evaluation of growth.
2. The proposed study
P. Motamedi / Management Science Letters 3 (2013)
2469
11
1 ) ( )
t t
it
t
p p c d
R
p c
,
(1)
where α and β are the percentage increase in equity through cash and saving, respectively. In addition, c is the cost of issuing the new share and d is the amount of dividend per share. Finally, pt and pt-1 are stock prices at t and t-1, respectively. Beta is a systematic risk, which is the result of economic change, inflation, etc. Size is another important variable in this study, which is calculated through taking natural logarithm of total assets. BTM is the other variable, which is calculated as a ratio of book value on market value. TOU is total number of shares traded during the fiscal year. P/E
is the ratio of price on earnings. The regression model of this paper is as follows,
it it i it i it i it i it i it
it P
R Beta SIZE BTM TOU
E
, (2)
where αit is the intercept, i, δi, i, ηi and i are coefficients to be estimated and itis the residual.
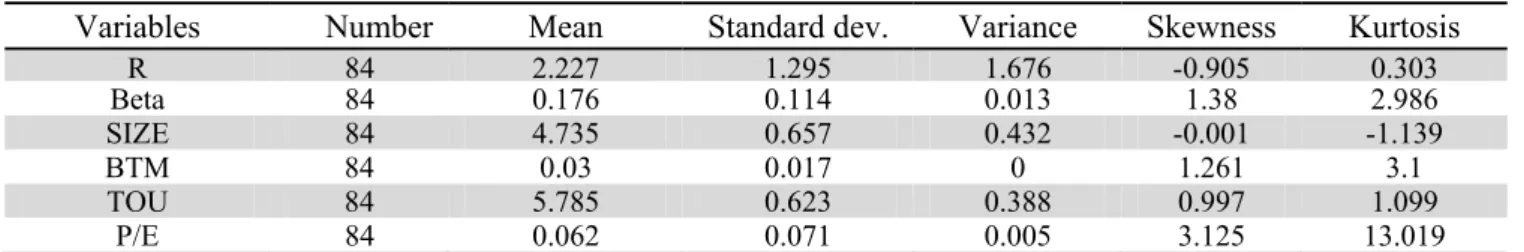
Table 1 demonstrates the results of some basic statistics associated with the proposed study of this paper.
Table 1
The results of some basic statistics
Variables Number Mean Standard dev. Variance Skewness Kurtosis
R 84 2.227 1.295 1.676 -0.905 0.303
Beta 84 0.176 0.114 0.013 1.38 2.986
SIZE 84 4.735 0.657 0.432 -0.001 -1.139
BTM 84 0.03 0.017 0 1.261 3.1
TOU 84 5.785 0.623 0.388 0.997 1.099
P/E 84 0.062 0.071 0.005 3.125 13.019
One of the most important steps before performing regression analysis is to make sure the data are normally distributed. This could be accomplished by performing three statistical tests namely Kolmogorov-Smirnov, Shapiro-Wilk and Jarque- bera. Table 2 shows details of our findings on these three variables,
Table 2
The results of normality test
Variable Number Kolmogorov-Smirnov Shapiro-Wilk Jarque- bera Statistics P-value Statistics P-value Statistics P-value
R 84 0.195 0 0.896 0 1.139991 0.565528
Beta 84 0.164 0 0.9 0 3.32137 0.190009
Size 84 0.095 0.18 0.96 0.021 3.921473 0.140755
BTM 84 0.251 0 0.896 0 5.968129 0.050587
TOU 84 0.167 0 0.949 0.006 1.042034 0.593916
P/E 84 0.07 0.2 0.988 0.337 2.391735 0.302441
As we can observe from the results of Table 2, most variables are normally distributed. Next, we need to make sure to use pooled or panel method for regression analysis. This could be verified through Chaw and Husman tests as follows,
Table 3
The results of Chaw and Husman tests
Objective Chaw Husman
F P-value Result Chi-square P-value Result
Model Pooled 1.828962 0.1202 EqualIntercept
The other action is to make sure there is no autocorrelation among residuals and all independent variables are linearly distributed. Table 4 demonstrates the results of our findings.
Table 4
The summary of Durbin-Watson, F-value and J_B tests
Model Linear relationship Durbin-Watson Residuals
F P-value D.WO D.WT J_B P-value
Model 13.76797 0.000324 1.644584 2.5-1.5 245.6704 0
The results of Table 4 demonstrate that the relationship is linear and there is no auto correlation among residuals. Another step is to see whether there is any strong correlation between independent variables or not. Table 5 demonstrates the results of our survey,
Table 5
The results of correlation among independent variables
R TOU SIZE BTM Beta P/E
R 0.729 0.461 -0.802 0.435 0.512
TOU 0.792 0.201 0.192 0.378 0.096
SIZE 0.461 0.201 0.312 0.377 0.163
BTM -0.802 0.192 0.312 0.4 0.342
Beta 0.435 0.378 0.377 0.4 0.194
P/E 0.512 0.096 0.163 0.342 0.194
The results of Table 5 do not imply there would be strong correlation among independent variables and we may take the regression analysis. Table 6 demonstrates the summary of our regression analysis,
Table 6
The summary of regression analysis
Variable Coefficient Standard error tStatistics
C 0.4463 0.1512 2.9501
Beta 0.731116 0.077003 9.494597
SIZE 0.4865 0.0739 6.5832
BTM -0.6600 0.2237 -2.9501
TOU 0.373 0.125 2.9839
P/E 0.100909 0.04579 2.203753
The results of regression analysis show that all coefficients are meaningful when the level of significance is one percent. Next, we present details of our findings on testing the hypotheses of this survey.
3. The results
In this section, we present details of our survey on testing various hypotheses of this survey.
3.1. The first hypothesis: The relationship between return and Beta
The first hypothesis of this survey examines whether there is any relationship between return of shares and Beta or not. According to Table 6 we have
.05 p 96 . 1 2.95
t
0.7311 ob
,R c
Beta t
P. Motamedi / Management Science Letters 3 (2013)
2471
which means there is a positive and meaningful relationship between return and Beta when the level of significance is five percent and we can confirm the first hypothesis of the survey.
3.2. The second hypothesis: The relationship between return and Size
The second hypothesis of this survey examines whether there is any relationship between return of shares and size of firm or not. According to Table 6 we have
.05 p 96 . 1 6.5832
t
0.4865 ob
,R c
SIZE t
,which means there is a positive and meaningful relationship between return and Size of firm when the level of significance is five percent and we can confirm the second hypothesis of the survey.
3.3. The third hypothesis: The relationship between return and the ratio of book value on market value
The third hypothesis of this survey examines whether there is any relationship between return of shares and the ratio of book value on market value or not. According to Table 6 we have
.05 p 96 . 1 2.9501
t
0.6600 ob
,R c
BTM t
,which means there is a negative and meaningful relationship between return and ratio of book value on market value of firm when the level of significance is five percent and we can confirm the third hypothesis of the survey.
3.4. The fourth hypothesis: The relationship between return and the volume of trades
The fourth hypothesis of this survey examines whether there is any relationship between return of shares and the volume of trades or not. According to Table 6 we have
.05 p 96 . 1 2.98
t
0.373 ob
,R c
TOU t
,which means there is a positive and meaningful relationship between return and the volume of trade when the level of significance is five percent and we can confirm the fourth hypothesis of the survey.
3.5. The fifth hypothesis: The relationship between return and P/E ratio
The fifth hypothesis of this survey examines whether there is any relationship between return and the P/E ratio or not. According to Table 6 we have
.05 p 96 . 1 2.98
t
0.373 ob
,
/ER c
P t
,which means there is a positive and meaningful relationship between return and the volume of trade when the level of significance is five percent and we can confirm the fourth hypothesis of the survey.
In summary, all hypotheses of this survey have been confirmed.
4. Conclusion
regression analysis verified various hypotheses. The results of the survey have confirmed that there were some positive and meaningful relationship between return of private banks and systematic risk, size of firm, volume of trade and P/E ratio. In addition, the study has confirmed that there was a negative relationship between ratio of book value on market value and return of private banks.
References
Acharya, V. V., & Pedersen, L. H. (2005). Asset pricing with liquidity risk. Journal of Financial
Economics, 77(2), 375-410.
Baker, M., & Stein, J. C. (2004). Market liquidity as a sentiment indicator. Journal of Financial
Markets, 7(3), 271-299.
Beaver, W. H., & Ryan, S. G. (2000). Biases and lags in book value and their effects on the ability of
the book-to-market ratio to predict book return on equity. Journal of Accounting Research, 38(1),
127-148.
Billings, B. K., & Morton, R. M. (2001). Book‐to‐market components, future security returns, and
errors in expected future earnings. Journal of Accounting Research, 39(2), 197-219.
Bortolotti, B., De Jong, F., Nicodano, G., & Schindele, I. (2007). Privatization and stock market
liquidity. Journal of Banking & Finance, 31(2), 297-316.
Chan, H. W., & Faff, R. W. (2003). An investigation into the role of liquidity in asset pricing:
Australian evidence. Pacific-Basin Finance Journal, 11(5), 555-572.
Chen, J. (2005). Pervasive liquidity risk and asset pricing. Unpublished Working Paper, Columbia
University.
Chordia, T., & Swaminathan, B. (2000). Trading volume and cross‐autocorrelations in stock
returns. The Journal of Finance, 55(2), 913-935.
Datar, V. T., Y Naik, N., & Radcliffe, R. (1998). Liquidity and stock returns: An alternative
test. Journal of Financial Markets, 1(2), 203-219.
Demir, I., Muthuswamy, J., & Walter, T. (2004). Momentum returns in Australian equities: The
influences of size, risk, liquidity and return computation. Pacific-Basin Finance Journal, 12(2),
143-158.
Fama, E. F., & French, K. R. (1992). The cross‐section of expected stock returns. Journal of
Finance, 47(2), 427-465.
Fama, E. F., & French, K. R. (1995). Size and book‐to‐market factors in earnings and returns. The
Journal of Finance, 50(1), 131-155.
Jensen, G. R., Johnson, R. R., & Mercer, J. M. (1997). New evidence on size and price-to-book
effects in stock returns. Financial Analysts Journal, 34-42.
Kiel, G. C., & Nicholson, G. J. (2003). Board composition and corporate performance: how the
Australian experience informs contrasting theories of corporate governance. Corporate
Governance: An International Review, 11(3), 189-205.
Liu, W. (2006). A liquidity-augmented capital asset pricing model. Journal of financial
Economics, 82(3), 631-671.
Loukil, N., Zayani, M. B., & Omri, A. (2010). Impact of liquidity on stock returns: an empirical
investigation of the Tunisian stock market. Macroeconomics and Finance in Emerging Market
Economies, 3(2), 261-283.
Marshall, B. R., & Young, M. (2003). Liquidity and stock returns in pure order-driven markets:
evidence from the Australian stock market. International Review of Financial Analysis, 12(2),
173-188.
Martınez, M. A., Nieto, B., Rubio, G., & Tapia, M. (2005). Asset pricing and systematic liquidity
risk: An empirical investigation of the Spanish stock market. International Review of Economics &
Finance, 14(1), 81-103.
Penman, S. H. (1996). The articulation of price-earnings ratios and market-to-book ratios and the