Evaluation of the zinox and zeolite materials
as adsorbents to remove H
2
S from natural gas
D.M.A. Melo
a,∗, J.R. de Souza
b, M.A.F. Melo
b,
A.E. Martinelli
a, G.H.B. Cachima
a, J.D. Cunha
aaLaborat´orio de An´alise T´ermica e Materiais, Departamento de Qu´ımica,
Universidade Federal do Rio Grande do Norte, CP: 1662, CEP: 59072-970, Natal, RN, Brazil
bDepartamento de Engenharia Qu´ımica, Universidade Federal do Rio Grande do Norte, CP: 1662, Natal, RN, Brazil
Received 31 May 2005; received in revised form 29 June 2005; accepted 8 July 2005 Available online 18 August 2005
Abstract
Mesoporous materials can be generally used as adsorbents to remove impurities from gases. During the past few years, H2S has been
removed from natural gas using materials such as dolomite, zeolites, and industrial compounds, which can be widely used by oil and natural gas companies. The present study focused on the use of Zeolite 13X and Zinox 380 as H2S adsorbent at 25◦C. They were characterized
by chemical analyses (X-ray fluorescence and atomic absorption), X-ray diffraction, particle size distribution analyses and FT Infrared spectroscopy. Adsorption reactions were carried out using proposed models. The results revealed that both materials studied could be used as H2S adsorbents in natural gas exceeding the capabilities of industrial compounds.
© 2005 Elsevier B.V. All rights reserved.
Keywords: Mesoporous materials; Natural gas; Zeolite
1. Introduction
The composition of fossil fuels includes sulfur compounds as its major contaminants. The main examples include
hydro-gen sulfide (H2S), mercaptanes (R-SH) and other organic
sulfides such as RS, RS2or R2S (where R represents either
an aryl or alkyl group). Sulfur is released to the atmosphere
in the form of SO2as a result of the combustion of gaseous
fuels. SO2 can be oxidized to water-soluble SO3 thus
pro-ducing the so-called acid rain, which is highly hazardous to
the environment and health. The H2S present in natural gas
is one of the major causes of corrosion in ducts and transport lines; in addition to being extremely toxic and lethal even in concentrations as low as a few ppm.
Several studies[1–12]have addressed the removal of
sul-furous compounds using adsorbent materials such as molecu-lar sieves and polymeric adsorbents. These materials depict a
∗Corresponding author. Tel.: +55 84 3211 9241; fax: +55 84 3211 9241. E-mail address:[email protected] (D.M.A. Melo).
series of valuable properties and characteristics to adsorption processes, including high specific area, porous bulk structure, uniform distribution of pores, good resistance to high temper-atures and improved selectivity. In this context, the present study aimed at evaluating the characteristics and performance of Zinox 380 (88% ZnO) and Zeolite 13X, particularly for future use by PETROBRAS Cia. in its Natural Gas Pro-cessing Plant located in Guamar´e, Northern Brazil. The new desulphurization process is based on the reaction of the sul-furous compounds present in natural gas with a solid material encountered in fixed bed reactors. As the bed is saturated and no longer reacts with sulfur, the resulting inert solid material can be safely discarded.
2. Experimental
Zeolite 13X was supplied by GRACE Corporation whereas zinc oxide (Zinox 380) was purchased from Oxiteno Brazil. These materials were chemically characterized by
atomic absorption using a VARIAN equipment and X-ray fluorescence in a SHIMADZU analyzer. Thermogravimetric curves and their corresponding derivatives were obtained in
a Perkin-Elmer TGA-7 thermal balance under N2flowing at
50 mL/min using 20 mg samples. The heating rate was set
to 10◦C/min and the temperature range from 40 to 900◦C
was monitored. Particle size distributions were determined according to ABNT guidelines down to 100 meshes. Powder X-ray diffraction patterns were obtained using a SIEMENS
apparatus. Cu K␣ radiation was used to scan the angular
range 5≤2θ≤75◦ at 1◦/min. FT-IR patterns in the 4000
to 500 cm−1 range were also obtained using a BOMEM
set-up to scan samples of the material dispersed into KBr pellets. The specific area of the powders was estimated using MICROMERITICS ASAP 2000 BET equipment. Prior to specific area measurements, the samples were maintained
under vacuum for 3 h at 200◦C in order to remove adsorbed
impurities. Nitrogen at 77 K was used as adsorbent gas for such analyses.
The adsorption column used in the experiments was 3.175 mm in diameter and 40 mm in height. It was made of 316 stainless steel to minimize effects related to
corro-sion by H2S. The system was fed with a synthetic mixture
of CH4/H2S at 100 ppm (White Martins Cia). The inlet
pres-sures were adjusted and the outlet flow was controlled using a Hooke micrometric valve. The temperature of the column was maintained constant using a thermostatic bath from Auto-matic Systems Laboratories. The flow of gas to the column was monitored using a digital ADM 1000 flow meter by Humonics. Prior to adsorption runs, the bed was heated up
and purged with N24.6 (99.996 %) during 1 h. Natural gas
flowed into the adsorption column at 30mL/min. The
pres-sure was then adjusted to 5.0 kgf/cm2and temperature to 25
or 76◦C.
Gas chromatography was carried out using a Varian CP-3800 set-up equipped with a flame ionization detector (FID), a thermal conductivity detector (TCD) and a pulsed flame
photometric detector (PFPD). The concentration of H2S on
the bed was monitored by the PFPD. A Varian CP Sil 5 CB chromatographic column was used to isolate the sulfurous compounds from natural gas. Rupture curves were obtained from mass balance aiming at establishing the volume of gas adsorbed by the solid. To that end, the following equations were used.
Mass of incoming adsorbate up to timet:
Min=QC0 t
0
dt=QC0t (1)
Mass of outcoming adsorbate up to timet:
Mout=Q t
0
Cdt=QC0 t
0 C C0
dt (2)
Hence, the adsorbed mass can be expressed as:
Mads =Min−Mout (3)
alternatively rewritten as:
Mads=QC0t−QC0 t
0 C C0
dt (4)
or:
Mads=QC0 t
0
1− C
C0
dt (5)
whereQis the flow (mL/min),Co, the initial concentration
of H2S (ppm),C, the concentration of outcoming H2S (ppm)
andMadsadsorbed mass (mg/g).
Some theoretical models were used to correlate the adsorption equilibrium data, including Langmuir’s model and one of its extensions as well as Freundlich’s, Langmuir–Freundlich’s and Toth’s models. The parameters used in these models were adjusted by the computer pro-gram Statistica 5.0. In addition, the Hooke-Jeeves and quasi-Newton methods were employed to determine the correlation coefficients. The Simplex method was used to recalculate the coefficients whenever the Hooke-Jeeves approach attributed unusually low values to those parameters.
3. Results and discussion
The chemical composition of Zeolite 13X was established as 1 Na2O: Al2O3: 2.8±0.2 SiO2: X H2O, where X depends
on the dryness or activation of the material. The average pore
size of zeolite was 10 ˚A. The composition of commercially
available Zinox 380 is 87.1 wt.% ZnO, 0.2 wt.% Na2O and
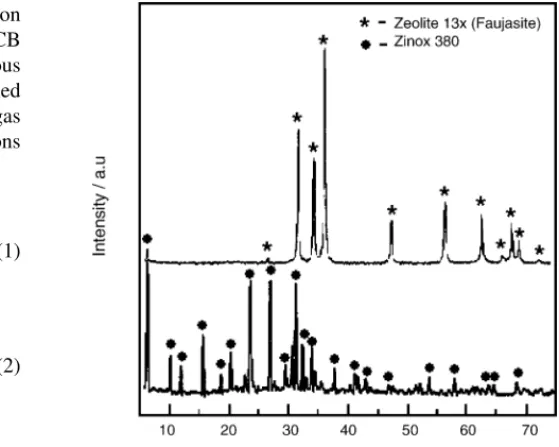
22.7% CaO. The X-ray diffraction patterns corresponding to
Zinox 380 and Zeolite 13X are shown inFig. 1. Zeolite 13X
revealed diffraction peaks typical of zeolites with the faujasite
structure (FAU)[13–15].
Results from thermogravimetric analyses performed in
Zinox 380 Fig. 2 shows 1.5 wt.% loss from 40 to 230◦C
Fig. 2. TG curves of Zinox 380 and Zeolite 13X.
corresponding to hydration water. This material is stable up
to 850◦C, at which temperature a stable oxide is formed.
The thermal behavior of Zeolite 13X. Fig. 2 shows three
different stages of weight loss corresponding to hydration water, zeolitic water and dehydroxylation. The infrared
spec-tra corresponding to Zinox 380 is shown inFig. 3.
Stretch-ing bands correspondStretch-ing toνOHfrom hydration water were
observed between 3000 and 3500 cm−1along with a band
around 1400 cm−1characteristic of calcium oxide. Finally,
bands in the vicinity of 1100 cm−1, characteristic of the TO 4
(T= Zn) interaction and 1600 cm−1, characteristic of
hydrox-yls were also observed. The infrared profile of zeoliteFig. 3
shows characteristic bands at 450, 550, 750 and 1100 cm−1
corresponding to SiO4and AlO2tetrahedra. Bands around
3500 cm−1were also observed and attributed to hydroxyls.
The nitrogen adsorption–desorption isotherms illustrated inFig. 4depict type IV characteristic behavior. The point
whereP/Po= 1 corresponds to complete pore filling up. The
hysteresis observed from all samples corresponded to capil-lary condensation. This situation takes place as the equilib-rium vapor pressure over a concave liquid meniscus is lower
than the saturation vapor pressure (Po) at the same
temper-ature. As a consequence, vapor typically condenses in the mesopores of a solid whenever the relative pressure is lower
Fig. 3. Infrared spectra of Zinox 380 and Zeolite 13X.
Fig. 4. Nitrogen adsorption isotherms of Zinox 380 and Zeolite 13X.
than unit. The specific surface area of Zinox and Zeolite 13X
were 34.54 m2/g and 16.15 m2/g, respectively. These values
were in good agreement with the estimated area of a few micropores for both adsorbent samples. Such feature is ideal to oxides and zeolites and indicates that the material is ade-quate to be used as adsorbent to natural gas.
The isotherms and rupture plots for each adsorbent tested
are shown inFigs. 5–8. Adsorption equilibrium experiments
were carried out at 25 and 76◦C. These values were selected
to simulate, respectively, ambient and operational tempera-tures typical of PETROBRAS unit in Guamar´e-RN/Brazil.
The equilibrium for the adsorption of H2S molecules onto
the surface of adsorbents granted information with respect to the adsorption capacity, saturation time, isotherm type, sur-face properties and adsorbent–adsorbate interaction. Exper-imental data were correlated to models represented by Eqs.
(1)–(5). Hooke-Jeeves and/or Simplex algorithms were used together with the quasi-Newton one in order to calculate the coefficients corresponding to each model. During the first 15 min, the slope of the plot for Zinox was higher at
Fig. 6. Rupture curves for Zinox 380 at 25◦C and at Zinox 380 at 76◦C.
Fig. 7. Adsorption isotherm for Zeolite 13X at 25◦C.
25◦C (Fig. 5) than at 76◦C (Fig. 5), suggesting that the interaction between adsorbent and adsorbate was stronger for relatively lower temperatures. The isotherms illustrated inFig. 5 show rapid adsorption at concentrations ranging from 0 to 10 ppm and from 20 to 90 ppm. After that, mod-erate adsorption was observed up to complete pore filling,
which occurred at concentrations of 9.5 mg H2S/g at 25◦C
and 6.0 mg H2S/g at 76◦C. The parameters obtained or the
correlations of the experimental data with theoretical models
are listed inTable 1. A good correlation could be observed
using Toth’s model.
The rupture curve for Zinox at 25◦C (Fig. 6) remained
constant during the first 300 min. The concentration in the entrance of the bed was 100 ppm, and a reduction from this
Fig. 8. Rupture curve for Zeolite 13X at 25◦C.
value to zero could be observed in that time interval. Next, the concentration in the exit of the bed increased up to saturation
(C/Co= 1). On the other hand, the rupture curve at 76◦C
(Fig. 6) revealed that C/Co remained constant only during
the first 150 min for Zinox 380 and the final concentration
was the same as that shown in Fig. 6. Table 2 shows the
parameters for the models of the desulphurization isotherms
for Zinox 380 at 76◦C.
The isotherm represented inFig. 7, corresponding to
Zeo-lite 13X, showed better results for the desulphurization of
natural gas. The maximum adsorption capacity at 25◦C was
53 mg H2S/g of adsorbent. Once again, Toth’s model best
fit-ted the experimental results, as confirmed by the parameters
listed inTable 3. The rupture curve is shown in Fig. 8and
corresponded to long saturation times (approximately 36 h). The materials characterized herein depicted the
perfor-mance required by PETROBRAS to adsorb H2S from
nat-ural gas. Nevertheless, isotherms acquired under the same
temperature (25◦C) revealed better adsorption of H
2S by
Zeolite 13X. This is probably related to the distinct nature of the porosity for Zinox 380 (micropores) and zeolite (meso-poros). For Zinox 380, increasing the temperature decreased
both the absorbed volume of H2S and the saturation time
(16.67 h at 25◦C and 13.36 h at 76◦C), suggesting that the
TSA method can be used in the regeneration of the bed. Eqs.(1)–(5)satisfactory establish correlations between equi-librium data. In most cases, Toth’s and Freundlich’s were adequate to fit the desulphurization process of natural gas, as suggested by the corresponding values of the correlation
Table 1
Parameters of the models for the desulphurization isotherms of Zinox 380 at 25◦C Models
Langmuir Freundlich LangFre LangFre3P LangExtend Toth
qs 8.381 – 23.294 18.83 9.685 39.748
b 2.594 4.601 0.2495 0.007 850686.6 549.02×10⁵
c – 6.554 0.2089 0.229 890.116 0.088
Table 2
Parameters for the models of the desulphurization isotherms for Zinox 380 at 76◦C Models
Langmuir Freundlich LangFre LangFre3Pa LangExtend Toth
qs 5.666 – 31.141 13.212 7.178 122.3956
b 0.391 2.444 0.084 0.0052 540814.2 253680582
c – 5.029 0.227 0.2862 1707.99 0.0644
R 0.936 0.989 0.989 0.987 0.976 0.988
aSimplex method.
Table 3
Parameters of the models for the desulphurization isotherms of Zeolite 13X at 25◦C MODELS
Langmuir Freundlich LangFre LangFre3P LangExtend Toth
qs 37.540 – 45.221 – 48.782
b 1.0191 17.764 – 0.5166 – 3.647
c – 4.339 – 0.604 – 0.452
R 0.973 0.968 – 0.983 – 0.984
coefficients,R, listed inTables 1–3. Best fitting was achieved
by the Langmuir–Freundlich 3P model at 25◦C and Toth’s
model at 76◦C. Strong indications of physical adsorption
were gathered for both adsorbent materials tested.
4. Conclusions
Both Zeolite 13X and Zinox 380 can be used as adsorbents
to remove H2S from natural gas. Zeolite 13X revealed better
adsorption of H2S than Zinox at 25◦C. These results also
showed that the distinct nature of the porosity for Zinox 380 (micropores) and zeolite (mesoporos) as a function of tem-perature determined longer saturation times for Zeolite 13X
(36.5 h at 25◦C). In most cases, Toth’s and Freundlich’s
mod-els were adequate to fit the desulphurization process of natural gas, as suggested by the corresponding values of the correla-tion coefficients,R. Strong indications of physical adsorption were also observed for both adsorbent materials tested.
Acknowledgement
This work was supported by Conselho Nacional de Pesquisa e Desenvolvimento (CNPq), Project CT-PETRO 2002.
References
[1] T. Kopac, Chem. Eng. Process. 38 (1) (1999) 45.
[2] D.M. Ruthven, Zeolite as selective adsorbents, Chem. Eng. Prog., 1988.
[3] S.V. Gollakota, D. Chriswell, Ind. Eng. Chem. Res. 27 (1) (1988) 139;
A. Al-Shawabkeh, H. Matsuda, M. Hasatani, AIChE J. 43 (1) (1997) 173.
[4] J. Tantet, M. Eic, R. Desal, Gas Sep. Purif. 9 (3) (1995) 213. [5] T.J. Bandosz, Carbon 37 (1999) 483.
[6] M.P. Cal, B.W. Stricker, A.A. Lizzio, Carbon 38 (2000) 1757. [7] M.P. Cal, B.W. Stricker, A.A. Lizzio, S.K. Gangwal, Carbon 38
(2000) 1767.
[8] H.L. Chiang, J.H. Tsai, D.H. Chang, F.T. Jeng, Chemosphere 41 (2000) 1227.
[9] E.S. Kikkinides, R.T. Young, Ind. Eng. Chem. Res 30 (1991) 1981.
[10] E.S. Kikkinides, R.T Yang, Ind. Eng. Chem. Res. 32 (10) (1993) 2365.
[11] M. Mello, M. Eic., Porous Mater. Environ. Friendly Process 125 (1999) 657.
[12] H. Wakita, Y. Tachibana, M. Hosaka, Micropor. Mesopor. Mater. 46 (2001) 237.
[13] M.M.J. Treacy, J.B. Higgins (Eds.), Collection of Simulated XRD Powder Patterns for Zeolites, 4th ed., International Zeolite Associa-tion, Elsevier, 2001.
[14] W.M. Meier, D.H. Olson, C. Baerlocher, Atlas of Zeolite Structure Types, Elsevier, New York, 1996.