Differs from Non-Diabetic Adults
Nadja Larsen1*, Finn K. Vogensen1, Frans W. J. van den Berg1, Dennis Sandris Nielsen1, Anne Sofie Andreasen2, Bente K. Pedersen2, Waleed Abu Al-Soud3, Søren J. Sørensen3, Lars H. Hansen3, Mogens
Jakobsen1
1Department of Food Science, University of Copenhagen, Frederiksberg, Denmark,2Department of Infectious Diseases and CMRC, University Hospital Rigshospitalet, Copenhagen, Denmark,3Department of Biology, University of Copenhagen, Copenhagen, Denmark
Abstract
Background:Recent evidence suggests that there is a link between metabolic diseases and bacterial populations in the gut. The aim of this study was to assess the differences between the composition of the intestinal microbiota in humans with type 2 diabetes and non-diabetic persons as control.
Methods and Findings:The study included 36 male adults with a broad range of age and body-mass indices (BMIs), among which 18 subjects were diagnosed with diabetes type 2. The fecal bacterial composition was investigated by real-time quantitative PCR (qPCR) and in a subgroup of subjects (N = 20) by tag-encoded amplicon pyrosequencing of the V4 region of the 16S rRNA gene. The proportions of phylumFirmicutesand classClostridiawere significantly reduced in the diabetic group compared to the control group (P = 0.03). Furthermore, the ratios ofBacteroidetestoFirmicutesas well as the ratios of Bacteroides-Prevotella group to C. coccoides-E. rectale group correlated positively and significantly with plasma glucose concentration (P = 0.04) but not with BMIs. Similarly, classBetaproteobacteriawas highly enriched in diabetic compared to non-diabetic persons (P = 0.02) and positively correlated with plasma glucose (P = 0.04).
Conclusions:The results of this study indicate that type 2 diabetes in humans is associated with compositional changes in intestinal microbiota. The level of glucose tolerance should be considered when linking microbiota with metabolic diseases such as obesity and developing strategies to control metabolic diseases by modifying the gut microbiota.
Citation:Larsen N, Vogensen FK, van den Berg FWJ, Nielsen DS, Andreasen AS, et al. (2010) Gut Microbiota in Human Adults with Type 2 Diabetes Differs from Non-Diabetic Adults. PLoS ONE 5(2): e9085. doi:10.1371/journal.pone.0009085
Editor:Stefan Bereswill, Charite´-Universita¨tsmedizin Berlin, Germany
ReceivedJanuary 11, 2010;AcceptedJanuary 17, 2010;PublishedFebruary 5, 2010
Copyright:ß2010 Larsen et al. This is an open-access article distributed under the terms of the Creative Commons Attribution License, which permits unrestricted use, distribution, and reproduction in any medium, provided the original author and source are credited.
Funding:This study was supported by the Danish Ministry of Food, Agriculture and Fisheries, The Danish Food Industry Agency (J.nr.3304-FSE-06-0501-1; www. dffe.dk). The funders had no role in study design, data collection and analysis, decision to publish, or preparation of the manuscript.
Competing Interests:The authors have declared that no competing interests exist.
* E-mail: [email protected]
Introduction
Type 2 diabetes is a metabolic disease which primary cause is obesity-linked insulin resistance. However, some other factors like mental stress, infection and genetic predisposition might lead to diabetes as well [1-4]. Both obesity and diabetes are characterized by a state of chronic low-grade inflammation with abnormal expression and production of multiple inflammatory mediators such as tumor necrosis factor and interleukins [5]. Recent studies based on large-scale 16S rRNA gene sequencing and more limited techniques, based on quantitative real time PCR (qPCR) and fluorescent in situ hybridization (FISH), have shown a relationship between the composition of the intestinal microbiota and metabolic diseases like obesity and diabetes. For example, levels of Bifidobacterium significantly and positively correlated with improved glucose-tolerance and low-grade inflammation in prebiotic treated-mice [1,6]. Furthermore, the development of diabetes type 1 in rats was reported to be associated with higher amounts ofBacteroidesssp. [7]. It has been proposed that the gut microbiota directed increased monosaccharide uptake from the gut and instructed the host to increase hepatic production of
triglycerides associated with the development of insulin resistance [8].
Several studies on mice models and in humans provided evidence that increase in body weight was associated with a larger proportion ofFirmicutesand relatively lessBacteroidetes[9-11]. In accordance with these results, Zhang and coworkers [12] demonstrated thatFirmicutes
were significantly decreased in post-gastric-bypass individuals, and
Prevotellaceaehighly enriched in obese individuals. The differences in microbial composition were explained by an increased capacity of the obesity-associated microbiome to harvest energy from the diet [13]. Controversial data were recently reported by Schwiertz and colleagues [14]. They determined lower ratios of Firmicutes to
Bacterodetesin overweight human adults compared to lean controls. Another study, using weight loss diets, found no proof of the link between the proportion ofBacteroidetesand Firmicutes and human obesity [15]. Consequently, the composition of obese microbiome is still questionable and more scientific evidence is needed to elucidate the relationship between the gut microbial composition and metabolic diseases.
diabetes is generally considered as an attribute to obesity and thus far left behind as the focus of research. The objective of this study was to characterize the composition of fecal microbiota in adults with diabetes type 2 as compared to non-diabetic controls using tag-encoded amplicon pyrosequencing of the V4 region of the 16S rRNA gene and qPCR.
Results
Subjects
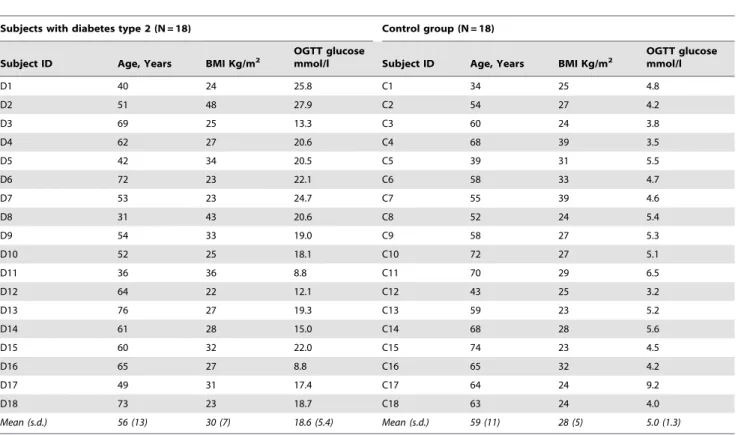
Subjects with type 2 diabetes (N = 18) and non-diabetic controls (N = 18) were all males at age 31 to 73 years and body mass indices (BMIs) ranging from 23 to 48 (Table 1). The diabetic group had elevated concentration of plasma glucose as determined by a fasting oral glucose tolerance test (OGTT). Subject C17, though having high plasma glucose, was referred to the non-diabetic group based on the measurements of baseline glucose and biochemical analysis of blood samples. The two groups were comparable with regard to their characteristics.
Characterization of the Intestinal Microbiota by Tag-Encoded Pyrosequencing
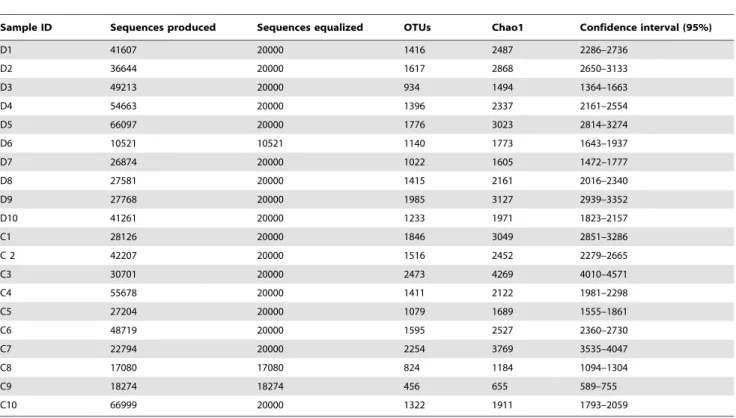
The total number of reads obtained for 20 subjects by V4 16S rRNA pyrosequencing was 1028955. After applying quality control and trimming we obtained 382229 high quality sequences from diabetic persons and 357782 sequences from healthy controls, accounting for 71.9% of the total reads (Table 2). The number of sequences varied between the subjects from 10521 to 66999 with a mean of 37000 (SD 16062). The average sequence length of trimmed sequences was 234 bp.
The mean bacterial diversity, as estimated by Chao1 indices from the equalized data sets (Table 2), was not different between the diabetic subjects and the controls, comprising 2287 (SD 587) and 2363 (SD 1113), respectively. However, the variability of Chao1 estimates between the diabetic subjects (Chao1 from 1364 to 2939) was lower compared to the controls (Chao1 from 589 to 4010). As shown by the rarefactions curves, bacterial diversity and richness in diabetic subjects with BMI more than 31 (Figure 1, D2, D5, D8 and D9) was somewhat higher than in lean diabetics, with the means Chao1 of 2785 (SD 436) and 1945 (SD 399), respectively. The same tendency was observed in the control group (Fig. 1, subjects C4, C6, C7 with BMI.31).
Sequences were distributed among 5 bacterial phyla including
Firmicutes and Bacteroidetes, together harboring on average up to 90% of sequences, as well as phylaProteobacteria,Actinobacteriaand
Verrumicrobia, each accounting for 1–4% of the sequences (Figure 2). The proportion ofFirmicuteswas significantly higher (P = 0.03) in the controls (mean 56.4%) compared to the diabetic group (mean 36.8%). Accordingly, phylum Bacteroidetes and Proteobacteria were somewhat but not significantly enriched in the diabetic group. Furthermore, ratios ofBacteroidetestoFirmicutescorrelated positively and significantly with the values of plasma glucose determined by OGTT (R = 0.47, P = 0.04) and negatively, though not signifi-cantly, with BMI (R =20.32, P = 0.17; Figure 3A, D). Relative abundances ofActinobacteriaandVerrumicrobiawere not significantly different between the groups (Figure 2).
PhylumBacteroideteswas primarily presented by classBacteroidetes
that was on average slightly increased in diabetics (44%) compared to controls (33%; Figure 2). Most of the sequences fromFirmicutes
belonged to the classClostridia, varying from 14 to 72% between
Table 1.Characteristics of the diabetic subjects and controls in the study: age, body mass index (BMI) and plasma glucose concentration measured by oral glucose tolerance test (OGTT).
Subjects with diabetes type 2 (N = 18) Control group (N = 18)
Subject ID Age, Years BMI Kg/m2
OGTT glucose
mmol/l Subject ID Age, Years BMI Kg/m2
OGTT glucose mmol/l
D1 40 24 25.8 C1 34 25 4.8
D2 51 48 27.9 C2 54 27 4.2
D3 69 25 13.3 C3 60 24 3.8
D4 62 27 20.6 C4 68 39 3.5
D5 42 34 20.5 C5 39 31 5.5
D6 72 23 22.1 C6 58 33 4.7
D7 53 23 24.7 C7 55 39 4.6
D8 31 43 20.6 C8 52 24 5.4
D9 54 33 19.0 C9 58 27 5.3
D10 52 25 18.1 C10 72 27 5.1
D11 36 36 8.8 C11 70 29 6.5
D12 64 22 12.1 C12 43 25 3.2
D13 76 27 19.3 C13 59 23 5.2
D14 61 28 15.0 C14 68 28 5.6
D15 60 32 22.0 C15 74 23 4.5
D16 65 27 8.8 C16 65 32 4.2
D17 49 31 17.4 C17 64 24 9.2
D18 73 23 18.7 C18 63 24 4.0
Mean (s.d.) 56 (13) 30 (7) 18.6 (5.4) Mean (s.d.) 59 (11) 28 (5) 5.0 (1.3)
the subjects. Other classes included Erysipelotrichi and Bacilli, accounting for less than 6% and 1% of the sequences, respectively. The proportion of Clostridia in diabetics was significantly lower than in controls (P = 0.03; means of 53% versus 34%, respectively) and showed a tendency to decrease with higher levels of plasma glucose (R =20.42, P = 0.06; Figure 3B). The relative abundance of classBacilliwas increased in diabetics at close to significant levels (mean 0.19% versus 0.03% in controls, P = 0.06; Figure 2). Similarly, class Betaproteobacteria, belonging to Proteobacteria, was highly enriched in subjects with diabetes (mean 2.09% versus
0.81% in controls; P = 0.02) and positively correlated (R = 0.46, P = 0.04) with plasma glucose (Fig. 3C). The relative abundances of bacterial genera (see SI Figure S1) were not significantly different between the groups. However, the proportion of genus
Roseburianegatively correlated with plasma glucose at levels close to significance (R =20.52, P = 0.06; data not shown), whereas the opposite trend was observed for the genus Prevotella (R = 0.32, P = 0.15; data not shown).
As seen from principal component analysis (PCA), a separation between the diabetic group and the control group at the level of Table 2.The number of sequences produced and equalized; the number of operational taxonomic units (OTUs) and richness estimates (Chao1) at 3% distance within fecal samples of the diabetic persons (D1-D10) and controls (C1–C10) as determined by pyrosequencing of the V4 region of the 16S rRNA gene.
Sample ID Sequences produced Sequences equalized OTUs Chao1 Confidence interval (95%)
D1 41607 20000 1416 2487 2286–2736
D2 36644 20000 1617 2868 2650–3133
D3 49213 20000 934 1494 1364–1663
D4 54663 20000 1396 2337 2161–2554
D5 66097 20000 1776 3023 2814–3274
D6 10521 10521 1140 1773 1643–1937
D7 26874 20000 1022 1605 1472–1777
D8 27581 20000 1415 2161 2016–2340
D9 27768 20000 1985 3127 2939–3352
D10 41261 20000 1233 1971 1823–2157
C1 28126 20000 1846 3049 2851–3286
C 2 42207 20000 1516 2452 2279–2665
C3 30701 20000 2473 4269 4010–4571
C4 55678 20000 1411 2122 1981–2298
C5 27204 20000 1079 1689 1555–1861
C6 48719 20000 1595 2527 2360–2730
C7 22794 20000 2254 3769 3535–4047
C8 17080 17080 824 1184 1094–1304
C9 18274 18274 456 655 589–755
C10 66999 20000 1322 1911 1793–2059
doi:10.1371/journal.pone.0009085.t002
Figure 1. Rarefaction curves.Rarefaction analysis of V4 pyrosequencing tags of the 16S rRNA gene in fecal microbiota from adults with diabetes type 2 (D1–D10) and non-diabetic controls (C1–C10). Sample codes are the same as in Table 1. Rarefaction curves were constructed at 3% distance using RDP release 10 (Pyrosequencing pipelines).
bacterial phyla could be best observed from PC1 and PC2 (Figure 4A; 45% and 28% of explained variance, respectively). It was attributed to Proteobacteria and Actinobacteria in the second direction (PC2) in combination withBacteroidesversusFirmicutesand
Verrumicrobiain the first direction (PC1). At the level of bacterial classes the variation was predominantly linked to a higher positive score for Betaproteobacteria, Bacteroidetes and Bacilli in the diabetic group, versus Clostridia and Erysipelotrichi in the control group (Figure 4B). The PCA plots of bacterial families generally indicated low levels of systematic variation where only 20–30 percent of the variation was explained by successive PCs, and no distinct clustering was observed (see SI Figure S2A). No association of the diabetic group with particular bacterial genera was apparent. Nevertheless, some of the diabetic persons (see SI Figure S2B, subjects D1, D3, D4, D6, D8, D10) could be discriminated from most of the controls by genusPrevotellaversus the combination of genera Lachnospiraceae IS, Roseburia and
Subdoligranulum (PC1 50%). PCA of multiple genera showed no clear grouping of the subjects with diabetes probably due to the high individual differences masking the systematic variation (data not shown).
Quantification of the Intestinal Microbiota by qPCR The total bacterial counts were similar in the diabetic and the control group having a median values of 10.6 (quartile ranges (QR)
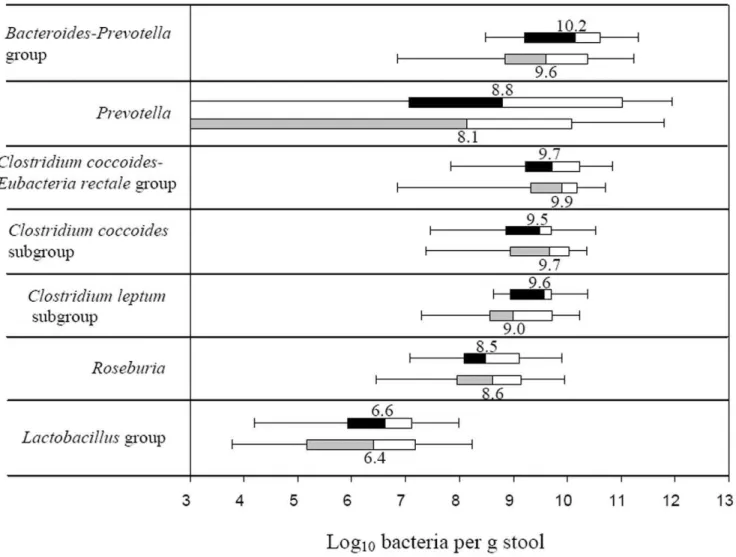
10.1–11.3) and 10.5 (QR 10.0–11.3) log10 bacteria per g stool, respectively. The estimates of bacterial groups and genera by qPCR are presented in Figure 5. In diabetic group the median counts of
Bacteroides-Prevotellagroup (10.2, QR 9.2–10.6), genusPrevotella(8.8, QR 7.6–11.5) andC. leptumsubgroup (9.6, QR 9.0–9.7) were slightly but not significantly increased compared to the controls by approximately 0.7 log10bacteria. GenusPrevotellawas assessed in 25 (14 diabetic subjects and 11 controls) out of 36 samples analysed, whilst for the remaining samples it was below the detection limit of the applied qPCR assay. The difference in median counts ofC. coccoides-E. rectale, C. coccoides and Lactobacillus groups, and genus
Roseburiabetween the diabetic persons and controls was less than 0.2 log10bacteria per g stool. The estimates ofPrevotellaandBacteroides -Prevotellagroup were in some qPCR assays higher that the counts of total bacteria. The explanation might be that the primers, used for quantification of total bacteria, were not universal enough to amplify all bacterial populations, or alternatively that the group-specific primers amplified other targets as well. To overcome this limitation and to assess the differences between the groups of subjects we used ratios of bacterial counts. The ratios ofBacteroides
-PrevotellatoC. coccoides-E. rectalegroup correlated significantly and positively (R = 0.38; P = 0.03) with plasma glucose (Figure 6A) but not with BMI (R = 0.06, P = 0.71). Likewise, a positive correlation with plasma glucose was found for the ratios ofBacteroides-Prevotellato
C. coccoidessubgroup (R = 0.46, P,0.01; data nor shown) and for the Figure 2. Relative abundances of bacterial phyla and classes.Relative abundances (%) of bacteria were determined in feces from human adults with type 2 diabetes (green triangles, N = 10) and non-diabetic controls (blue dots, N = 10) by pyrosequencing analysis of the V4 region of the 16S rRNA gene. Mean values are denoted by red crosses and numbers. Values out of scale are shown in brackets.
proportion of theLactobacillusgroup (R = 0.33, P = 0.05; Figure 6B). Higher ratios were in general related to a reduction in the C. coccoides-E. rectaleandC. coccoidesgroups.
Discussion
In this study we hypothesized that intestinal microbiota in humans with type 2 diabetes is different from non-diabetic persons. The hypothesis was tested on adults with a broad range of ages and BMIs, using pyrosequencing of the V4 region of the 16S rRNA gene and qPCR. To our knowledge no related studies on humans with diabetes type 2 have been published so far.
We demonstrated in this research that type 2 diabetes is associated with compositional changes in the intestinal microbiota mostly apparent at phylum and class levels. The relative abundance of Firmicutes was significantly lower, while the proportion of
Bacteroidetes and Proteobacteria was somewhat higher in diabetic persons compared to their non-diabetic counterparts. Accordingly, the ratios of Bacteroidetes to Firmicutes significantly and positively correlated with reduced glucose tolerance. Assuming that diabetes and impaired glucose tolerance are linked to obesity, our results are in agreement with the recent evidence obtained for overweight persons by Schwiertz and colleagues [14], though contradict with other studies [11]. Furthermore, based on the assumption above, a positive correlation between ratios ofBacteroidetestoFirmicutesand BMI could be expected. However, the reverse tendency was observed (Figure 3D), indicating that overweight and diabetes are associated with different groups of the intestinal microbiota.
Bacterial groups that distinguished the diabetic from the non-diabetic microbiome included Bacteroides-Prevotella group versus class Clostridia and C. coccoides-E.rectale group, which ratios were significantly higher in diabetic persons. These results are Figure 3. Correlation between OGTT or BMI and bacterial estimates by pyrosequencing.Correlation between OGTT plasma glucose and (A) ratios ofBacteroidetestoFirmicutes, (B) relative abundance ofClostridia, (C) relative abundance ofBetaproteobacteria. (D) Correlation between body mass indices and ratios ofBacteroidetestoFirmicutes. The Spearman Rank probability (P) and correlation (R) are shown in the graphs. Bacterial abundances were determined by pyrosequencing of the V4 region of the 16S rRNA gene in fecal bacterial DNA from human adults with type 2 diabetes (N = 10) and non-diabetic controls (N = 10).
supported by previous studies showing reduction in Bacteroides
-Prevotella spp. related to a strong decrease of metabolic endotox-emia and inflammation in type 2 diabetes mice [6]. Accordingly, a significant reduction inClostridiumssp,C. coccoidesand an increase in theBacteroides-Prevotellagroup along with body weight loss have been observed in human studies [16,17]. The significantly higher levels of Bacilli and the Lactobacillus group in diabetic subjects compared to controls in the present study, have recently been reported in relation to type 2 diabetes in mice models [6] and to obesity in human adults [17,18]. GenusLactobacillus represents a heterogeneous group with well documented immunomodulating properties [19] and might potentially contribute to chronic inflammation in diabetic subjects.
The tendency of increased Chao1 diversity concurrently with BMI observed in this study, might be related to the negative correlation between BMI andBacteroidetes/Firmicutesratios (Figure 3D) asFirmicutes
is a highly diverse division [12]. This observation is, however, in disagreement with recently published data on the obese twin pairs showing reduced bacterial diversity in obese individuals [11]. The reduced individual variation in diversity of the fecal microbiota observed in the diabetic group compared to the controls probably reflected the differences in diet, lifestyle or other factors [20] which are not possible to specify in the present study.
In an obesity study, using mice models, Cani and coworkers [21] proposed a hypothesis connecting metabolic diseases with the presence of Gram-negative bacteria in the gut, also offering a likely Figure 4. PCA plots of bacterial phyla and classes.PCA plots showing the grouping of human adults with type 2 diabetes (m, D1–D10) and non-diabetic controls (
N
, C1–C10) according to the abundances of bacterial phyla (A) and classes (B) in the fecal bacterial DNA as determined by pyrosequencing of the V4 region of the 16S rRNA gene.explanation of the differences between the diabetic and non-diabetic microbiomes in this study. The intestinal microbiota across the subjects with type 2 diabetes was relatively enriched with Gram-negative bacteria, belonging to the phylaBacteroidetes
and Proteobacteria. The main compounds of outer membranes in gram-negative bacteria are lipopolysaccharides (LPS), known as potent stimulators of inflammation, which can exhibit endotoxae-mia [22]. Consequently, LPS will continue to be produced within the gut, which might trigger an inflammatory response and play a role in the development of diabetes.
In conclusion, our data suggest that the levels of glucose tolerance or severity of diabetes should be considered while linking microbiota with obesity and other metabolic diseases in humans. It is especially important for developing the strategies to modify the gut microbiota in order to control metabolic diseases, since obesity and diabetes might be associated with different bacterial populations.
Methods
Subjects and Sample Collection
The study protocol was approved by the Ethical Committee of Copenhagen and Frederiksberg Municipalities (KF 01-320695)
and performed according to the declaration of Helsinki. Both written and verbal consent was obtained from the subjects of the study. The study included 36 males, diagnosed with type 2 diabetes (N = 18) or as being non-diabetic (N = 18) by their general practitioner confirmed by OGTT. The OGTT included the measurements of plasma glucose (mmol/l) at baseline and two hours after administration of 75 g glucose diluted in 500 ml of water. The BMIs were calculated from the formula: weight (kg)/ height (m)2. Subjects’ ages, BMIs (kg/m2) and 2-hour plasma glucose concentrations are presented in Table 1. Fecal samples were kept at 5uC immediately after defecation, brought to the laboratory within 24 hours and stored at280uC before analysis.
Extraction of Bacterial DNA from Fecal Samples
Total bacterial DNA was extracted from the fecal samples using the QIAamp DNA Stool Mini kit (QIAGEN, GmbH, Germany) according to the manufacturer’s protocol for pathogen detection with slight modifications [23]. DNA concentration and quality in the extracts was determined by agarose gel electrophoresis (1% wt/vol agarose in Tris-acetate-EDTA (TAE) buffer) and with a NanoDrop 1000 spectrophotometer Thermo Scientific (Saveen Werner ApS, Denmark).
Figure 5. Box-and-whisker plots of bacterial groups quantified by qPCR.Bacterial groups quantified by SYBR Green qPCR and expressed as Log10bacteria per g stool in human adults with type 2 diabetes (black and white boxes; N = 18) and non-diabetic controls (grey and white boxes;
N = 18). The median counts are presented by numbers. Boxes show the upper (75%) and the lower (25%) percentiles of the data. Whiskers indicate the highest and the smallest values.
Pyrosequencing
Tag-encoded amplicon pyrosequencing of fecal DNA was conducted for 10 persons with type 2 diabetes and 10 controls, matching in BMI and age. A selection criterion for diabetic persons was high severity of diabetes as evaluated by OGTT plasma glucose (Table 1). The primers used for pyrosequencing were a modified 530F-mod (GCCAGCMGCNGCGGTA; [24]) and 1061R (CRRCACGAGCTGACGAC; [25]) amplifying a 562 bp DNA fragment flanking the V4, V5 and V6 regions of the 16S rRNA gene ([26]; see SI Table S1). Modification of the primer 530F included two bases (TA) added to 39-end in order to increase primer specificity. The sequence coverage of the forward and reverse primers was tested using the Probe Match feature at the Ribosomal Database Project release 10 (RDP 10; http://rdp.cme. msu.edu; [27]). The DNA concentration was measured with a NanoDrop spectrophotometer and adjusted to 5 ng/ml for all
samples. PCR amplification (in a volume of 40ml) was performed
using 1x Phusion HF buffer, 2.5 mM magnesium chloride, 0.2 mM dNTP mixture, 0.8 U Phusion Hot Start DNA Polymerase (Finnzymes Oy, Espoo, Finland), 0.5mM of each
primer (TAG Copenhagen A/S, Denmark) and 1ml diluted DNA sample. PCR was performed using the following cycle conditions: an initial denaturation at 98uC for 30 s, followed by 30 cycles of denaturation at 98uC for 5 s, annealing at 53uC for 20 s, elongation at 72uC for 20 s, and then a final elongation step at 72uC for 5 min. The PCR products were run on an agarose gel and purified using the QIAEX II Gel Extraction Kit (QIAGEN). Second round of PCR was performed as described above, except that the primers with adapters and tags were used, the number of cycles was reduced to 10 and the annealing temperature was increased to 56uC. Addition of adapter and tags specific to each sample was done using the custom primers with adapter A and 10 tags (see SI Table S1) required for pyrosequencing [24]. The concentration of the tagged PCR product was determined by qPCR. The standard DNA used in qPCR was prepared from
Pseudomonas putidaand quantified against a standard concentration of 200 base ssDNA oligo (TAG Copenhagen A/S, Denmark). The qPCR was performed in a 25ml volume, using 1x Brilliant buffer
(Stratagene, Cedar Creek, Texas, USA), 0.5mM of each primer
FLX (forward: GCCTCCCTCGCGCCATCAG and reverse: GCCTTGCCAGCCCGCTCAG) and 1ml of diluted PCR
products with tags and adapters. Amplification was conducted using a Mx-3000 thermocycler (Stratagene) at the following conditions: an initial denaturation at 95uC for 10 min, followed by 40 cycles of denaturation at 95uC for 30 s, annealing at 60uC for 60 s. Amplicons were then mixed in approximately equal concentration (56107copies perml) to ensure equal representation
of each sample. A two-region 454 sequencing run was performed on a GS FLX Standard PicoTiterPlate (70X75) by using a GS FLX pyrosequencing system according to the manufacturer’s instructions (Roche).
Analysis of sequencing data was conducted using Pyrosequen-cing Pipeline tools at RDP 10 (http://pyro.cme.msu.edu/index. jsp). The RDP Classifier was used to assign 16S rRNA gene sequences to taxonomical hierarchy with a confidence threshold of 80%. Bacterial diversity was determined by sampling-based analysis of operational taxonomic units (OTUs) and showed by rarefaction curves. Comparison of bacterial richness across the samples was performed by Chao1 estimate at the distance of 3%, usually applied to characterize richness at species level [12,28]. As the Chao1 estimates are dependent on the size of the sequence libraries, the sample sizes from the different subject we equalized by random subtraction.
Real-Time qPCR
Bacterial groups in fecal samples from 18 subjects with type 2 diabetes and 18 controls were quantified by qPCR using the 7500 Fast Real-time PCR System (Applied Biosystems, USA) and the primers shown in Table 3 (TAG Copenhagen A/S, Denmark). Genus-specific primers for amplification ofPrevotellaandRoseburia
were designed using 16S rRNA gene sequences from the RDP 10. Sequences were aligned by the ClustalW software provided by the European Bioinformatics Institute (http://www.ebi.ac.uk/Tools/ clustalw2/index.html). The target-specific sites were assessed by ‘‘Oligo’’ Primer Analysis Software version 6.71 (Molecular Biology Insights, Inc., USA). Specificity of the primers was evaluatedin Figure 6. Correlation between OGTT and bacterial estimates by qPCR.Correlation between OGTT plasma glucose and (A) ratios of the
Bacteroides-Prevotellagroup toC.coccoides-E.rectalegroup, (B) relative abundance of theLactobacillusgroup determined by SYBR Green qPCR assay in feces from human adults with type 2 diabetes (N = 18) and non-diabetic controls (N = 18). The Spearman Rank probability (P) and correlation (R) are shown in the graphs.
silicousing the nucleotide BLAST, blastn algorithm (http://blast. ncbi.nlm.nih.gov/Blast.cgi).Prevotella-specific primers were target-ingPrevotella falsenii,P. copri,P. nigrescens,P. intermedia,P. pallens,P. maculosa and P. oris. Primers targeting Roseburiawere specific for speciesRoseburia faecis,R. hominis,R. intestnalisandR. cecicola.
The qPCR reaction mixture (20ml) was composed of 0.3mM of
each universal primer or 0.5mM of each specific primer, 1x Power
SYBR Green PCR Master Mix (Applied Biosystems, Calif., USA), and 4ml fecal DNA added in 10-fold serial dilutions starting from
100-fold dilution to diminish the effect of inhibitors. The amplification program consisted of one cycle of 95uC for 10 min, followed by 40 cycles of 95uC for 15 s, and 60uC for 1 min. Standard curves were constructed for each experiment using 10-fold serial dilutions of bacterial genomic DNA of known concentration. Genomic DNA fromL. acidophilusNCFM (ATCC 700396) and fromBifidobacterium animalis subsp. lactis (B. lactis) Bi-07 (ATCC SD5220)was extracted with the use of GenElute Bacterial Genomic DNA Kit (Sigma-Aldrich, Germany) according to the manufacture’s instructions. DNA from Roseburia intestinalis
DSM14610, Prevotella copri DSM18205, Clostridium leptum DSM 753, Clostridium coccoides DSM935, Clostridium nexile DSM1787 and Bacteroides thetaiotaomicron DSM 2079 was purchased from DSM collection (Deutsche Sammlung von Mikroorganismen und Zellkulturen GmbH, Germany). Standard curves were created according to Applied Biosystems tutorials (http://www3. appliedbiosystems.com) and normalized to the copy number of the 16S rRNA gene for each species. For the species which copy number of 16S rRNA operon was not published, it was calculated by averaging the operon numbers of the closest bacterial taxa from the ribosomal RNA database rrnDB (http://ribosome.mmg.msu. edu/rrndb/index.php; [29]). Cell numbers of bacteria in fecal samples were calculated from the threshold cycle values (Ct) and expressed as quantity of bacteria per gram feces [30].
Statistical Analysis
PCA plots were generated by Matlab 2008b using in-house algorithms (http://www.mathworks.com). Differences in bacterial populations between the diabetic and control groups were assessed using the two-sided Wilcoxon Rank Sum test (Statistics Online Computational Resource (SOCR), http://www.socr.ucla.edu/ SOCR.html). Correlation between the variables was computed by Spearman Rank correlation provided by Free Statistics Software (version 1.1.23-r4, Office for Research Development and Education, http://www.wessa.net/). The qPCR results were graphically presented by Box and Whisker charts (Microsoft Office Excel 2007) and expressed as medians with quartile ranges (QR).
Supporting Information
Figure S1 Relative abundances of bacterial genera. Relative abundances (%) of bacterial genera in feces from human adults with type 2 diabetes (green triangles, N = 10) and non-diabetic controls (blue dots, N = 10) determined by pyrosequencing of the V4 region of the 16S rRNA gene. Mean values are denoted by red crosses and numbers. Values out of scale are shown in brackets.
Found at: doi:10.1371/journal.pone.0009085.s001 (0.28 MB TIF)
Figure S2 PCA plots of bacterial families and genera. PCA plots showing the grouping of human adults with type 2 diabetes (triangles, D1-D10) and non-diabetic controls (dots, C1-C10) according to the abundances of bacterial families (A) and genera (B) in fecal bacterial DNA as determined by pyrosequencing of the V4 region of the 16s rRNA gene.
Found at: doi:10.1371/journal.pone.0009085.s002 (0.32 MB TIF)
Table 3.Primers used in the study for real-time qPCR and size of PCR products.
Target organism Primera Sequence (59to 39) PCR productbp Reference
Clostridium coccoides-Eubacteria rectalegroup ClEubF CGGTACCTGACTAAGAAGC 429 [31]
ClEubR AGTTTYATTCTTGCGAACG
Clostridium leptumsubgroup CleptF GCACAAGCAGTGGAGT 239 [32]
CleptR CTTCCTCCGTTTTGTCAA
Clostridium coccoidessubgroup CcocF AAATGACGGTACCTGACTAA 440
CcocR CTTTGAGTTTCATTCTTGCGAA
Roseburiab RosF TACTGCATTGGAAACTGTCG 230 This study
RosR CGGCACCGAAGAGCAAT
Bacteroides-Prevotellagroup BacF GAAGGTCCCCCACATTG 410 [33]
BacR CAATCGGAGTTCTTCGTG
Prevotellac PrevF CACCAAGGCGACGATCA 283 This study
PrevR GGATAACGCCYGGACCT
Lactobacillusgroup LacF AGCAGTAGGGAATCTTCCA 341 [34]
LacR CACCGCTACACATGGAG
Bifidobacterium BifF GCGTGCTTAACACATGCAAGTC 126 [35]
BifR CACCCGTTTCCAGGAGCTATT
All bacteria UnivF TCCTACGGGAGGCAGCAGT 466 [36]
UnivR GACTACCAGGGTATCTAATCCTGTT
aPrimers F (forward) and R (reverse) targeting the 16S rRNA gene. bPrimers targeting
Roseburiaspecies:R. faecis,R. hominis,R. intestnalisandR. cecicola.
Table S1 Primers, adaptor and sample-specific barcodes used in the study for tag-encoded amplicon pyrosequencing of the V4 region of the 16S rRNA gene.
Found at: doi:10.1371/journal.pone.0009085.s003 (0.03 MB DOC)
Author Contributions
Conceived and designed the experiments: NL FKV DSN ASA BKP MJ. Performed the experiments: NL ASA WAAS LH. Analyzed the data: NL FvdB WAAS. Contributed reagents/materials/analysis tools: NL FvdB ASA WAAS SS LH. Wrote the paper: NL FKV FvdB DSN ASA BKP WAAS SS LH MJ.
References
1. Cani PD, Possemiers S, Van de Wiele T, Guiot Y, Everard A, et al. (2009) Changes in gut microbiota control inflammation in obese mice through a mechanism involving GLP-2-driven improvement of gut permeability. Gut 58: 1091–1103.
2. Wellen KE, Hotamisligil GS (2005) Inflammation, stress, and diabetes. J Clin Invest 115: 1111–1119.
3. Tilg H, Moschen AR, Kaser A (2009) Obesity and the microbiota. Gastroenterology 136: 1476–1483.
4. Tsukumo DM, Carvalho BM, Carvalho MA, Saad MJA (2009) Translational research into gut microbiota: new horizons in obesity treatment. Arquivos Brasileiros de Endocrinologia e Metabologia 53: 139–144.
5. Dandona P, Aljada A, Bandyopadhyay A (2004) Inflammation: the link between insulin resistance, obesity and diabetes. Trends Immunol 25: 4–7.
6. Cani PD, Rottier O, Goiot Y, Neyrinck A, Geurts L, et al. (2008) Changes in gut microbiota control intestinal permeability-induced inflammation in obese and diabetic mice through unexpected dependent mechanisms. Diabetologia 51: S34–S35.
7. Brugman S, Klatter FA, Visser JTJ, Wildeboer-Veloo ACM, et al. (2006) Antibiotic treatment partially protects against type 1 diabetes in the bio-breeding diabetes-prone rat. Is the gut flora involved in the development of type 1 diabetes? Diabetologia 49: 2105–2108.
8. Membrez M, Blancher F, Jaquet M, Bibiloni R, Cani PD, et al. (2008) Gut microbiota modulation with norfloxacin and ampicillin enhances glucose tolerance in mice. Faseb J 22: 2416–2426.
9. Backhed F, Ding H, Wang T, Hooper LV, Koh GY, et al. (2004) The gut microbiota as an environmental factor that regulates fat storage. Proc Nat Acad Sci USA 101: 15718–15723.
10. Ley RE, Backhed F, Turnbaugh P, Lozupone CA, Knight RD, et al. (2005) Obesity alters gut microbial ecology. Proc Nat Acad Sci USA 102: 11070–11075.
11. Turnbaugh PJ, Hamady M, Yatsunenko T, Cantarel BL, Duncan A, et al. (2009) A core gut microbiome in obese and lean twins. Nature 457: 480–4U7. 12. Zhang HS, DiBaise JK, Zuccolo A, Kudrna D, Braidotti M, et al. (2009) Human gut microbiota in obesity and after gastric bypass. Proc Nat Acad Sci USA 106: 2365–2370.
13. Turnbaugh PJ, Ley RE, Mahowald MA, Magrini V, Mardis ER, et al. (2006) An obesity-associated gut microbiome with increased capacity for energy harvest. Nature 444: 1027–1131.
14. Schwiertz A, Taras D, Schafer K, Beijer S, Bos NA, et al. (2009) Microbiota and SCFA in lean and overweight healthy subjects. Obesity. Advance online publication.
15. Duncan SH, Lobley GE, Holtrop G, Ince J, Johnstone AM, et al. (2008) Human colonic microbiota associated with diet, obesity and weight loss. Int J Obes 32: 1720–1724.
16. Nadal I, Santacruz A, Marcos A, Warnberg J, Garagorri M, et al. (2009) Shifts in clostridia, bacteroides and immunoglobulin-coating fecal bacteria associated with weight loss in obese adolescents. Int J Obes 33: 758–767.
17. Santacruz A, Marcos A, Warnberg J, Marti A, Martin-Matillas M, et al. (2009) Interplay between weight loss and gut microbiota composition in overweight adolescents. Obesity 17: 1906–1915.
18. Armougom F, Henry M, Vialettes B, Raccah D, Raoult D (2009) Monitoring bacterial community of human gut microbiota reveals an increase inLactobacillus
in obese patients and methanogens in anorexic patients. Plos One 4: e7125. 19. Zeuthen LH, Christensen HR, Frokiaer H (2006) Lactic acid bacteria inducing a
weak interleukin-12 and tumor necrosis factor alpha response in human dendritic cells inhibit strongly stimulating lactic acid bacteria but act synergistically with gram-negative bacteria. Clin Vaccine Immunol 13: 365–375.
20. Dicksved J, Floistrup H, Bergstrom A, Rosenquist M, Pershagen G, et al. (2007) Molecular fingerprinting of the fecal microbiota of children raised according to different lifestyles. Appl Environ Microbiol 73: 2284–2289.
21. Cani PD, Neyrinck AM, Fava F, Knauf C, Burcelin RG, et al. (2007) Selective increases of bifidobacteria in gut microflora improve high-fat-diet-induced diabetes in mice through a mechanism associated with endotoxaemia. Diabetologia 50: 2374–2383.
22. Allcock GH, Allegra M, Flower RJ, Perretti M (2001) Neutrophil accumulation induced by bacterial lipopolysaccharide: effects of dexamethasone and annexin 1. Clin Exp Immunol 123: 62–67.
23. Nielsen DS, Moller PL, Rosenfeldt V, Paerregaard A, Michaelsen KF, et al. (2003) Case study of the distribution of mucosa-associatedBifidobacteriumspecies,
Lactobacillusspecies, and other lactic acid bacteria in the human colon. Appl Environ Microbiol 69: 7545–7548.
24. Dowd SE, Sun Y, Secor PR, Rhoads DD, Wolcott BM, et al. (2008) Survey of bacterial diversity in chronic wounds using Pyrosequencing, DGGE, and full ribosome shotgun sequencing. BMC Microbiol 8: 43. doi: 10.1186/1471-2180-8-43.
25. Andersson AF, Lindberg M, Jakobsson H, Backhed F, Nyren P, et al. (2008) Comparative analysis of human gut microbiota by barcoded pyrosequencing. Plos One 3: e2836.
26. Neefs JM, Van de PY, De RP, Chapelle S, De WR (1993) Compilation of small ribosomal subunit RNA structures. Nucleic Acids Res 21: 3025–3049. 27. Cole JR, Wang Q, Cardenas E, Fish J, Chai B, et al. (2009) The Ribosomal
Database Project: improved alignments and new tools for rRNA analysis. Nucleic Acids Res 37: D141–D145.
28. Schloss PD, Handelsman J (2004) Status of the microbial census. Microbiol Mol Biol Rev 68: 686–691.
29. Lee ZMP, Bussema C, Schmidt TM (2009) rrnDB: documenting the number of rRNA and tRNA genes in bacteria and archaea. Nucleic Acids Res 37: D489–D493.
30. Ouwehand AC, Tiihonen K, Saarinen M, Putaala H, Rautonen N (2009) Influence of a combination ofLactobacillus acidophilus NCFM and lactitol on healthy elderly: intestinal and immune parameters. Br J Nutr 101: 367–375. 31. Bartosch S, Fite A, Macfarlane GT, Mcmurdo MET (2004) Characterization of
bacterial communities in feces from healthy elderly volunteers and hospitalized elderly patients by using real-time PCR and effects of antibiotic treatment on the fecal microbiota. Appl Environ Microbiol 70: 3575–3581.
32. Matsuki T, Watanabe K, Fujimoto J, Takada T, Tanaka R (2004) Use of 16S rRNA gene-targeted group-specific primers for real-time PCR analysis of predominant bacteria in human feces. Appl Environ Microbiol 70: 7220–7228. 33. Nadkarni MA, Martin FE, Jacques NA, Hunter N (2002) Determination of bacterial load by real-time PCR using a broad-range (universal) probe and primers set. Microbiology-Sgm 148: 257–266.
34. Penders J, Vink C, Driessen C, London N, Thijs C, et al. (2005) Quantification ofBifidobacteriumspp.,Escherichia coliandClostridium difficilein faecal samples of breast-fed and formula-fed infants by real-time PCR. Fems Microbiol Lett 243: 141–147.
35. Rinttila T, Kassinen A, Malinen E, Krogius L, Palva A (2004) Development of an extensive set of 16S rDNA-targeted primers for quantification of pathogenic and indigenous bacteria in faecal samples by real-time PCR. J Appl Microbiol 97: 1166–1177.
36. Walter J, Hertel C, Tannock GW, Lis CM, Munro K, et al. (2001) Detection of