Amplifiability of mitochondrial, microsatellite
and amelogenin DNA loci from fecal samples
of red brocket deer
Mazama americana
(Cetartiodactyla, Cervidae)
M.L. Oliveira and J.M.B. Duarte
Núcleo de Pesquisa e Conservação de Cervídeos,
Universidade Estadual Paulista “Júlio de Mesquita Filho”, Jaboticabal, SP, Brasil
Corresponding author: M.L. Oliveira E-mail: [email protected]
Genet. Mol. Res. 12 (1): 44-52 (2013) Received September 12, 2012 Accepted January 6, 2013 Published January 16, 2013
DOI http://dx.doi.org/10.4238/2013.January.16.8
ABSTRACT. We tried to amplify mitochondrial, microsatellite
and amelogenin loci in DNA from fecal samples of a wild Mazama americana population. Fifty-two deer fecal samples were collected from a 600-ha seasonal semideciduous forest fragment in a subtropical
region of Brazil (21°20ꞌS, 47°17ꞌW), with the help of a detection dog;
then, stored in ethanol and georeferenced. Among these samples 16 were
classified as “fresh” and 36 as “non-fresh”. DNA was extracted using
the QIAamp® DNA Stool Mini Kit. Mitochondrial loci were amplified
in 49 of the 52 samples. Five microsatellite loci were amplified by PCR; success in amplification varied according to locus size and sample age. Successful amplifications were achieved in 10/16 of the fresh and in 13/36 of the non-fresh samples; a negative correlation (R = -0.82) was found between successful amplification and locus size. Amplification
of the amelogenin locus was successful in 22 of the 52 samples.
from feces collected in the field was evident. Some methodological
improvements, including collecting fresh samples, selecting primers for shorter loci and quantifying the extracted DNA by real-time PCR,
are suggested to increase amplification success in future studies.
Key words: Fecal DNA; Molecular ecology; Microsatellite; Cytochrome b; Detection dog
INTRODUCTION
Genetic studies have been used as an important tool in conservation and research
pro-grams of innumerous species. Facility of capture permits a large sample in many species; how
-ever, some species have elusive habits and are difficult to capture, such as deer (Duarte, 2008;
Gonzalez and Garcia, 2010). Of the eight species of deer found in Brazil, four are threatened and
three are categorized as data deficient, highlighting the important lack of information concern -ing these species (Duarte et al., 2011a-g). Urgent studies regard-ing the distribution, abundance
and diversity of these species are required. Among these, the red brocket is a species that has the greatest gaps in knowledge regarding its taxonomy and ecology (Duarte and Jorge, 2003; Duarte et al., 2008; Varela et al., 2010; Abril et al., 2010).
The alternatives to capture, which can provide satisfactory results, include noninva-sive techniques, such as camera trapping and observation of indirect evidence such as foot-prints and droppings. However, for deeper and more reliable studies, it is necessary to identify individual animals, which is not possible through photographs, footprints and simple
observa-tion of feces (Vogliotti et al., 2010). One method that can be used is genetic analysis of the DNA contained in feces (Albaugh et al., 1992; Sidransky et al., 1992; Kohn and Wayne, 1997; Gonzalez and Duarte, 2007; Gonzalez and Garcia, 2010).
Feces collection and analysis is an important source of information concerning wild animals, providing information ranging from genetics to endocrinology, which has served as
the basis for several ecological and genetic studies (Pereira et al., 2005, 2006; Gonzalez and Duarte, 2007; Gonzalez et al., 2009; Versiani et al., 2009; Christofoletti et al., 2010). For a
detailed population study using DNA contained in feces, it is necessary to accurately obtain
certain data, such as to which species the sample belongs and individual identification of the animal and its sex. To achieve this, specific markers are used to determine specific data (Gonzalez and Duarte, 2007): amplification of the cytochrome b gene, followed by RFLP is used for species identification (Gonzalez et al., 2009); microsatellite markers are used for in
-dividual identification (Kohn et al., 1999), and amplification of the amelogenin gene is used to determine sex (Ennis and Gallagher, 1994; Yamauchi et al., 2000).
Some care is required regarding sample age and the size of the locus amplified, when
using a fecal DNA-based method. Considering the age of the sample, the use of fresher
sam-ples is recommended to obtain less degraded DNA (Brinkman et al., 2010). Regarding the size of the locus amplified, observation suggests that amplification is less effective in loci greater
than 200-300 bp (Beja-Perea et al., 2009).
Among Brazilian studies, we found only one published paper that used this method,
Miotto et al. (2007). The cited study only managed to genotype 9 of 32 feline samples col
samples to study wildlife populations involved sample collections conducted in cold climate
regions (-20° to 10°C) (e.g., Frantz et al., 2003; Creel et al., 2003; Prugh et al., 2005) and/or
the animal was observed at a distance until defecation, when the samples were collected in a
fresh state, or the samples were collected from nests (e.g., Morin et al., 2001; Nsubuga et al.,
2004). Weather and sample collection conditions such as those described are not realistic for many Neotropical species, such as deer of the genus Mazama. Therefore, it is necessary to test
the efficacy of the method for each species under study (Kohn et al., 1999).
This study aimed to compare the success of the amplification of loci of different sizes and samples of different ages using molecular markers capable of specific individual identifi
-cation and sexing. Analysis of the results was based on the successful amplifi-cation of DNA
visualized on agarose gel.
MATERIAL AND METHODS
Study area and sample collection
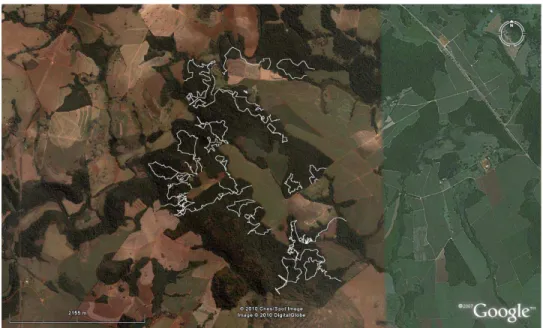
This study was conducted in a 660-ha fragment of semideciduous, primary and
sec-ondary forest located in the municipality of Cajuru, State of São Paulo, Brazil (21°25ꞌS and 47°16ꞌW). This forest is an irregular-shaped fragment, located on the banks of the Cubatão
River, which is surrounded by an agricultural matrix composed mainly of sugar cane and
pasture (Figure 1). The climate is classified as humid temperate with dry winters and hot
summers. During the collection period, from October 29 to December 22, 2008, the
mini-mum temperature was 13.2°C and the maximini-mum 33.7°C, mean daily maximini-mum and minimini-mum temperatures were 29.2° and 18.6°C, respectively, mean relative humidity was 72% and mean
precipitation was 6 mm per day, with 352 mm accumulated during the period indicated.
Feces collection was conducted intensively for 39 days, totaling 159 field hours, until a total of 52 samples were collected. Collection was achieved using a detection dog (named
Granada), walking within the fragment, to sample the widest area possible. The dog found 88% of the samples. The samples were stored in centrifuge tubes with screw caps (50 mL) containing absolute ethanol, to prevent DNA degradation. The samples were classified visu -ally into two categories: “fresh”, surrounded by mucus, soft, with no fungi and that showed
their original color (N = 16) and “non-fresh”, with no mucus, that were brittle, blackened and showed fungi (N = 36).
DNA extraction
DNA extraction was performed using the QIAamp® DNA Stool Mini kit, in accor
-dance with the manufacturer protocol.
Mitochondrial locus amplification
A 224-bp fragment of the mitochondrial cytochrome b gene was amplified by PCR
with primers capable of amplifying samples of all species of the genus Mazama, designed by
Gonzalez et al. (2009), at the following reagent concentrations: 0.16 μM of each primer, 2X
buffer, 1.25 mM dNTPs, 1.0 mM MgCl2, 0.8 ng/μL BSA, 3 U Taq DNA polymerase, 3.0 μL
DNA and ultrapure water to complete 25.0 μL. The reactions were performed for 45 cycles
and the annealing temperature was 55°C.
Following amplification, the 224-bp PCR products were stained with GelRedTM
(Bio-tium) and subjected to electrophoresis on a 2% agarose gel, then photo-documented and ana -lyzed under an ultraviolet transilluminator. Six attempts were made to amplify each sample, after which the sample was excluded from the study in case of continued failure.
Microsatellite locus amplification
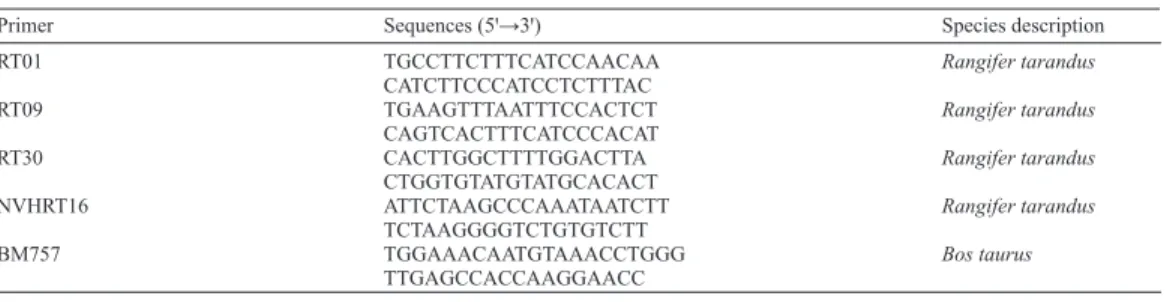
Four heterologous primers were selected for microsatellite loci from a list of 14 primers selected and standardized by Mantellatto et al. (2010) for amines of the genus Mazama and
one (BM757) standardized by Cosse et al. (2007) (Table 1).
The samples of fecal DNA were amplified by PCR using 5.0 μL extracted DNA; 8.0 pM forward primer; 8.0 pM specific reverse primer; 1X buffer; 2.0 mM MgCl2; 1.0 ng/μL BSA; 1.0 mM dNTPs, 2.0 U Taq polymerase (Platinum®, Invitrogen) and ultrapure water to
complete 15.0 μL. PCRs were performed for 47 cycles. Since the initial PCRs were not suc -cessful, the annealing temperatures (Table 2) were reduced, to a limit of 10°C below the opti-mum temperature established for the reactions using DNA from blood samples. Five attempts
were made to amplify each sample with each primer pair; after which the sample was removed
from the process of the locus under study in case of continued failure.
Amelogenin locus amplification
Sex determination was only performed for samples in which successful amplification
gene locus of the amelogenin primer developed by Ennis and Gallagher (1994). The protocol
used in the PCR was based on the study of Pajares et al. (2007). The annealing temperature was changed from 60° to 61°C to eliminate nonspecific bands. The PCRs contained 0.2 μM of each primer, 1X buffer, 1.0 mM dNTPs, 3.0 mM MgCl2, 0.6 ng/μL BSA, 1 U Taq DNA
polymerase (Platinum®, Invitrogen), 3.0 μL DNA and ultrapure water to complete 12.0 μL.
The reactions were performed for 45 cycles.
Primer Annealing temperatures (°C)
RT01 45-55
RT09 45-55
RT30 45-55
NVHRT16 47-57
BM757 48-58
Table 2. Primer annealing temperatures.
Table 1. Characteristics of the primers used for individual genotyping.
Primer Sequences (5ꞌ→3ꞌ) Species description
RT01 TGCCTTCTTTCATCCAACAA Rangifer tarandus CATCTTCCCATCCTCTTTAC
RT09 TGAAGTTTAATTTCCACTCT Rangifer tarandus CAGTCACTTTCATCCCACAT
RT30 CACTTGGCTTTTGGACTTA Rangifer tarandus CTGGTGTATGTATGCACACT
NVHRT16 ATTCTAAGCCCAAATAATCTT Rangifer tarandus TCTAAGGGGTCTGTGTCTT
BM757 TGGAAACAATGTAAACCTGGG Bos taurus TTGAGCCACCAAGGAACC
RESULTS
Mitochondrial locus amplification
Amplification was successfully achieved in 94% of samples (N = 49). The success
rate was different for fresh and non-fresh samples, with slightly better results for the fresh category (Table 3).
Category Amplification success (%) Mean number of attempts
Fresh 100 1.19 (0.75; 0.63)
Non-fresh 92 3.14 (1.99; 0.63)
Total 94 2.54 (1.92; 0.76)
Table 3. Successful amplification of the cytochrome b gene fragment (224 bp) and the mean number of PCRs
until success was achieved for different sample age categories.
Standard deviation and coefficient of variation are shown, respectively, in parentheses.
Since the number of PCRs performed until a successful reaction was recorded, it was
possible to calculate a mean of 2.54 PCRs to achieve successful amplification. This value was
Microsatellite locus amplification
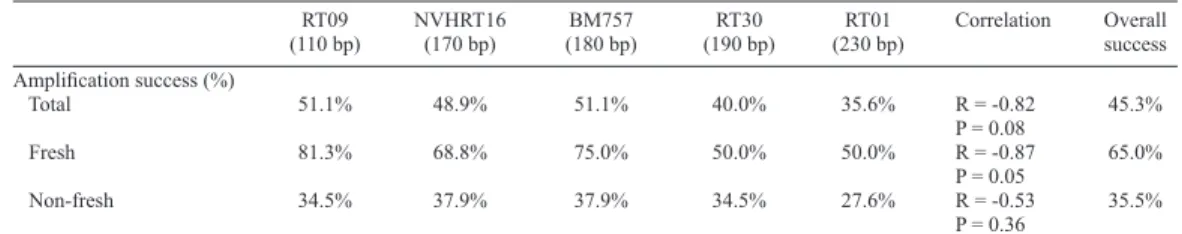
Table 4 presents the amplification results of each microsatellite locus after five at
-tempts at amplification and the correlation (Spearman’s index) between the length of the loci
and the success rate achieved in each one.
Locus Samples
Fresh Non-fresh RT09 2.08 (1.03; 0.50) 2.80 (0.79; 0.28)
NVHRT16 1.64 (0.66; 0.40) 1.55 (0.69; 0.44)
RT01 2.25 (1.04; 0.46) 2.00 (1.07; 0.53) RT30 3.00 (1.77; 0.59) 1.80 (0.92; 0.51)
BM757 2.42 (1.38; 0.57) 2.00 (1.61; 0.81)
Table 4. Successful amplification of each microsatellite locus for fresh, non-fresh and total samples and the correlation index (Spearman) of successful amplifications with the length of each locus.
RT09 NVHRT16 BM757 RT30 RT01 Correlation Overall (110 bp) (170 bp) (180 bp) (190 bp) (230 bp) success Amplification success (%)
Total 51.1% 48.9% 51.1% 40.0% 35.6% R = -0.82 45.3% P = 0.08
Fresh 81.3% 68.8% 75.0% 50.0% 50.0% R = -0.87 65.0% P = 0.05
Non-fresh 34.5% 37.9% 37.9% 34.5% 27.6% R = -0.53 35.5% P = 0.36
Based on the number of PCRs performed, the mean attempt to achieve amplification
of the samples at each locus was calculated for different sample ages (Table 5).
Table 5. Mean number of PCRs to achieve successful amplification of each locus in fresh and non-fresh samples.
Standard deviation and coefficient of variation are shown, respectively, in parentheses.
Amelogenin locus amplification
Adaptation of the amelogenin gene primers to the species studied resulted in
success-ful amplification in 43.7% of the samples. The success rate rose to 64.2% among the fresh samples and fell to 27.7% among non-fresh samples. This method was able to identify 11 male
and three female samples.
DISCUSSION
It is important to emphasize the role of the detection dog used to obtain the samples,
which located 88% of the same in the field, even when they were hidden in the litter. Collec -tion would not have been feasible without the aid of the dog.
The age of the samples, according to the previously defined categories, influenced the success of cytochrome b amplification. Even though the successful amplification of the
non-fresh samples was lower than that for non-fresh samples (Table 3), it was considered satisfactory.
of cytochrome b (Table 3), it is evident that fresh samples are more likely to be successful, a factor that economizes both time and materials.
Regarding the failure of the PCRs, it has been suggested that this occurs due to DNA degradation in nature before the samples are collected. Although the study conducted by
Palo-mares et al. (2002) also reported no significant differences in the successful amplification of
samples of different ages, the results concerning the number of attempts to achieve successful
amplification indicate the need to include the issue of age of the samples collected in the design of future studies aimed at identifying specific animals through fecal DNA. The intense discus
-sion in the literature (e.g., Wasser et al., 1997; Frantzen et al., 1998; Roeder et al., 2004; Soto-Calderon et al., 2009; Beja-Pereira et al., 2009), regarding suitable methods of fecal DNA pres
-ervation following collection in the field, shows that the natural degradation of DNA contained
in the feces over time following defecation has a high impact on the success of the PCR process.
In reference to the amplification of microsatellite loci, observation verified that fresh
samples have a higher success rate than non-fresh samples (Table 4). However, to achieve this
success, it took more attempts than for non-fresh samples, with the exception of locus RT09,
where the opposite occurred. While quantifying nuclear DNA in primates by quantitative
real-time PCR, Nsubuga et al. (2004) reported no significant differences between fresh (defecation
observed) and non-fresh samples (up to 12 h old). However, any comparison with this study is inadequate, given the impossibility of immediate collection following observed defecation. It is possible that some samples considered “fresh” in this study were more than 12 h old.
The strong negative correlation (R = -0.82) between successful amplification of the different loci with the length of the same verified the importance of using primers that amplify small regions, in this case, less than 180 bp. This correlation was even stronger (R = -0.87)
when considering the fresh samples alone. When calculating the correlation of successful
am-plification of only the non-fresh samples, a lower correlation (R = -0.53) was verified.
Different behavior between loci of different sizes was expected (Beja-Pereira et al.,
2009); however, the differences between sample age categories indicated that the results of amplification of non-fresh samples were less certain than those of fresh samples. Similar re
-sults were observed in specific identification, where both categories showed good success rates for amplification, but non-fresh samples had to be repeated more often to achieve success.
Analysis of the results also revealed that fresh stool specimens performed much better
re-garding the amplification of each microsatellite locus compared to non-fresh samples, confirming that the fresh samples are better suited for this type of study, as occurred in specific identification, com -pensating for the investment of more time searching for and collecting only these types of samples.
Regarding the sexing of the samples by amelogenin gene amplification, the low suc
-cess rate (43.7%) was also attributed to sample age, which verifies the influence of DNA deg -radation on the successful outcome of molecular genetic techniques.
Furthermore, the presence of nonspecific bands was frequently observed when the products were visualized on agarose gels. This made it difficult to determine sex, because
when female control samples were used (two bands on the gel) and the annealing temperature
in the PCR was reduced to eliminate nonspecific bands, one of the bands of the amelogenin
gene disappeared, leading to false diagnosis of the sample as male.
Finally, specific identification was satisfactory for identifying deer fecal samples found in the field. Thus, studies involving the geographical distribution of species and faunal
How-ever, the difficulties of working with the fecal DNA method in deer of the genus Mazama in
relation to individual identification and sexing are evident, such that a number of methodologi
-cal improvements are required, including: a) exclusive collection of fresh fe-cal samples; b) selection or development of primers for microsatellite loci smaller than 180 bp; c) reduction of the amplified fragment of the amelogenin gene, and d) quantification of the extracted DNA
by real-time PCR and subsequent preselection of the samples.
ACKNOWLEDGMENTS
The authors thank the staff of the Deer Research and Conservation Center (Núcleo
de Pesquisa e Conservação de Cervídeos) for their logistical support, the laboratory techni-cian João Airton Boer for his assistance in routine laboratory assays and especially Mr. Carlos Eduardo de Sampaio Freitas and Mrs. Cecília de Sampaio Moreira Oliva, the respective own-ers of the Fazenda Rio Grande and Fazenda Santa Cecília, where the study was conducted. The authors are also grateful to the São Paulo Research Foundation (FAPESP) for granting a
Master’s scholarship to Márcio Leite de Oliveira.
REFERENCES
Abril VV, Carnelossi EA, Gonzalez S and Duarte JM (2010). Elucidating the evolution of the red brocket deer Mazama americana complex (Artiodactyla; Cervidae). Cytogenet. Genome Res. 128: 177-187.
Albaugh GP, Iyengar V, Lohani A, Malayeri M, et al. (1992). Isolation of exfoliated colonic epithelial cells, a novel, non-invasive approach to the study of cellular markers. Int. J. Cancer 52: 347-350.
Beja-Pereira A, Oliveira R, Alves PC, Schwartz MK, et al. (2009). Advancing ecological understandings through technological transformations in noninvasive genetics. Mol. Ecol. Resour. 9: 1279-1301.
Brinkman TJ, Schwartz MK, Person DK, Pilgrim KL, et al. (2010). Effects of time and rainfall on PCR success using DNA
extracted from deer fecal pellets. Conserv. Genet. 11: 1547-1552.
Christofoletti MD, Pereira RJG and Duarte JMB (2010). Influence of husbandry systems on physiological stress reactions of captive brown brocket (Mazama gouazoubira) and marsh deer (Blastocerus dichotomus) - noninvasive analysis of fecal cortisol metabolites. Eur. J. Wildl. Res. 56: 561-568.
Cosse M, Gonzalez S and Maldonado JE (2007). Cross-amplification tests of ungulate primers in the endangered
Neotropical pampas deer (Ozotoceros bezoarticus). Genet. Mol. Res. 6: 1118-1122.
Creel S, Spong G, Sands JL, Rotella J, et al. (2003). Population size estimation in Yellowstone wolves with error-prone
noninvasive microsatellite genotypes. Mol. Ecol. 12: 2003-2009.
Duarte JM (2008). A technique for the capture of free-ranging marsh deer (Blastocerus dichotomus). J. Zoo. Wildl. Med.
39: 596-599.
Duarte JMB and Jorge W (2003). Morphologic and cytogenetic description of the small red brocket (Mazama bororo
Duarte, 1996) in Brazil. Mammalia 67: 403-410.
Duarte JM, Gonzalez S and Maldonado JE (2008). The surprising evolutionary history of South American deer. Mol. Phylogenet. Evol. 49: 17-22.
Duarte JMB, Piovezan U, Zanetti ES, Ramos HGC, et al. (2011a). Avaliação do estado de conservação do cervo-do-pantanal (Blastocerus dichotomus) no Brasil. Biodiv. Bras. (in press).
Duarte JMB, Vogliotti A, Zanetti ES, Oliveira ML, et al. (2011b). Avaliação do estado de conservação do veado-mateiro
(Mazama americana) no Brasil. Biodiv. Bras. (in press).
Duarte JMB, Vogliotti A, Zanetti ES, Oliveira ML, et al. (2011c). Avaliação do estado de conservação do
veado-mateiro-pequeno (Mazama bororo) no Brasil. Biodiv. Bras. (in press).
Duarte JMB, Abril VV, Vogliotti A, Zanetti ES, et al. (2011d). Avaliação do estado de conservação do veado-mão-curta
(Mazama nana) no Brasil. Biodiv. Bras. (in press).
Duarte JMB, Vogliotti A, Zanetti ES, Oliveira ML, et al. (2011e). Avaliação do estado de conservação do veado-roxo
(Mazama nemorivaga) no Brasil. Biodiv. Bras. (in press).
(Odocoileus virginianus cariacou) no Brasil. Biodiv. Bras. (in press).
Duarte JMB, Vogliotti A, Zanetti ES, Oliveira ML, et al. (2011g). Avaliação do estado de conservação do veado-campeiro
(Ozotoceros bezoarticus) no Brasil. Biodiv. Bras. (in press).
Ennis S and Gallagher TF (1994). A PCR-based sex-determination assay in cattle based on the bovine amelogenin locus.
Anim. Genet. 25: 425-427.
Frantz AC, Pope LC, Carpenter PJ, Roper TJ, et al. (2003). Reliable microsatellite genotyping of the Eurasian badger (Meles meles) using faecal DNA. Mol. Ecol. 12: 1649-1661.
Frantzen MA, Silk JB, Ferguson JW, Wayne RK, et al. (1998). Empirical evaluation of preservation methods for faecal
DNA. Mol. Ecol. 7: 1423-1428.
Gonzalez S and Duarte JMB (2007). Non invasive methods for genetic analysis applied to ecological and behavioral
studies in Latino-America. Rev. Bras. Zoot. 36: 89-92.
Gonzalez S and Garcia JE (2010). Fecal DNA. In: Neotropical Cervidology; Biology and Medicine of Latin American Deer (Duarte JMB and Gonzalez S, eds.). FUNEP/IUCN, Jaboticabal, 306-312.
Gonzalez S, Maldonado JE, Ortega J, Talarico AC, et al. (2009). Identification of the endangered small red brocket deer (Mazama bororo) using noninvasive genetic techniques (Mammalia; Cervidae). Mol. Ecol. Resour. 9: 754-758. Kohn MH and Wayne RK (1997). Facts from feces revisited. Trends Ecol. Evol. 12: 223-227.
Kohn MH, York EC, Kamradt DA, Haught G, et al. (1999). Estimating population size by genotyping faeces. Proc. Biol. Sci. 266: 657-663.
Mantellatto AM, Carnelossi EA and Duarte JM (2010). Transferability of microsatellite loci from exotic Cervidae to
Brazilian brocket deer (Mazama spp, Mammalia: Cervidae). Genet. Mol. Res. 9: 277-282.
Miotto RA, Rodrigues FP, Ciocheti G and Galetti PM (2007). Determination of the minimum population size of pumas
(Puma concolor) through fecal DNA analysis in two protected Cerrado areas in the Brazilian Southeast. Biotropica 39: 647-654.
Morin PA, Chambers KE, Boesch C and Vigilant L (2001). Quantitative polymerase chain reaction analysis of DNA from
noninvasive samples for accurate microsatellite genotyping of wild chimpanzees (Pantroglodytes verus). Mol. Ecol.
10: 1835-1844.
Nsubuga AM, Robbins MM, Roeder AD, Morin PA, et al. (2004). Factors affecting the amount of genomic DNA extracted
from ape faeces and the identification of an improved sample storage method. Mol. Ecol. 13: 2089-2094.
Pajares G, Álvarez I, Fernández I, Pérez-Pardal L, et al. (2007). A sexing protocol for wild ruminants based on PCR amplification of amelogenin genes AMELX and AMELY. Archv. Tierzucht. 50: 442-446.
Palomares F, Godoy JA, Piriz A and O’Brien SJ (2002). Faecal genetic analysis to determine the presence and distribution
of elusive carnivores: design and feasibility for the Iberian lynx. Mol. Ecol. 11: 2171-2182.
Pereira RJ, Duarte JM and Negrao JA (2005). Seasonal changes in fecal testosterone concentrations and their relationship to the reproductive behavior, antler cycle and grouping patterns in free-ranging male Pampas deer (Ozotoceros bezoarticus bezoarticus). Theriogenology 63: 2113-2125.
Pereira RJ, Polegato BF, de SS, Negrao JA, et al. (2006). Monitoring ovarian cycles and pregnancy in brown brocket deer (Mazama gouazoubira) by measurement of fecal progesterone metabolites. Theriogenology 65: 387-399.
Prugh LR, Ritland CE, Arthur SM and Krebs CJ (2005). Monitoring coyote population dynamics by genotyping faeces.
Mol. Ecol. 14: 1585-1596.
Roeder AD, Archer FI, Poinar HN and Morin PA (2004). A novel method for collection and preservation of faeces for genetic studies. Mol. Ecol. Notes 4: 761-764.
Sidransky D, Tokino T, Hamilton SR, Kinzler KW, et al. (1992). Identification of ras oncogene mutations in the stool of
patients with curable colorectal tumors. Science 256: 102-105.
Soto-Calderon ID, Ntie S, Mickala P, Maisels F, et al. (2009). Effects of storage type and time on DNA amplification
success in tropical ungulate faeces. Mol. Ecol. Resour. 9: 471-479.
Varela DM, Trovati RG, Guzmán KR, Rossi RV, et al (2010). Red Brocket Deer - Mazama americana. In: Neotropical
Cervidology; Biology and Medicine of Latin American Deer (Duarte JMB and Gonzalez S, eds.). FUNEP/IUCN, Jaboticabal, 151-159.
Versiani NF, Pereira RJG and Duarte JMB (2009). Annual variations in fecal androgen metabolites and antler cycle of captive red brocket bucks (Mazama americana) in southeast Brazil. Eur. J. Wildl. Res. 55: 535-538.
Vogliotti A, Varela DM and Andriolo A (2010). Camera traps. In: Neotropical Cervidology; Biology and Medicine of
Latin American Deer (Duarte JMB and Gonzalez S, eds.). FUNEP/IUCN, Jaboticabal, 296-305.
Wasser SK, Houston CS, Koehler GM, Cadd GG, et al. (1997). Techniques for application of faecal DNA methods to field
studies of Ursids. Mol. Ecol. 6: 1091-1097.