Inform Conservation: Chinese Cobras Currently Treated
as Homogenous Show Population Divergence
Long-Hui Lin1,2, Yan-Fu Qu1, Hong Li1, Kai-Ya Zhou1, Xiang Ji1*
1Jiangsu Key Laboratory for Biodiversity and Biotechnology, College of Life Sciences, Nanjing Normal University, Nanjing, Jiangsu, China,2Hangzhou Key Lab for Animal Adaptation and Evolution, School of Life Sciences, Hangzhou Normal University, Hangzhou, Zhejiang, China
Abstract
An understanding of population structure and genetic diversity is crucial for wildlife conservation and for determining the integrity of wildlife populations. The vulnerable Chinese cobra (Naja atra) has a distribution from the mouth of the Yangtze River down to northern Vietnam and Laos, within which several large mountain ranges and water bodies may influence population structure. We combined 12 microsatellite loci and 1117 bp of the mitochondrial cytochromebgene to explore genetic structure and demographic history in this species, using 269 individuals from various localities in Mainland China and Vietnam. High levels of genetic variation were identified for both mtDNA and microsatellites. mtDNA data revealed two main (Vietnam+southern China+southwestern China; eastern+southeastern China) and one minor (comprising only two individuals from the westernmost site) clades. Microsatellite data divided the eastern+southeastern China clade further into two genetic clusters, which include individuals from the eastern and southeastern regions, respectively. The Luoxiao and Nanling Mountains may be important barriers affecting the diversification of lineages. In the haplotype network of cytchromeb, many haplotypes were represented within a ‘‘star’’ cluster and this and other tests suggest recent expansion. However, microsatellite analyses did not yield strong evidence for a recent bottleneck for any population or genetic cluster. The three main clusters identified here should be considered as independent management units for conservation purposes. The release of Chinese cobras into the wild should cease unless their origin can be determined, and this will avoid problems arising from unnatural homogenization.
Citation:Lin L-H, Qu Y-F, Li H, Zhou K-Y, Ji X (2012) Genetic Structure and Demographic History Should Inform Conservation: Chinese Cobras Currently Treated as Homogenous Show Population Divergence. PLoS ONE 7(4): e36334. doi:10.1371/journal.pone.0036334
Editor:Nadia Singh, North Carolina State University, United States of America ReceivedJanuary 19, 2012;AcceptedApril 3, 2012;PublishedApril 27, 2012
Copyright:ß2012 Lin et al. This is an open-access article distributed under the terms of the Creative Commons Attribution License, which permits unrestricted use, distribution, and reproduction in any medium, provided the original author and source are credited.
Funding:The work was supported by grants from the Natural Science Foundation of China (3077038 and 31070339), the Zhejiang Provincial Foundation of Natural Science (Z3090461), Hangzhou Bureau of Science and Technology (20100332T20), Zhejiang Department of Science and Technology for Innovation Teams (2010R50039-26), Innovative Team Project of Nanjing Normal University (0319PM0902) and Priority Academic Program Development of Jiangsu Higher Education Institutions (CXLX11_0885). The funders had no role in study design, data collection and analysis, decision to publish, or preparation of the manuscript. Competing Interests:The authors have declared that no competing interests exist.
* E-mail: [email protected]
Introduction
The elapid genusNajacomprises 28 species of non-spitting and spitting cobras and was recently split into four subgenera. Six African and Arabian non-spitting cobras inhabiting savanna and open habitats are included in the subgenus Uraeus, four African non-spitting cobras using forest habitats in the subgenus Boulengerina, seven African spitting cobras in the subgenusAfronaja, and 11 Asian cobras in the subgenusNaja[1]. Spitting adaptations appear to have evolved three times within the genusNaja[2]. All 11 Asian species exceptN. najaandN. oxianahave some degree of adaptation to spitting [1,3]. Phylogenetic analysis of 1333 bp of mitochondrial DNA (606 for ND4 and 727 for cytochrome b) supports monophyly of the Asian cobras [2]. This result is consistent with that based on morphological data [4], but invalidates the hypothesis that spitting and non-spitting cobras in Asia are the outcome of two separate ancestral stocks migrating from Africa [5,6].
There are twoNajacobras in China, the Chinese cobra (N. atra) and the monocled cobra (N. kaouthia). The Chinese cobra is found from the mouth of the Yangtze River south to northern Vietnam
and Laos [7]. The cobra is of economic importance and has consequently been overexploited. It is listed as a highly vulnerable species according to the China Red Data Book of Endangered Animals [8] and is facing a realistic threat of local extinction in provinces such as Guangdong and Hainan [9]. Poachers are facing increasingly severe punishment, and great achievements have been made in artificial culture [10]. Unfortunately, however, wide populations ofN. atra have received little conservation attention. Until now, all local populations were treated as homogenous, so that if populations were under severe threat of extinction in a part of the cobra’s range, this would not necessarily ring alarm bells, as there are individuals left in other places or in farms. Within the cobra’s range large mountain ranges and water bodies such as the Wuyi Mountains, Luoxiao Mountains and Nanling Mountains, Taiwan Strait and Qiongzhou Strait can be found (Fig. 1). However, it remains unknown whether these geographic barriers play a role in restricting migration and thus influencing population structure and the distribution of genetic diversity within this species.
in determining the integrity and viability of wildlife populations. Moreover, these parameters can reveal more general processes acting on populations and species, such as how the population genetic structure of widespread species is formed and maintained and whether cryptic genetic groups exist within taxa [11]. The population structure and genetic diversity of a handful of snake species with large and continuous ranges has been determined for the five-paced pit-viper Deinagkistrodon acutus [12], the olive sea snake Aipysurus laevis [13], the eastern Massasauga rattlesnake Sistrurus c. catenatus[14], the short-tailed pit viperGloydius brevicaudus [15], the Chilean long-tailed snakePhilodryas chamissonis [16] and two hot-spring keel-back snakes,Thermophis baileyi and T. zhaoermii [17]. These studies generally show the existence of independent management units (MUs) for different lineages that should be taken into account for conservation plans.
Mitochondrial DNA can yield information about the historical processes behind intraspecific matrilineal relationships, and also allows insight into the importance of ongoing gene flow [18]. However, the maternally inherited haploid mitochondrial genome has a fourfold smaller effective population size than nuclear markers, which enhances the effects of genetic drift in subdivided populations and results in more rapid fixation or loss of alleles and stronger population subdivision at mitochondrial than nuclear loci [19]. While overall mutation rates tend to be higher for the mitochondrial genome [20], much of the mitochondrial genome is protein coding, potentially under selection [21] and may not always evolve sufficiently rapidly to infer levels of contemporary gene flow [22]. To reveal processes in contemporary populations influenced by both parental lineages, highly variable nuclear markers such as SNPs (single nucleotide polymorphisms) or microsatellites are required. Microsatellites are biparentally inherited and most loci appear to be selectively neutral and accumulate mutations rapidly [23].
Here, we used both mitochondrial and nuclear markers to investigate genetic processes in Chinese cobras from mainland China and Vietnam. This is the first attempt to describe genetic structure and phylogeography in this vulnerable species covering almost its entire range in mainland China and Vietnam, and is especially important because current conservation programs that
release Chinese cobras reared in captivity and confiscated officially into the wild treat the population as homogenous. Several important questions regarding the population genetic character-istics of this species were addressed in this study: (1) Has genetic diversity been retained or lost following the recent and rapid decline of Chinese cobras across their range? (2) Does the cobra show genetic and population structuring across its range? (3) Are genes flowing between and within populations and are large mountain ranges and water bodies acting as geographic barriers? Answering these questions will allow us to assess the integrity, viability and population history of this taxon, thereby informing conservation efforts towards this vulnerable snake.
Results
Genetic variation
Cytochromebgene sequences (1117 bp) from 269 individuals yielded 39 distinct haplotypes (GenBank Accession No-s EF206656, JN160643–JN160680). Eighty-No-six variable nucleotide sites were found, comprising 77 transitions, six transversions and three transition/transversion. While haplotypes C1 and C15 occupied a wide geographic distribution, 33 of 39 haplotypes were restricted to one population (Fig. 2). High haplotype diversity (0.863) and nucleotide diversity (0.827%) were detected for the whole population (Table 1). Individuals from ZW possessed the lowest haplotype diversity and nucleotide diversity, and individuals from M and QX the second lowest; individuals from GY, HN and VS had similar levels of mtDNA diversity (Table 1).
For microsatellites, 262 individuals were successfully genotyped. MICRO-CHECKER detected no evidence of null alleles or genotyping errors such as large allele dropout and stuttering. The mean number of alleles per locus (NA) was 3.33–8.50; averageHE andHO values were 0.440–0.753 and 0.347–0.631, respectively. Individuals from ZW had the lowest NA, HE and HO, and individuals from VS had the highest (Table 1). Hardy-Weinberg equilibrium tests showed that no population deviated from equilibrium. The test for linkage disequilibrium demonstrated that no linkage disequilibrium occurred for any pair of loci in any population (after Bonferroni correction).
Figure 1. Three genetic clusters of Naja atrain China and Vietnam based on the admixture model in Structure. Individuals are represented by a point which is colored to reflect the cluster to which it was assigned with the highest membership coefficient. Large points represent individuals with membership coefficientq$0.90 and small onesq,0.90. Ellipses show the three main genetic clusters. See Table 1 for sample site abbreviations.
Table 1.Samples sites, sample size (N), number of haplotypes (h), haplotype diversity (Hd), nucleotide diversity (p), Fu’sFs,
Tajima’sD, sum of square deviation (SSD), Harpending’s raggedness index (HRI),t, number of alleles (NA), allelic richness (AR),
number of private alleles (NPA), observed heterozygosity (HO) and expected heterozygosity (HE) forNaja atra.
Sample site (ID) Mitochondrial cytochromeb Microsatellite loci
N h Hd p(%) Fu’sFs Tajima’sD SSD HRI N NA AR NPA HO HE
Eastern region 32 2 0.121 0.011 20.495NS 20.783NS 0NS 0.589NS 32 3.33 3.323 0 0.347 0.440
ZW (Zhewan) 32 2 0.121 0.011 20.495NS
20.783NS 0NS 0.589NS 32 3.33 3.071 0 0.347 0.440 Southeastern region 63 14 0.789 0.670 2.022NS 20.318NS 0.068NS 0.138* 50 7.92 7.341 18 0.470 0.673
M (Min) 31 6 0.353 0.332 2.688NS 21.753* 0.050NS 0.383NS 28 5.92 5.340 2 0.441 0.623 GY (Ganyue) 32 9 0.780 0.800 4.318NS 0.574NS 0.079* 0.161*** 22 6.92 6.541 9 0.509 0.685 Western region 174 25 0.811 0.478 22.438NS 21.691* 0.043NS 0.088NS 180 9.83 7.353 37 0.514 0.707
HN (Hainan) 25 4 0.617 0.732 10.280NS 1.963NS 0.214NS 0.365NS 23 5.17 4.946 3 0.496 0.638 VS (Vietnam & Southern China) 52 17 0.850 0.547 21.324NS
21.815* 0.052* 0.132** 52 8.50 6.850 7 0.631 0.753 QX (Qianxiang) 97 9 0.508 0.113 22.005NS 20.899NS 0.347** 0.234NS 105 8.00 5.502 4 0.458 0.628 Total 269 39 0.863 0.827 22.357NS 1.012NS 0.041* 0.050*** 262 11.42 8.162 137 0.485 0.768
Significant values. *0.05§P§0.01,
**0. 01.P§0.001, ***P,0.001;
NS, not significant.ARis calculated based on a minimum of 17 individuals.NPAfor the total sample (137) is the total number of alleles across the whole data set. doi:10.1371/journal.pone.0036334.t001
Figure 2. Network of 39 mitochondrial cytochromebhaplotypes from 269 individualNaja atra.The size of the circles is proportional to haplotype frequency; small open circles represent intermediate haplotypes that are not in our study. See Table 1 for sample sites abbreviations. Sites where most individuals were assigned to the same cluster on the basis of microsatellite data have gradations of the same color (s).
divergent from the other two clades by at least 44 mutation steps (Fig. 2). Thirty-three haplotypes were unique to a single population.
Genetic distances analyses using mtDNA and microsatellite data did not produce similar results. The minimum and maximum genetic distances based on mtDNA data were from the comparisons of ZW-M (0.063) and of ZW-QX (13.836), respectively; whereas the minimum and maximum genetic
distance based on microsatellite data were from the comparisons of M-GY (0.056) and of ZW-M (0.672), respectively (Table 2). The genetic distance between the ZW and M populations was its maximum based on microsatellite data but its minimum based on mtDNA cytochromeb.
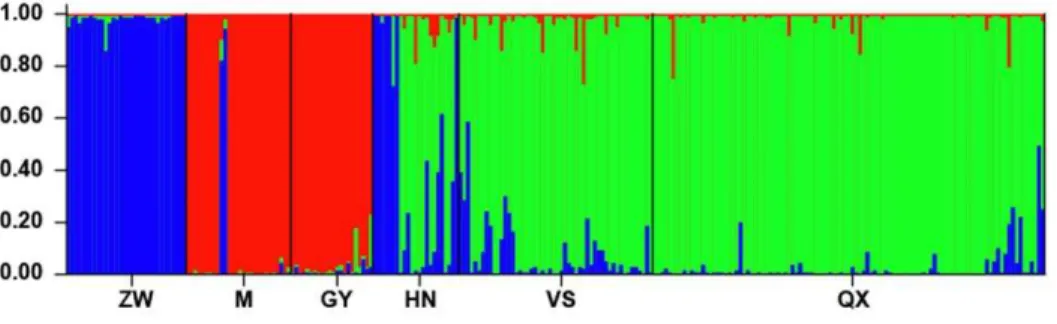
Cluster analyses with STRUCTURE based on microsatellite data identified two major clusters and a lower peak for K= 3, indicating probable substructure with three genetic groups (Fig. 4). Although the peak ofDKforK= 2 was much higher than forK= 3, the average likelihood values forK= 3 from different runs were higher than for K= 2 (28901.5 and 29585.3, respectively). Therefore, we reanalyzed both clusters individually as suggested by the authors of STRUCTURE [24]. Reanalysis of cluster 1, mostly consisting of samples from M and GY, did not detect any subdivision. Repeated analysis with samples from the larger second cluster (n= 212, omitting snakes from M and GY) suggested the existence of two genetic subgroups (Fig. 4). Samples mainly from HN, VS and QX formed one cluster, while the other cluster consisted of samples from ZW. Each sampling site was represented in one of the three clusters with a high value of estimated membership coefficient (Table 3; Fig. 1). There was relatively few (3.8%) individuals having intermediate cluster membership (i.e. an estimated membership coefficient ,0.7 in all inferred clusters), but some populations have individuals with very different cluster membership. For example, two ‘‘blue’’ individuals were in the red ‘‘M’’ sample, which could reflect very recent migrants (Fig. 1, Fig. 4). However, the varying levels of ‘‘blue’’ ancestry in more distant ‘‘green’’ samples might be a somewhat artefactual result, based on ‘‘blue’’ having just a subset of the diversity present in the ‘‘green’’ cluster. Some individuals in ‘‘green’’ locations might be assigned higher ‘‘blue’’ ancestry if they randomly happen to have some of the same alleles that drifted to high frequency in ‘‘blue’’.
Demographic history
Although Fu’sFstest shows a non-significantly negative value, a significantly negative Tajima’s D test value rejected the null hypothesis of neutral evolution and demographic equilibrium of the cytochromeb marker for the genetic cluster in the western region based on mtDNA data (Table 1). Moreover, many haplotypes were represented within a ‘‘star’’ cluster with C17 being the central haplotype in the haplotype network of cytchrome b(Fig. 2). This could indicate population expansion in the western region, which is supported by the mismatch distribution analysis and Rogers test [25] of sudden population expansion (Table 1). The value oftfor the western region was 2.36 (Table 1). Using the
95% confidence interval of 0.005–0.009 site21 myr21, the
Figure 3. Maximum-likelihood tree for all 39 haplotypes ofNaja atraand for one outgroup taxon.Labels are haplotype identifica-tion numbers. Values above branches indicate support for each node based on maximum likelihood. Bootstrap values below 70% are not shown.
doi:10.1371/journal.pone.0036334.g003
HN 0.141 0.379 0.334 0.632 1.985
VS 0.202 0.303 0.247 0.068 0.448
QX 0.337 0.448 0.407 0.140 0.091
expansion time was estimated at 0.23–0.42 mya, falling in the interval of the late pleistocene.
BOTTLENECK tests based on microsatellite data did not provide strong evidence for a recent bottleneck for any population or genetic cluster (Table 4). The heterozygosity excess test found no significant excess under either TPM or SMM (regardless of the proportion of single-step mutations). The mode-shift test showed a normal L-shape distribution of allele frequencies in each population. The heterozygosity deficiency test found significant excess under both TPM and SMM for M, GY, QX, Cluste 1 and Cluster 2.
Discussion
Genetic diversity
Our assessment of genetic variation based on mtDNA and microsatellites indicates high levels of genetic diversity inN. atra. For the whole population, mtDNA cytochrome haplotypic (h= 0.863) and nucleotide (p= 0.827%) diversities are higher than
values reported for the Jamaican boa (Epicrates subflavus), a similarly vulnerable snake with fragmented distributions, using the same marker (h= 0.79 andp= 0.76%) [26]. In a study ofA. laeviswhere
values were not calculated for all populations sampled as a whole but for each population [13], haplotypic (h= 0.55–0.63) and nucleotide (p= 0.12–0.52%) diversities were lower for most
populations of N. atra(Table 1). Nucleotide diversity detected in this study is lower than that (p= 1.41%) detected across 86
individualD. acutussampled across their range in China using the entire mitochondrial ND2 gene [12].
High microsatellite diversity was also detected inN. atra, with a NA of 11.42 and HE of 0.768 (Table 1). At the species level, microsatellite diversity inN. atrais slightly higher than, or similar to, those reported for other snakes such asE. subflavus(NA= 7.44 andHE= 0.64) [26],A. laevis(NA= 8.4 andHE= 0.263–0.881) [13] and S. c. catenatus (NA= 13.8 and HE= 0.49–0.77) [14]. These results suggest that despite a declining population, high genetic variation remains amongst wild populations of N. atra, perhaps because of a large effective population size, or because bottlenecks due to very recent ecological disturbance are unlikely to dramatically reduce genetic diversity within a handful of generations unless they lead to catastrophically low population sizes.
Genetic structure and barriers to gene flow
Our study utilized more and wider sampling locations compared to an earlier study ofN. atra [27]. Here, phylogenetic tree and network analyses using mtDNA reveal three clades comprising individuals from the western (Clade A), eastern and southeastern (Clade B), and westernmost (Clade C) regions, and show a certain degree of geographic structure for the species. This pattern is consistent with that in snakes such asD. acutusdistributed almost in the same region, whereby an east-west division of the wholeD. acutuspopulation was found [12]. With a different pattern of inheritance and rate of evolution from mtDNA, microsatellite-based analyses further divided Clade B into two genetic clusters: one included individuals from the eastern (ZW) region, and one included individuals from the southeastern (M and GY) region (Fig. 4).
Generally, the degree of genetic structure in a continuously distributed species is expected to fall somewhere between (1) a mosaic of subpopulations delimited by effective physical (e.g. mountains, rivers, roads) or ecological (e.g. prey-habitat special-ization) [28] barriers to gene flow; and (2) a single genetic group with no definite boundaries or clear subdivision where gene flow between distant parts of the population may be restricted only by limited dispersal capabilities [29]. Large mountains are a dominant feature of the landscape throughout the cobra’s range, and we hypothesized that these mountain ranges may affect gene flow. Based on the Bayesian clustering results the hypothesis was accepted with regard to the Luoxiao Mountains and partly accepted for the Nanling Montains, but rejected with regard to the Wuyi Mountains (Fig. 1). M and GY are located to the east of the Luoxiao Moutains and are separated from QX. As expected, significant differentiation occurred between M and QX and between GY and QX. M and GY are located to the north of the Nanling Mountains and are separated from VS. Significant differentiation occurred between M and VS, and between GY and VS. Although QX and VS are located on two different sides of
Figure 4. Admixture analysis of individual genotypes using Structure.Colors correspond to one of three clusters (see also Fig. 1), and each bar represents a single sample. See Table 1 for sample site abbreviations.
doi:10.1371/journal.pone.0036334.g004
Table 3.Average estimated membership coefficients to three genetic clusters for cobras from different sampling sites in China and Vietnam.
Sample site Average membership coefficient to cluster (K= 3)
1 2 3
ZW 0.003 0.013 0.983
M 0.923 0.009 0.069
GY 0.961 0.025 0.015
HN 0.031 0.532 0.437
VS 0.026 0.892 0.081
QX 0.014 0.957 0.029
Clusters with the highest membership coefficient are in bold, and clusters with a membership coefficient over 0.1 for given sampling sites are underlined. See Table 1 for sample site abbreviations.
the Nanling Mountains, they are only partly separated from each other by this mountain range. Consequently, significant differen-tiation was not found between QX and VS, possibily because of gene flow. With regard to the Wuyi Mountains, M and GY are located on two different sides of the mountain range; however, significant differentiation was not found in individuals from M and GY. More surprisingly, genetic divergences between ZW and M, and between ZW and GY are present, although no significant mountain ranges exist between these localities.
Lineage sorting between island and mainland populations has not yet been completed in the most northeastern part of the cobra’s range [27], primarily because of the young age of the Zhoushan Islands which were separated from the mainland 10,000 years ago [30]. Hainan is currently separated from the mainland by the Qiongzhou Strait, which first appeared 2.5 million years ago, with the last separation occurring some 10,000 years ago [31,32]. We found that: the haplotypes from Hainan are distributed in both Clade A and Clade B (Fig. 2, Fig. 3); haplotype C1 is shared among HN, M and ZW (Fig. 2); and haplotype C15 is shared among HN, VS and QX (Fig. 2). These findings suggest that, historically, the Qiongzhou Strait did not act as an important barrier to gene exchanges between the Hainan and mainland populations. A similar conclusion has also been drawn for the Reevese’s butterfly lizardLeiolepis reevesii[33].
FST estimates based on microsatellite data also support the Bayesian clustering results (Table 2). Slatkin’s genetic distances (FST/1–FST) between ZW and M (0.672) and between ZW and GY (0.597) are the largest when compared with values between other populations, presumably suggesting that high latitude and cool climates play a significant role in the separation of northern and southern populations of the cobra. ZW is the northern limit of the species’ range, and the cobra can be very abundant in the southern region (including islands) but absent in the northern part of the region [34]. Chinese cobras never thermoregulate when air temperatures are lower than 15uC, and a prolonged exposure of cobras to temperatures lower than 9uC can be lethal [35]. The cobra may therefore have a lower capacity to tolerate cold temperatures compared to other species. Glaciation and deglaci-ation and the accompanying falling and rising of temperature during the Pleistocene may have greatly affected the dispersion of this species. At times of maximum glaciation most cobras in ZW moved south to seek warmer habitats, resulting in increased genetic drift, inbreeding and loss of genetic diversity. As a
consequence, genetic divergence has occurred between ZW and the adjacent populations M and GY.
Population history
There were many unobserved intermediate haplotypes missing along the long branches between the two central haplotypes (C17 and C14), whereas many haplotypes were represented within a ‘‘star’’ cluster in the haplotype network (Fig. 2). Is this phenomenon the outcome of a bottleneck event causing massive population extinction before subsequent recent expansion? Our answer to this question is no because BOTTLENECK tests based on microsatellites did not support a recent bottleneck for any population or genetic cluster (Table 4). Thus, the missing intermediate haplotypes could have resulted from insufficient sampling. Snakes are sensitive to changes in temperature, especially low temperatures in winter. The lack of a bottleneck and the evidence of expansion both indicate a less significant harmful effect from Quaternary glaciations onN. atra. In fact, no distinct Quaternary glacier landform or deposits have been found within the distribution range ofN. atrathus far [36]. It seems likely that isolation, dispersal and expansion jointly explain the history of N. atra. This differs partly from conclusions drawn using the Asiatic toad Bufo gargarizans, an important prey item of N. atra. Phylogenetic analysis suggests that dispersal, instead of vicariance, dominated the history of the B. gargarizans species group [37]. Instead, the history ofN. atra is somewhat similar to that of D. acutuswhere isolation, dispersal, bottlenecks and expansion jointly constitute its history [12].
Conclusions and conservation implications
Phylogeography and population genetic studies can aid the identification of evolutionarily significant units and management units [38] and result in evidence-based conservation decision-making regarding endangered species [39]. Phylogenetic and phylogeographic analyses based on our mtDNA data support the existence of two main and a minor (comprising only two individuals) clades. Analyses based on microsatellite data further divided Clade B into two distinctive genetic clusters. Thus, besides the minor clade from the westernmost site, the three main clusters (ZW, M-GY and HN-VS-QX) should be considered as indepen-dent management units (MUs) for conservation purposes (Fig. 1). Conservation strategies such as re-introductions and translocations are required to protect or re-establish natural populations ofN. atra, but great care should be taken to ensure that individuals are
QX 0.0023/1.00 0.00085/1.00 L-shape
ZW (Cluster 3) 0.77/0.26 0.54/0.48 L-shape
M-GY (Cluster 1) 0.00037/1.00 0.00012/1.00 L-shape
HN-VS-QX (Cluster 2) 0.017/0.99 0.0017/1.00 L-shape
Under the mode-shift test, an L-shaped distribution of alleles is expected in the absence of a bottleneck whereas a distribution with a shifted mode is expected in a population that has gone through a bottleneck. See Table 1 for sample site abbreviations.
re-introduced to or translocated between appropriate populations within the same MU. Furthermore, as how much adaptive differentiation is present between these MUs or within them is unknown, we caution against long-distance transfers within a group, especially when environmental differences are apparent. In China current practices regarding the translocated release and artificial breeding of Chinese cobras in commercial farms will likely cause serious problems due to unnatural homogenization [40]. We strongly recommend that cobras should not be released into the wild unless their origin can be determined with confidence.
Materials and Methods
Sample collection
We employed local people to collect adult cobras larger than 900 mm snout-vent length between May and September of 2005– 2010 from various localities (18u489–30u179N, 103u579–122u189E) in the eastern [Zhewan (ZW), local name for Zhejiang and Anui provinces], southeastern [Min (M), local name for Fujian province; and Ganyue (GY), local name for Jiangxi and Guangdong provinces] and western [Hainan (HN); Vietnam and southern China (VS); Qianxiang (QX), local name for Guizhou and Hunan provinces] regions of the cobra’s range in mainland China and northern Vietnam (Fig. 1, Table 1). Great effort was made to avoid collecting more than one individual from the same site. The most distal 25 mm of the tail tip of each cobra was excised using a sterilized scalpel. Individual cobras were released at their site of capture after tissue sampling. Tissue samples were preserved in 95% ethanol before they were deposited at Nanjing Normal University under voucher numbers identified by locality-haplotype numbers. Our experimental procedures complied with the current laws on animal welfare and research in China, and were specifically approved by the Animal Research Ethics Committee of Nanjing Normal University (Permit No. AREC 2004-04-020). The Provincial Forestry Departments of Anhui, Fujian, Guang-dong, Guangxi, Guizhou, Hainan, Hunan, Jiangxi, Yunnan and Zhejiang provided permits for capturing cobras in China. The collection of Vietnamese specimens was conducted under the ethics license from Vietnam National Museum of Nature, which was accepted by the Animal Research Ethics Committee of Nanjing Normal University.
DNA sequencing and microsatellite genotyping
Preserved tissue samples were used to extract total genomic DNA using EasyPure Genomic DNA Extraction Kit (TransGen Biotech). DNA was resuspended in TE buffer (10 mM Tris-HCl, pH 8.0, 0.1 mM EDTA) and stored at280uC until ready for use. The cytochromebgene was amplified and sequenced according to the protocols described in Lin et al. (2008c) [27]. Twelve microsatellite loci, p8, p22, p26, p87, p88, p92, p121, p122, p124, p140, p262 and p265, were assayed following Lin et al. (2011) [41].
MtDNA data analysis
Sequences were translated to amino acids with the program SQUINT [42] to verify if a functional mitochondrial DNA sequence was obtained and that nuclear pseudogenes were not being amplified. We compiled and aligned sequences using MEGA 5.05 [43]. We used ARLEQUIN 3.5 [44] to identify haplotypes and estimate genetic diversity within populations by haplotype (h) and nucleotide diversities (p) [45]. We tested for
substitution saturation in cytochrome b (whole gene and each codon position separately). WithinN. atra, signs of saturation were
not present at any codon position; therefore, saturation was not considered to be a significant factor and all nucleotide positions were used in subsequent analyses.
We reconstructed a phylogenetic tree based on the maximum likelihood (ML), using N. kaouthia (GenBank Accession No. AF217835) as the outgroup. ML analysis was carried out by a heuristic search of 10 random addition analyses with tree-bisection-reconnection (TBR) branch swapping using PAUP 4.0 beta [46]. The GTR+I+G substitution model was selected by MODELTEST 3.7 [47] based on Akaike information criterion (AIC) [48]. The confidence level of the nodes in the ML tree was estimated using 1000 bootstrap pseudoreplicates. We also conducted a median-joining network (MJN) approach [49] to depict relationships among haplotypes. This approach has been shown to yield the best-resolved genealogies relative to other rooting and network procedures [50]. The MJN was estimated using NETWORK 4.5.0.0 [49].
We used mismatch distributions to test demographic signatures of population expansions within mtDNA lineages [51]. To compare observed distributions with those expected under the expansion model we calculated the sum of square deviation (SSD) and the Harpending’s raggedness index [52]. Tajima’sDtest [53] and Fu’s Fs test [54] were used to test equilibrium of the populations in ARLEQUIN 3.5. The statistics was expected to have large negative values under demographic expansion. The equation t= 2ut [25] was used to estimate the approximate
expansion time in generations (t), wheretis the date of the growth
or decline measured in units of mutational time and u is the mutation rate per sequence and per generation. The approximate time of expansion in years was calculated by multiplyingtby the generation time ofN. atra. The generation time for large snakes was estimated as four years based on the approximate time at which animals mature [12,55]. The substitution rate of mtDNA sequences had been calibrated in studies of lizards [56] and other vertebrates [57] as approximately 0.65% per million years. Based on geological events (the final emergence of the Isthmus of Panama), Wu¨ster et al. (2002) [58] suggest a substitution rate of 0.007 site21 myr21 (95% confidence interval: 0.005–0.009) for cytochromebwithin the Viperidae. We used the upper and lower values (0.005–0.009) to estimate the overall range of potential dates. Although this dating must be taken with extreme caution due to the lack of calibration of the substitution rate inN. atraand to the sensible overestimation of timing recent events induced by the time-dependency of molecular rates [59], it provides an approximate time frame.
Microsatellite data analysis
All microsatellite loci were screened for null alleles and large allele dropouts using MICRO-CHECKER 2.2.3 [60]. CON-VERT [61] was used to detect private alleles, which were alleles present in one population and not shared with any other. The mean number of alleles (NA) per locus and observed (HO) and expected heterozygosities (HE) were calculated using ARLEQUIN 3.5. FSTAT 2.9.3.2 [62] was used to test linkage disequilibrium and to calculate allelic richness (AR) on a minimum of 17 individuals. Deviations from Hardy-Weinberg equilibrium across all loci for each population were assessed using the exact probability test in GENEPOP 4.0 [63]. Significance values for multiple comparisons were adjusted using the Bonferroni correc-tion.
Pr(X/K)] of the posterior probability of the data for a given DK [67]. Further, theDKstatistic, the second-order rate of change in the log probability of the data between successive values ofK, was also estimated [68].
Demographic history based on microsatellites was assessed using two different and complementary methods. First, the Wilcoxon’s sign rank test was used to examine whether populations exhibit a greater level of heterozygosity than predicted in a population at mutation-drift equilibrium. This test is most sensitive to detecting bottlenecks occurring over approximately the last 2–4 Ne generations and, for most parameters, has more power to detect more recent bottlenecks (e.g. 0.2–1Ne generations ago). Second, a mode-shift test [69] was carried out to detect a distortion of the expected L-shaped distribution of allele frequency. This test is
assessed for significance at the 0.05 level.
Acknowledgments
We thank Nguyen Thien Tao from Vietnam National Museum of Nature for donating tissue samples from Vietnam. We thank Jian-Fang Gao, Hua-Song Lei, Zhen-Wei Wang, Ce Chen and Lei Hua for help during research.
Author Contributions
Conceived and designed the experiments: XJ LHL KYZ. Performed the experiments: LHL YFQ HL XJ. Analyzed the data: LHL YFQ HL KYZ XJ. Contributed reagents/materials/analysis tools: XJ. Wrote the paper: LHL KYZ XJ.
References
1. Wallach V, Wu¨ster W, Broadley DG (2009) In praise of subgenera: taxonomic status of cobras of the genusNajaLaurenti (Serpentes: Elapidae). Zootaxa 2236: 26–36.
2. Wu¨ster W, Crookes S, Ineich I, Mane´ Y, Pook CE, et al. (2007) The phylogeny of cobras inferred from mitochondrial DNA sequences: evolution of venom spitting and the phylogeography of the African spitting cobras (Serpentes: Elapidae:Naja nigricolliscomplex). Mol Phylogenet Evol 45: 437–453. 3. Wu¨ster W, Thorpe RS (1992) Asiatic cobras: population systematics of theNaja
naja species complex (Serpentes: Elapidae) in India and Central Asia. Herpetologica 48: 69–85.
4. Szyndlar Z, Rage JC (1990) West Palearctic cobras of the genusNaja(Serpentes: Elapidae): interrelationships among extinct and extant species. Amphibia-Reptilia 11: 385–400.
5. Ineich I (1995) Etat actuel de nos connaissances sur la classification des serpents venimeux. Bull Soc Herpe´tol France 1995 75–76: 7–24.
6. Minton SA (1986) Origins of poisonous snakes: evidence from plasma and venom proteins. In: Harris JB, ed. Natural toxins: animal, plant and microbial. Oxford: Clarendon Press. pp 3–21.
7. Wu¨ster W, Golay P, Warrell DA (1997) Synopsis of recent developments in venomous snake systematics. Toxicon 35: 319–340.
8. Zhao EM (1998)Naja atraCantor. In: Zhao EM, ed. China red data book of endangered animals (Amphibia and Reptilia). Beijing: Science Press. pp 274–276.
9. Lin LH, Li H, An H, Ji X (2008) Do temperature fluctuations during incubation always play an important role in shaping the phenotype of hatchling reptiles? J Therm Biol 33: 193–199.
10. Tan QY, Guo TG, Gong XG, Gong XJ, Guo DZ, et al. (2009) Artificial domestication and breeding technology ofNaja atra. J Snake 21: 183–186. 11. Tammeleht E, Remm J, Korsten M, Davison J, Tumanov I, et al. (2010) Genetic
structure in large, continuous mammal populations: the example of brown bears in northwestern Eurasia. Mol Ecol 19: 5359–5370.
12. Huang S, He SP, Peng ZG, Zhao K, Zhao EM (2007) Molecular phylogeography of endangered sharp-snouted pitviper (Deinagkistrodon acutus; Reptilia, Viperidae) in mainland China. Mol Phylogenet Evol 44: 942–952. 13. Lukoschek V, Waycott M, Keogh JS (2008) Relative information content of
polymorphic microsatellites and mitochondrial DNA for inferring dispersal and population genetic structure in the olive sea snake,Aipysurus laevis. Mol Ecol 17: 3062–3077.
14. Chiucchi JE, Gibbs HL (2010) Similarity of contemporary and historical gene flow among highly fragmented populations of an endangered rattlesnake. Mol Ecol 19: 5345–5358.
15. Ding L, Gan XN, He SP, Zhao EM (2011) A phylogeographic, demographic and historical analysis of the short-tailed pit viper (Gloydius brevicaudus): evidence for early divergence and late expansion during the Pleistocene. Mol Ecol 20: 1905–1922.
16. Sallaberry-Pincheira N, Garin CF, Gonza´lez-Acun˜a D, Sallaberry MA, Vianna JA (2011) Genetic divergence of Chilean long-tailed snake (Philodryas chamissonis) across latitudes: conservation threats for different lineages. Divers Distrib 17: 152–162.
17. Huang S, Liu SY, Guo P, Zhang YP, Zhao EM (2009) What are the closest relatives of the hot-spring snakes (Colubridae,Thermophis), the relict species endemic to the Tibetan Plateau? Mol Phylogenet Evol 51: 438–446. 18. Avise JC (2000) Phylogeography: the history and formation of species.
Cambridge: Harvard University Press.
19. Birky CW, Maruyama T, Fuerst PA (1983) An approach to population and evolutionary genetic theory for genes in mitochondria and chloroplasts, and some results. Genetics 103: 513–527.
20. Brown WM, George MJ, Wilson AC (1979) Rapid evolution of animal mitochondrial DNA. Proc Natl Acad Sci USA 76: 1967–1971.
21. Ballard JWO, Kreitman M (1995) Is mitochondrial DNA a strictly neutral marker? Trends Ecol Evol 10: 485–488.
22. Angers B, Bernatchez L (1998) Combined use of SMM and non-SMM methods to infer fine structure and evolutionary history of closely related brook charr (Salvelinus fontinalis, Salmonidae) populations from microsatellites. Mol Biol Evol 15: 143–159.
23. Balloux F, Lugon-Moulin N (2002) The estimation of population differentiation with microsatellite markers. Mol Ecol 11: 155–165.
24. Pritchard JK, Wen W (2004) Documentation for structure software: Version 2. Available from http://pritch.bsd.uchicago.edu/software/readme_structure2. pdf.
25. Rogers AR, Harpending H (1992) Population growth makes waves in the distribution of pairwise genetic differences. Mol Biol Evol 9: 552–569. 26. Tzika AC, Remy C, Gibson R, Milinkovitch MC (2009) Molecular genetic
analysis of a captive-breeding program: the vulnerable endemic Jamaican yellow boa. Conser Genet 10: 69–77.
27. Lin LH, Zhao Q, Ji X (2008) Conservation genetics of the Chinese cobra (Naja atra) using mitochondrial DNA sequences. Zool Sci 25: 888–893.
28. Musiani M, Leonard JA, Cluff HD, Gates CC, Mariani S, et al. (2007) Differentiation of tundra/taiga and boreal coniferous forest wolves: genetics, coat colour and association with migratory caribou. Mol Ecol 16: 4149–4170. 29. Epperson BK (2003) Geographical genetics: monographs in population biology,
38. Princeton: Princeton University Press.
30. Wang JT, Wang PS (1980) Relationship between sea-level changes and climatic fluctuations in east China since late Pleistocene. Acta Geogr Sin 35: 299–313. 31. Chen XD, Fan SQ (1988) Late quaternary deposition and environment in the
sea area of Northwest Hainan Island. Tropical Ocean 7: 39–47.
32. Zhao HT, Zhang QM, Song CJ (1999) Geomorphology and environment of the south China coast and the south China sea islands. Beijing: Science Press. 33. Lin LH, Ji X, Diong CH, Du Y, Lin CX (2010) Phylogeography and population
structure of the Reevese’s butterfly lizard (Leiolepis reevesii) inferred from mitochondrial DNA sequences. Mol Phylogenet Evol 56: 601–607.
34. Ji X, Wang ZW (2005) Geographic variation in reproductive traits and trade-offs between size and number of eggs of the Chinese cobra (Naja atra). Biol J Linn Soc 85: 27–40.
36. Li JJ, Shu Q, Zhou SZ, Zhao ZJ, Zhang JM (2004) Review and prospects of quaternary glaciation research in China. J Glaciol Geocryol 26: 235–243. 37. Fu JZ, Weadick CJ, Zeng XM, Wang YZ, Liu ZJ, et al. (2005) Phylogeographic
analysis of theBufo gargarizansspecies complex: a revisit. Mol Phylogenet Evol 37: 202–213.
38. Moritz C (1994) Defining ‘Evolutionarily Significant Units’ for conservation. Trends Ecol Evol 9: 373–375.
39. Szaro RC (2008) Endangered species and nature conservation: science issues and challenges. Integr Zool 3: 75–82.
40. Lin HC, Li SH, Fong J, Lin SM (2008) Ventral coloration differentiation and mitochondrial sequences of the Chinese cobra (Naja atra) in Taiwan. Conser Genet 9: 1089–1097.
41. Lin LH, Mao LX, Luo X, Qu YF, Ji X (2011) Isolation and characterization of microsatellite loci in the Chinese cobraNaja atra(Elapidae). Int J Mol Sci 12: 4435–4440.
42. Goode M, Rodrigo AG (2007) SQUINT: A multiple alignment program and editor. Bioinformatics 23: 1553–1555.
43. Tamura K, Peterson D, Peterson N, Stecher G, Nei M, et al. (2011) MEGA5: molecular evolutionary genetics analysis using maximum likelihood, evolution-ary distance, and maximum parsimony methods. Mol Biol Evol 28: 2731–2739. 44. Excoffier L, Lischer HEL (2010) Arlequin suite ver 3.5: a new series of programs to perform population genetics analyses under Linux and Windows. Mol Ecol Resour 10: 564–567.
45. Nei M (1987) Molecular evolutionary genetics. New York: Columbia University Press.
46. Swofford DL (2003) PAUP* phylogenetic analysis using parsimony (*and other methods), Version 4. Massachusetts: Sinauer Associates; 2003.
47. Posada D, Crandall K (1998) Modeltest: testing the model of DNA substitution. Bioinformatics 14: 817–818.
48. Akaike H (1974) A new look at the statistical model identification. IEEE T Automat Contr 19: 716–723.
49. Bandelt HJ, Forster P, Rohl A (1999) Median-joining networks for inferring intra-specific phylogenies. Mol Biol Evol 16: 37–48.
50. Cassens I, Van Waerebeek K, Best PB, Crespo EA, Reyes J, et al. (2003) The phylogeography of dusky dolphins (Lagenorhynchus obscurus): a critical examination of network methods and rooting procedure. Mol Ecol 12: 1781–1792. 51. Rogers AR (1995) Genetic evidence for a Pleistocene population explosion.
Evolution 49: 608–615.
52. Harpending HC (1994) Signature of ancient population growth in a low-resolution mitochondrial DNA mismatch distribution. Hum Biol 66: 591–600. 53. Tajima F (1989) Statistical method for testing the neutral mutation hypothesis by
DNA polymorphism. Genetics 123: 585–595.
54. Fu YX (1997) Statistical tests of neutrality of mutations against population growth, hitchhiking and background selection. Genetics 147: 915–925. 55. Huang S, Huang JT (2003) Artificial propagation of the five-paced pitviper
(Deinagkistrodon acutus). Acta Zool Sin 49: 854–857.
56. Macey JR, Schulte II JA, Ananjeva NB, Larson A, Rastegar-Pouyani N, et al. (1998) Phylogenetic relationships among agamid lizards of theLaudakia caucasia complex: testing hypotheses of fragmentation and an area cladogram for the Iranian Plateau. Mol Phylogenet Evol 10: 118–131.
57. Macey JR, Schulte II JA, Larson A, Fang ZL, Wang YZ, et al. (1998) Phylogenetic relationships of toads of theBufo bufocomplex from the eastern escarpment of the Tibetan Plateau: a case of vicariance and dispersal. Mol Phylogenet Evol 9: 80–87.
58. Wu¨ster W, Saloma˜o MDG, Quijada-Mascaren˜as JA, Thorpe RS, BBBSP (2002) Origins and evolution of the South American pitviper fauna: evidence from mitochondrial DNA sequence analysis. In: Schuett GW, Ho¨ggren MH, Douglas ME, Greene HW, eds. Biology of vipers. Utah: Eagle Mountain Publishing. pp 111–128.
59. Ho SYW, Larson G (2006) Molecular clocks: when times are a-changin’. Trends Genet 22: 79–83.
60. Van Oosterhout C, Hutchinson WF, Wills DPM, Shipley P (2004) MICRO-CHECKER: software for identifying and correcting genotyping errors in microsatellite data. Mol Ecol Notes 4: 535–538.
61. Glaubitz JC (2004) CONVERT: a user friendly program to reformat diploid genotypic data for commonly used population genetic software packages. Mol Ecol Notes 4: 309–310.
62. Goudet J (2001) FSTAT, a program to estimate and test gene diversities and fixation indices (version 2.9.3). Updated from Goudet (1995), available from http://www.unil.ch/izea/softwares/fstat.html.
63. Rousset F (2008) GENEPOP’007: a complete re-implementation of the GENEPOP software for Windows and Linux. Mol Ecol Resour 8: 103–106. 64. Slatkin M (1995) A measure of population subdivision based on microsatellite
allele frequencies. Genetics 139: 457–462.
65. Slatkin M (1993) Isolation by distance in equilibrium and non-equilibrium populations. Evolution 47: 264–279.
66. Falush D, Stephens M, Pritchard JK (2003) Inference of population structure using multilocus genotype data: linked loci and correlated allele frequencies. Genetics 164: 1567–1587.
67. Pritchard JK, Stephens M, Donnelly P (2000) Inference of population structure using multilocus genotype data. Genetics 155: 945–959.
68. Evanno G, Regnaut S, Goudet J (2005) Detecting the number of clusters of individuals using the software STRUCTURE: a simulation study. Mol Ecol 14: 2611–2620.
69. Luikart G, Allendorf FW, Cornuet JM, Sherwin WB (1998) Distortion of allele frequency distributions provides a test for recent population bottlenecks. J Hered 89: 238–247.
70. Cornuet JM, Luikart G (1996) Description and power analysis of two tests for detecting recent population bottlenecks from allele frequency data. Genetics 144: 2001–2014.