Perceptual Evidence Prior to Visual Scene Recognition
Antonio Schettino1, Tom Loeys2, Manuela Bossi3, Gilles Pourtois1*
1Department of Experimental-Clinical and Health Psychology, Ghent University, Ghent, Belgium,2Department of Data Analysis, Ghent University, Ghent, Belgium,
3Department of Psychology, University of Pavia, Pavia, Italy
Abstract
Visual scene recognition is a dynamic process through which incoming sensory information is iteratively compared with predictions regarding the most likely identity of the input stimulus. In this study, we used a novel progressive unfolding task to characterize the accumulation of perceptual evidence prior to scene recognition, and its potential modulation by the emotional valence of these scenes. Our results show that emotional (pleasant and unpleasant) scenes led to slower accumulation of evidence compared to neutral scenes. In addition, when controlling for the potential contribution of non-emotional factors (i.e., familiarity and complexity of the pictures), our results confirm a reliable shift in the accumulation of evidence for pleasant relative to neutral and unpleasant scenes, suggesting a valence-specific effect. These findings indicate that proactive iterations between sensory processing and top-down predictions during scene recognition are reliably influenced by the rapidly extracted (positive) emotional valence of the visual stimuli. We interpret these findings in accordance with the notion of a genuine positivity offset during emotional scene recognition.
Citation:Schettino A, Loeys T, Bossi M, Pourtois G (2012) Valence-Specific Modulation in the Accumulation of Perceptual Evidence Prior to Visual Scene Recognition. PLoS ONE 7(5): e38064. doi:10.1371/journal.pone.0038064
Editor:Wael El-Deredy, University of Manchester, United Kingdom
ReceivedFebruary 3, 2012;AcceptedApril 30, 2012;PublishedMay 31, 2012
Copyright:ß2012 Schettino et al. This is an open-access article distributed under the terms of the Creative Commons Attribution License, which permits unrestricted use, distribution, and reproduction in any medium, provided the original author and source are credited.
Funding:This work is supported by grants from the European Research Council (starting grant#200758) and Ghent University (BOF grant#05Z01708). The funders had no role in study design, data collection and analysis, decision to publish, or preparation of the manuscript.
Competing Interests:Gilles Pourtois is an Academic Editor for PLoS ONE. This does not alter the authors’ adherence to all the PLoS ONE policies on sharing data and materials.
* E-mail: [email protected]
Introduction
Visual object recognition has classically been conceived as resulting from a set of serial computations performed by dedicated ventral object-selective brain regions located in the infero-temporal cortex, eventually enabling to progressively extract the precise meaning of the retinal input [1,2]. Whereas bottom-up processes are typically emphasized in these hierarchical models, the visual computations performed by these object-selective areas are nonetheless susceptible to top-down modulatory effects, including selective attention [3–6], prior expectations [7,8], contextual information [9,10], or decision-making [11,12]. Therefore, visual object recognition processes are not limited to the analysis of sensory information, but they are further shaped by higher order (i.e., not strictly perceptual) processes.
Interestingly, an alternative view has been put forward to account for these complex interaction effects between bottom-up sensory processing and top-down modulatory influences during recognition. Namely, predictive coding models [13–21] advocate that visual object recognition processes taking place within the infero-temporal cortex result from the dynamic interplay between (top-down) predictions and (bottom-up) errors [22]. Predictions reflect prior knowledge related to probable events in the sensory environment, and they are employed to reduce the computational burden of visual perception by guiding attention towards salient aspects of the environment, as well as facilitating the interpretation of ambiguous visual input [7]. Whenever a discrepancy is detected between these top-down predictions and bottom-up sensory processing, an error signal (prediction error) is generated and
propagated back to higher-level brain regions, with the aim to update or refine the content of the predictions, and in turn accommodate online sensory processing with the current specific-ities carried by the visual input [14,19,21,23]. In this framework, the expected and actual sensory input are dynamically compared at each stage of processing by means of recursive loops, until the system is able to generate the most likely interpretation of the target object [7,24].
Of note, asymmetries in speed of processing and visual pathways between low spatial frequency (LSF) and high spatial frequency (HSF) information could potentially provide a mecha-nistic account to explain predictive coding effects during early stages of recognition of single objects and complex visual scenes [25]. Several studies have already established the differential contribution of LSF vs. HSF input in face recognition [26–28], as well as in the processing of complex visual scenes [29–32]. More precisely, LSF information seems more useful in identifying the gist of the scene in conditions of fast stimulus presentation (i.e., 30 ms), whereas for longer durations (150 ms) observers rely more on HSF information [30]. Interestingly, because LSF information travels rapidly from early sensory visual areas to prefrontal and anterior temporal regions (via magnocellular projections), this early coarse analysis of the visual input might actually serve to generate predictions about its content [10,33–36].
neutral stimuli or not. In fact, given the accumulating empirical evidence showing that emotion does not simply add a specific flavor to perception but can have profound influences in stimulus processing, both at the behavioral and neural levels [37–42], one can argue that predictive coding during visual scene recognition may reliably be influenced by emotional factors. However, this question has received little empirical support, and it is therefore still unclear whether mechanisms of predictive coding may change during visual scene recognition or not, depending on the extracted emotional content or value of the incoming stimulus. To address this issue, we recently developed and validated a new experimental paradigm. It enables us to study effects of emotion (i.e., valence and/or arousal) on the speed of proactive guesses during scene recognition, both at the behavioral and electrophysiological (event-related brain potentials, ERPs) levels [43]. For each individual trial, participants were presented with series of filtered images that were gradually unfolding the content of a complex visual scene while they had to perform an (orthogonal) animacy judgment task. Each trial began with the presentation of a blurred image, whose content was progressively revealed by increasing, in up to six sequential, parametric and predictive steps, the amount of diagnostic LSF and HSF information. Therefore, this procedure mimicked a ‘‘coarse-to-fine’’ accumulation of perceptual evidence [30,33,44–46]. Importantly, the visual scenes used in this study (extracted from a standard database) could be neutral, pleasant or unpleasant, based on independent arousal and valence ratings obtained for these visual stimuli. Behavioral results confirmed that this task was suited to study predictive coding effects during scene recognition because participants did not respond randomly, but they accumulated sufficient perceptual evidence before deciding, with high accuracy, whether the content of the scene was living or not [11,47–49]. Importantly, this effect was not identical for the three emotion categories. Participants probably accumulated perceptual evidence less rapidly (reflected in prolonged recogni-tion) for emotional compared to neutral scenes, this effect being most obvious for pictures having a pleasant content. These results could be interpreted as reflecting a negativity bias during scene recognition [50,51]. Negativity bias refers to the fact that aversive stimuli usually elicit stronger responses compared to appetitive ones, leading in turn to a faster recognition for unpleasant relative to pleasant pictures. However, the prolonged exploration for pleasant scenes was also consistent with the concurrent activation of positivity offset during scene recognition [52,53]. In this view, when input to the affect system is minimal, positivity may outweigh negativity. Due to their intrinsic hedonistic value, pleasant scenes could therefore be associated with prolonged exploration. Hence, behavioral results of this study [43] were equivocal with regard to the underlying emotional or motivational drive accounting for these findings.
Whereas these results shed light on mechanisms underlying the generation of proactive guesses during scene recognition and how emotion may influence these complex processes, a main question also arose regarding the specificity of these effects. For instance, considering the fact that we used an orthogonal task (i.e., animacy judgment), it is conceivable that the emotional content of the scene had little or no direct impact on the expression of processes involved in accumulation of perceptual evidence [54–57]. Moreover, it was unclear from these results alone whether emotion as such, or other non-controlled factors, may actually have produced the change in the rate of accumulation of evidence between emotional and neutral scenes. Presumably, the selected visual scenes did not differ only regarding the actual emotional content, but also their intrinsic picture complexity and/or familiarity, even though we took special care to minimize obvious
perceptual and structural differences across the three emotion categories [43]. However, if the neutral vs. emotional scenes selected in our study were not properly balanced along these two specific non-emotional dimensions (i.e., picture complexity and familiarity), we cannot exclude the possibility that the reported behavioral effects may be imputed to these factors, rather than the differential processing of the emotional content during scene recognition. Presumably, more complex or less familiar visual scenes might be associated with delayed accumulation of evidence in our task. Hence the question remains whether the prolonged accumulation of evidence found in our study for emotional relative to neutral scenes may (at least partly) be explained by changes in picture complexity and/or familiarity across the three emotion categories, rather than the emotional content per se [43]. Therefore, the goal of the present study was to assess whether trial-by-trial variations along these two dimensions may overshad-ow or confound genuine effects of emotion during the accumu-lation of perceptual evidence prior to scene recognition or not.
than emotion (i.e., valence and/or arousal), may account for changes in accumulation of evidence prior to recognition. Given the evidence reviewed here above, we predicted more familiar scenes to be recognized earlier than less familiar scenes in our experiment.
To address these questions, we designed a new experiment based on the previously validated progressive unfolding task [43] and collected data in a sample of healthy adult participants. Noteworthy, in addition to the main memory matching task (old-new judgment; see below), we instructed participants to directly attend to the emotional content of the stimuli by occasionally asking them to rate the emotional valence of the scenes. These instructions are at variance with the animacy judgment task used in our previous study [43]. We reasoned that this manipulation should augment the relevance of emotional features during the task [54], and hence the likelihood to observe reliable differences between the three emotion categories (neutral, pleasant and unpleasant) during accumulation of evidence prior to scene recognition. Furthermore, each and every scene used during the main experiment was subsequently rated in terms of familiarity and picture complexity by two independent samples of partici-pants, using standard 9-point Likert scales. Afterwards, we used these independent ratings in a single-trial analysis to assess whether systematic changes in accumulation of evidence prior to recognition (as measured in the main progressive unfolding experiment) might be confounded by variations along picture complexity and/or familiarity. More specifically, we assessed whether the prolonged exploration for emotional compared to neutral scenes (see results) might be due to systematic changes in picture complexity and/or familiarity across these categories.
Methods
Ethics statement
The study was approved by the ethics committee of the Faculty of Psychological and Educational Sciences, Ghent University. All participants were required to give written informed consent prior to their participation.
Participants
Eighteen psychology students (all women, mean age 21 years, range 18–26) participated in the main experiment (progressive unfolding task) in exchange of 30J. In addition, 20 volunteers (15 women, mean age 23 years, range 18–34) participated in the picture complexity rating experiment, whereas another sample of 21 participants (17 women, mean age 23 years, range 19–37) completed the familiarity rating experiment. Each participant of the two rating experiments received 8J. All individuals were native Dutch speaking, right-handed, had normal or corrected-to-normal vision, with no history of neurological or psychiatric disorders.
Stimuli
The visual stimuli were selected from the International Affective Picture System (IAPS) [75], a standard database containing neutral and emotionally-evocative pictures depicting objects and scenes across various ecological situations. This database provides normative ratings for the basic dimensions of emotion – including arousal and valence – using the Self-Assessment Manikin (SAM) [76]. The stimulus list consisted of 360 pictures, equally divided into three emotion categories according to their standardized valence scores: neutral, unpleasant and pleasant (Table 1). Notably, these pictures were selected on the basis of mean valence and arousal ratings reported by female responders [75], because
only women eventually participated in the main experiment (see above). Since the main purpose was to assess valence-specific effects during scene recognition, the selected pleasant and unpleasant scenes were properly balanced with regard to levels of arousal (see Table 1). Similarly to our previous study [43], highly pleasant (i.e., erotic situations) or highly unpleasant (i.e., mutilations) scenes were not included in the stimulus set, given the specific emotion responses often associated with these two categories [65,77]. Moreover, we included 16 additional neutral pictures that were only used during the practice session (therefore not considered in the subsequent statistical analyses). Finally, 36 supplementary neutral scenes were scrambled (i.e., each picture was divided into grids of 2556255 pixels, which were randomly shuffled 10 times), thereby disrupting the content of the scene. Thus, a total of 412 IAPS pictures (including practice and scrambled trials) were shown to participants of the main experiment, while participants of the two rating experiments were presented with the 360 main pictures (excluding practice and scrambled scenes).
Number codes of pictures selected from the database [75] are provided, for each category separately. Practice: 2107, 2600, 2980, 5533, 5731, 6837, 7017, 7030, 7036, 7055, 7057, 7140, 7224, 7365, 8121, 8312. Neutral: 1350, 1616, 1675, 1903, 1935, 1947, 2025, 2026, 2034, 2191, 2272, 2273, 2279, 2308, 2357, 2377, 2382, 2383, 2390, 2396, 2445, 2446, 2489, 2495, 2514, 2575, 2579, 2593, 2595, 2597, 2606, 2702, 2720, 2749, 2850, 2880, 4090, 4150, 4220, 4250, 4255, 4274, 4275, 4320, 4325, 4605, 4750, 5040, 5395, 5500, 5531, 5532, 5534, 5535, 5900, 6570.2, 7001, 7002, 7003, 7009, 7011, 7014, 7016, 7018, 7019, 7021, 7032, 7033, 7037, 7038, 7042, 7043, 7044, 7045, 7058, 7061, 7062, 7081, 7096, 7130, 7160, 7161, 7170, 7180, 7184, 7186, 7188, 7190, 7207, 7236, 7242, 7247, 7248, 7249, 7255, 7287, 7300, 7354, 7484, 7487, 7493, 7500, 7503, 7506, 7512, 7513, 7546, 7547, 7550, 7590, 7595, 7710, 7820, 7830, 8241, 8311, 8325, 9210, 9260, 9700. Unpleasant: 1230, 1240, 1270, 1275, 1280, 1390, 1505, 1617, 1945, 2115, 2130, 2141, 2205, 2276, 2278, 2400, 2455, 2456, 2525, 2681, 2682, 2694, 2695, 2700, 2715, 2716, 2718, 2745.2, 2750, 2752, 2770, 2795, 2799, 2810, 2900.1, 3061, 3160, 3181, 3190, 3210, 3216, 3280, 3300, 3301, 4621, 4635, 4770, 5970, 5973, 6000, 6240, 6241, 6311, 6314, 6561, 6562, 6610, 6800, 6832, 7013, 7023, 7079, 7092, 7136, 7137, 7520, 7521, 8231, 9002, 9005, 9008, 9031, 9041, 9045, 9046, 9080, 9090, 9102, 9145, 9171, 9180, 9182, 9186, 9265, 9270, 9290, 9291, 9295, 9320, 9330, 9331, 9341, 9342, 9390,
Table 1.Mean values and standard deviations (in
parenthesis) of normative valence and arousal scores for the selected IAPS pictures.
Emotion category Valence Arousal
Neutral 5.14 (1.38) 3.68 (2.05)
Unpleasant 3.17 (1.61) 4.94 (2.15)
Pleasant 6.95 (1.70) 4.97 (2.30)
9395, 9402, 9404, 9411, 9415, 9417, 9419, 9421, 9435, 9440, 9445, 9469, 9471, 9561, 9584, 9592, 9596, 9635.2, 9830, 9831, 9832, 9912, 9913, 9922, 9926, 9927. Pleasant: 1340, 1463, 1540, 1590, 1595, 1640, 1659, 1660, 1720, 1721, 1811, 1999, 2055.2, 2056, 2092, 2151, 2156, 2158, 2224, 2274, 2300, 2331, 2344, 2346, 2352, 2398, 2605, 2616, 2655, 3005.2, 4500, 4530, 4534, 4536, 4559, 4571, 4600, 4601, 4603, 4606, 4610, 4612, 4614, 4616, 4617, 4619, 4623, 4624, 4641, 5199, 5215, 5260, 5301, 5480, 5600, 5622, 5628, 5660, 5700, 5814, 5829, 5831, 5849, 5990, 5994, 6250.2, 7200, 7230, 7250, 7260, 7279, 7281, 7282, 7286, 7289, 7291, 7350, 7352, 7390, 7400, 7410, 7430, 7440, 7460, 7461, 7470, 7477, 7481, 7482, 7488, 7489, 7492, 7496, 7501, 7505, 7508, 7515, 7570, 8032, 8050, 8118, 8120, 8162, 8208, 8220, 8280, 8340, 8350, 8371, 8420, 8460, 8461, 8465, 8467, 8497, 8503, 8510, 8531, 8540, 8620; Scrambled: 1112, 1303, 1310, 1645, 1726, 1908, 2002, 2018, 2032, 2038, 2101, 2102, 2104, 2122, 2190, 2220, 2221, 2393, 2440, 2441, 2458, 2480, 2484, 2493, 2506, 2512, 2516, 2518, 2570, 2580, 2635, 2704, 2780, 2830, 2840, 9070.
Each neutral, unpleasant and pleasant scene was arbitrarily paired with another one from the same emotion category based on low-level visual similarities, assessed by systematic visual inspec-tion. More specifically, for each emotion category separately, pictures with a clear distinction between a central figure and a homogeneous background were paired together (e.g., a coffee mug on a table vs. a pocket watch on a dark background), and the same strategy was applied for more complex scenes (e.g., a traffic jam vs. a woman in the crowd). These pairs were used during the main task to minimize the use of purely perceptual, pixel-to-pixel matching strategies (see here below). All the pairs created with this procedure are reported in Table 2.
The selected IAPS scenes were resized to 9226691 pixels (90% of the original size) and pre-processed similarly to our previous study [43]: after grayscale conversion, six bandpass spatial frequency filters were applied on every picture (using ImageJ v1.44 software; http://rsb.info.nih.gov/ij/) [78]. As a result, six distinct levels of filtering were obtained for every IAPS scene, each containing a different amount of low and high spatial frequency information [43]. All these modified pictures were finally resized to 7686576 pixels (75% of the original IAPS pictures).
Procedure
Participants were individually tested in a small, dimly lit room, and seated at a viewing distance of 75 cm in front of a 190CRT computer screen (refresh rate: 100 Hz). After filling out the informed consent, they were presented with task instructions, followed by a practice block containing 16 neutral pictures. Then, they moved on to the experimental session, divided into twelve blocks, each containing 33 trials. Each trial had the following structure. A colorful, fully detailed picture (9226691 pixels, subtending 18.5u613.9u of visual angle) was first presented on the screen for 1500 ms, followed by a grayscale mask displayed for 2000 ms. Then, the actual unfolding sequence [43] began. A fixation cross appeared in the center of the screen for 250 ms. The first grayscale, blurred image level of a given picture (7686576 pixels, 15.4u611.6u) was then presented for 500 ms, followed by a 250 ms blank screen. Next, the second image level of the same picture (identical pixel size, but containing slightly more HSF and LSF information) was displayed for 500 ms, plus the 250 ms blank screen, and the same procedure was repeated until the presenta-tion of the sixth, non-filtered image level. The inter-trial interval was constant and set at 1000 ms (Figure 1A). This experimental manipulation was used to promote a gradual and predictive accumulation of perceptual evidence by progressively adding, in a
stepwise fashion, high and low spatial frequency information to the first undistinguishable picture [43]. Importantly, the grayscale and resize conversions relative to the original colorful scene (presented at the beginning of each trial) were applied to discourage participants to use a pixel-to-pixel matching strategy to perform the task. Two separate and consecutive responses were required. First, participants were asked to press a button on a response box (Cedrus RB-730; http://www.cedrus.com/responsepads/rb730. htm) with their right index finger as soon as they felt they gathered enough perceptual evidence to decide, with sufficient confidence, whether the content of the unfolded scene was either the same as the one displayed at the beginning of the trial, a new one, or a new scrambled picture (Response1). These scrambled pictures, for which a separate response was required (see below), were used as ‘‘catch’’ trials to ensure that participants reliably attended to the content of the scenes. Pressing the button immediately interrupted the presentation of the stimulus sequence. After 500 ms, participants were required to perform a three-alternative forced choice delayed matching task, in order to validate their first response (Response1). Specifically, they had to press, on a standard AZERTY keyboard, the ‘‘O’’ key if the unfolded scene was the same as the colorful one previously presented (‘‘old’’ condition), the ‘‘N’’ key if these two scenes were different (‘‘new’’ condition), or the ‘‘S’’ key if the unfolded scene was displaying a meaningless content (‘‘scrambled’’ condition). All these responses, for which no time constraint was established, were coded as Response2. The main purpose of this dual response procedure was to dissociate early visual detection (Response1) from the overt discrimination of the scene requiring a specific stimulus-response mapping (Response2) [43]. Participants were asked to focus on accuracy, but at the same time they were encouraged not to wait until the end of the unfolding sequence to decide about the content of the visual scene (Response1). Responses1 occurring after the presentation of the last/sixth image level were therefore classified as late responses and analyzed separately.
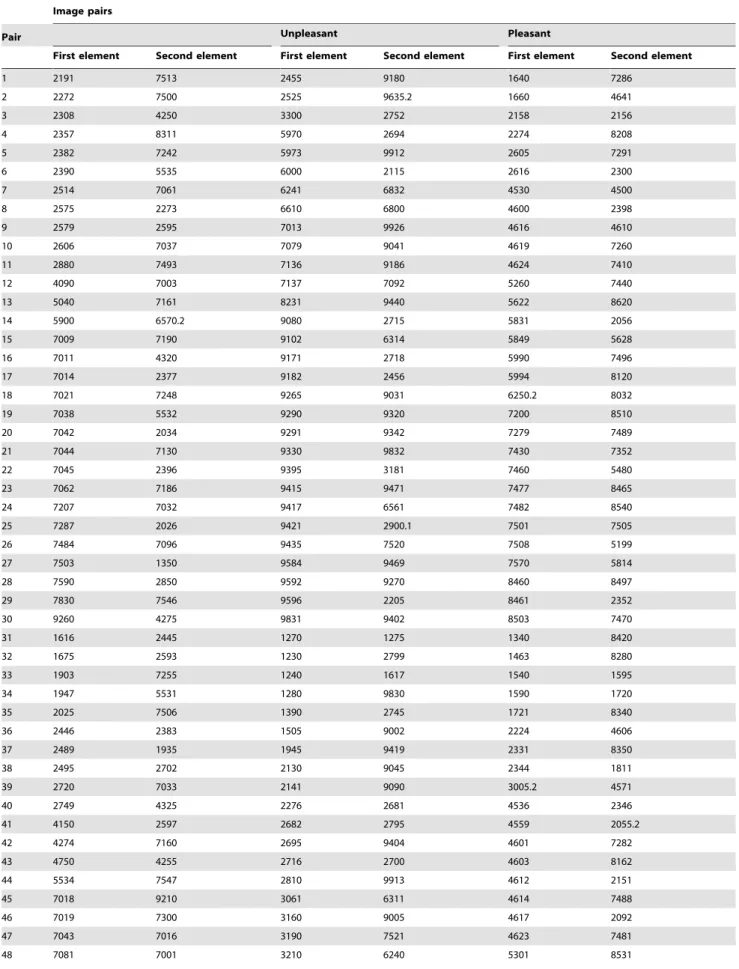
Table 2.Stimulus pairs created for the progressive unfolding task.
Image pairs
Pair Unpleasant Pleasant
First element Second element First element Second element First element Second element
1 2191 7513 2455 9180 1640 7286
2 2272 7500 2525 9635.2 1660 4641
3 2308 4250 3300 2752 2158 2156
4 2357 8311 5970 2694 2274 8208
5 2382 7242 5973 9912 2605 7291
6 2390 5535 6000 2115 2616 2300
7 2514 7061 6241 6832 4530 4500
8 2575 2273 6610 6800 4600 2398
9 2579 2595 7013 9926 4616 4610
10 2606 7037 7079 9041 4619 7260
11 2880 7493 7136 9186 4624 7410
12 4090 7003 7137 7092 5260 7440
13 5040 7161 8231 9440 5622 8620
14 5900 6570.2 9080 2715 5831 2056
15 7009 7190 9102 6314 5849 5628
16 7011 4320 9171 2718 5990 7496
17 7014 2377 9182 2456 5994 8120
18 7021 7248 9265 9031 6250.2 8032
19 7038 5532 9290 9320 7200 8510
20 7042 2034 9291 9342 7279 7489
21 7044 7130 9330 9832 7430 7352
22 7045 2396 9395 3181 7460 5480
23 7062 7186 9415 9471 7477 8465
24 7207 7032 9417 6561 7482 8540
25 7287 2026 9421 2900.1 7501 7505
26 7484 7096 9435 7520 7508 5199
27 7503 1350 9584 9469 7570 5814
28 7590 2850 9592 9270 8460 8497
29 7830 7546 9596 2205 8461 2352
30 9260 4275 9831 9402 8503 7470
31 1616 2445 1270 1275 1340 8420
32 1675 2593 1230 2799 1463 8280
33 1903 7255 1240 1617 1540 1595
34 1947 5531 1280 9830 1590 1720
35 2025 7506 1390 2745 1721 8340
36 2446 2383 1505 9002 2224 4606
37 2489 1935 1945 9419 2331 8350
38 2495 2702 2130 9045 2344 1811
39 2720 7033 2141 9090 3005.2 4571
40 2749 4325 2276 2681 4536 2346
41 4150 2597 2682 2795 4559 2055.2
42 4274 7160 2695 9404 4601 7282
43 4750 4255 2716 2700 4603 8162
44 5534 7547 2810 9913 4612 2151
45 7018 9210 3061 6311 4614 7488
46 7019 7300 3160 9005 4617 2092
47 7043 7016 3190 7521 4623 7481
always followed by the unfolding of a neutral scene, and the same occurred for emotion-laden stimuli (pleasant-pleasant; unpleasant-unpleasant; see also Table 2). The order of ‘‘old’’, ‘‘new’’ and ‘‘scrambled’’ trials was randomized.
Finally, in order to verify whether the emotional content of the selected IAPS pictures was actually perceived as such and in line with the normative ratings [75], as well as to keep the emotional content task-relevant throughout the experiment, participants were occasion-ally asked, after the registration of Response2, to also rate the emotional valence of the colorful scene presented at the beginning of each trial by means of a standard 9-point SAM [76], with anchor 1 corresponding to ‘‘very unpleasant’’ and anchor 9 to ‘‘very pleasant’’. This additional emotion classification task concerned 10% of the total number of trials. Such manipulation was also employed to increase the likelihood to detect reliable differences between emotional and neutral scenes during accumulation of evidence prior to scene recognition because, with these specific task demands, participants had to attend to the emotional content of the scene [54,55].
Stimulus presentation and behavioral response recordings were controlled using E-Prime 2.0. (http://www.pstnet.com/products/ e-prime/).
Rating experiments
Participants were tested in pairs in a dimly lit room, seated at a viewing distance of 75 cm in front of individual 190CRT screens. In each pair, one member was assigned to rate familiarity while the other was asked to focus on picture complexity of the pre-selected IAPS scenes. After completing the informed consent, they were presented with task instructions, including examples. Then, they moved on to the experimental session, divided into six blocks of 60 trials, separated by short breaks. After an initial fixation cross displayed for 500 ms, neutral, pleasant and unpleasant colorful pictures (hence corresponding to the picture presented at the beginning of each trial of the main progressive unfolding experiment) were presented on the screen in randomized order for 2000 ms. Participants were asked to ignore the hedonic valence of the scenes and provide either familiarity or picture complexity ratings (depend-ing on the condition they were assigned to) us(depend-ing 9-point Likert scales. In case of familiarity judgments, the question was: ‘‘How often have
you encountered a scene like the one depicted in the picture?’’. Scores ranged from 1 (never) to 9 (very often). Raters judging picture complexity, on the other hand, were presented with the question: ‘‘Do you consider this picture as having a homogeneous background and an obvious central figure or do you perceive it as more ‘noisy?’’’, with ‘‘clear figure-ground’’ anchoring the lower end of the scale and ‘‘complex scene’’ anchoring the upper end. The visual stimuli were never displayed on the screen during the rating phase.
E-Prime 2.0 was used for stimulus presentation and response recordings.
Analysis of behavioral data
One-way ANOVAs and post-hoc t-tests were used to verify that the emotional content of the scenes was perceived by our participants in agreement with the normative ratings, as well as to explore differences between neutral, unpleasant and pleasant pictures in terms of familiarity and picture complexity.
Accuracy on the progressive unfolding task was expressed as percentage of correct responses. Moments of recognition (Respons-es1) across the six image levels were not independent of each other: in fact, perceptual evidence was gradually accumulating based on visual input provided by previous image levels. Therefore, cumulative percentages were calculated. This procedure resulted in six psychometric curves showing the evolution of recognition performance across the six image levels, separately for each memory (old, new) and emotion (neutral, unpleasant, pleasant) condition. To characterize effects of emotion and memory on recognition performance, we used a proportional odds model with memory and emotion as predictors [79]. This complex model provides a regression analysis for ordinal dependent variables (recognition from image level 1,…, recognition from image level 6). This data analysis, performed at the single-trial level, allows to model the cumulative probability up to and including recognition from each image level k (k = 1, …, 5). The derived odds ratio expresses how much the odds of recognition from image level k or earlier is increased (if larger than 1) or decreased (if smaller than 1) across new, old, neutral and emotional (unpleasant and pleasant) contents, and thus provides a single number capturing the shift in psychometric curve. To account for dependencies of trials within
Table 2.Cont.
Image pairs
Pair Unpleasant Pleasant
First element Second element First element Second element First element Second element
49 7170 7002 3216 4770 5600 7350
50 7180 4605 3280 6562 5660 5215
51 7184 7236 4635 9008 7230 1999
52 7188 7820 9445 9927 7250 7461
53 7247 7249 2278 9295 7281 2655
54 7354 7058 2400 9145 7390 5700
55 7487 8325 2770 9341 7492 5829
56 7512 2279 9390 7023 7515 8467
57 7550 4220 9922 9561 8050 4534
58 7595 5395 9046 4621 8118 1659
59 7710 5500 2750 9411 8220 7289
60 8241 9700 3301 9331 8371 7400
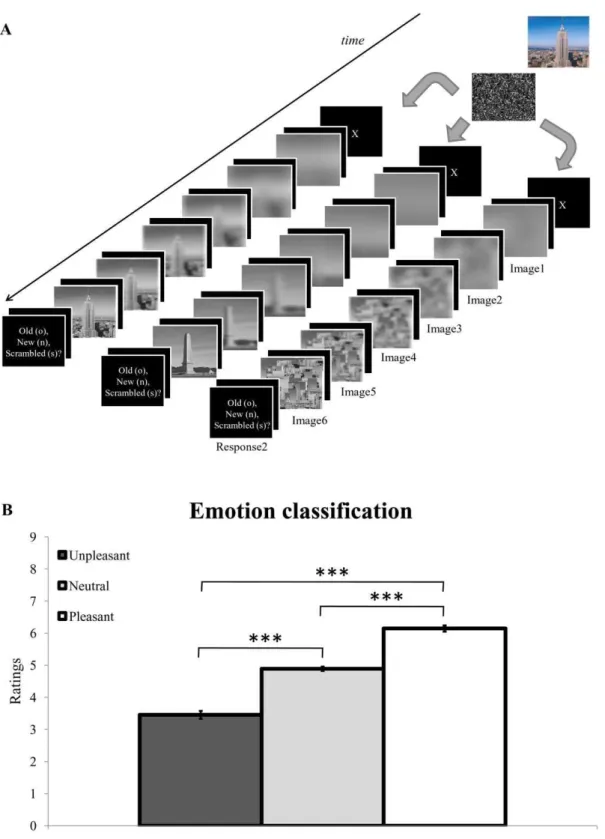
Figure 1. Trial presentation and results of the emotional classification task. (A) Main trial types during the progressive unfolding experiment. A colorful neutral, unpleasant or pleasant IAPS scene (not shown here for copyright reasons) was first presented for 1500 ms, in random order. Following a 2000 ms uniform mask, the same scene (45%), a new one (45%), or a scrambled picture (10%) was progressively revealed in grayscale, using six successive steps varying in a monotonic fashion regarding the content of LSF and HSF information. Each image level was presented for 500 ms, followed by a 250 ms blank screen. Participants had to press a pre-defined button as soon as they could decide whether the gradually unfolded scene was the one seen at the beginning of the trial, a new one, or a scrambled picture (Response1). Five hundred milliseconds after Response1, participants validated their choice and indicated whether the scene was ‘‘old’’, ‘‘new’’ or ‘‘scrambled’’ by pressing one out of three buttons (Response2). (B) Results of the emotion classification task (occurring after Response2 on 10% of the trials) showed higher scores (corresponding to more pleasant pictures) for pleasant scenes (white bar), followed by neutral (light grey bar) and unpleasant (dark grey bar) scenes. *** p,.001. Vertical bars correspond to standard errors of the means.
the same subject, a multi-level version of the proportional odds model was used, similarly to our previous study [43].
Next, we included the mean scores (averaged across raters) of familiarity and picture complexity obtained for each individual picture as additional predictors in the proportional odds model. We verified whether any effect of emotion and/or memory on recognition performance obtained during the main progressive unfolding experiment could be explained by a concurrent effect of familiarity and/or picture complexity.
The level of significance for all these analyses was set at p,0.05. To control for Type I error, a conservative Bonferroni correction was applied to each of the six pairwise comparisons of interest (i.e., emotion, 3 levels; memory, 2 levels) evaluated in each statistical model for the accuracy.
Results
Emotion classification task during the progressive unfolding experiment
Results showed higher ratings for pleasant scenes (M = 6.14, SD = 0.81), followed by neutral (M = 4.89, SD = 0.58) and unpleasant (M = 3.45, SD = 1.06) pictures. A one-way ANOVA on these ratings disclosed a highly significant effect of emotion [F(2, 34) = 39.94, p,.001, gp
2
= .701]. Post-hoc t-tests confirmed highly significant differences between neutral and unpleasant pictures [t(17) = 4.83, p,.001], as well as between neutral and pleasant [t(17) =27.47, p,.001] and unpleasant and pleasant [t(17) =26.81, p,.001] scenes (Figure 1B). These results confirmed that participants perceived and identified the emotional content of the pre-selected stimuli in accordance with the published normative ratings [75].
Accuracy for the progressive unfolding experiment
The percentage of errors remained low in this task (M = 3.66%, SD = 1.85). Likewise, very few errors were committed with ‘‘catch’’ trials (M = 1.75%, SD = 1.90). In addition, the percentage of late responses (Responses1 occurring after the last/sixth image level) was negligible (M = 1.71%, SD = 1.18), providing additional evidence that participants accurately performed the matching task during the gradual stimulus revelation and did not wait until the presentation of the last, fully detailed image level to stop the stimulus sequence (Response1).
Table 3 shows the cumulative percentages of correct responses (i.e., Responses1 only when Responses2 were correct). A mixed proportional odds model [43,79] with memory (old, new) and emotion (neutral, unpleasant, pleasant) as fixed factors, and participant as random effect was carried out on these values, to verify whether the obtained psychometric curves shifted as a function
of memory and/or emotion (Figure 2A and 2B). This analysis revealed, as expected, an overall earlier recognition for old compared to new scenes in all emotion conditions (all ps,.001). More interestingly, pairwise comparisons revealed a shift of the distribution as a function of the emotional content of the scenes. Specifically, an earlier recognition (i.e., less accumulation of evidence) was observed when the picture contained a neutral as opposed to an emotional content (all ps,.01), with no significant difference between pleasant and unpleasant scenes (all ps..05) (see Table 4). The interaction between these two effects (memory and emotion) showed a trend towards significance (p = .064), indicating that the observed delay in recognition for emotional compared to neutral scenes was slightly more pronounced for old relative to new scenes.
Rating experiments
Familiarity ratings of the pre-selected IAPS pictures revealed lower scores for unpleasant scenes (M = 3.48, SD = 0.98), followed by neutral (M = 4.87, SD = 0.89) and pleasant (M = 4.93, SD = 1.05) scenes. A one-way ANOVA on these values disclosed a highly significant effect of emotion [F(2, 40) = 58.64, p,.001,
gp2= .746]. Post-hoc t-tests showed significant differences between
unpleasant and neutral [t(20) =28.51, p,.001], as well as unpleasant and pleasant [t(20) =27.70, p,.001] scenes (Figure 3A). Mean familiarity was similar for pleasant and neutral scenes [t(20) =20.78, p = .445].
Results of picture complexity ratings, on the other hand, showed higher scores for unpleasant (M = 4.70, SD = 0.81), relative to neutral (M = 4.13, SD = 0.64) and pleasant (M = 4.16, SD = 0.74) pictures. A one-way ANOVA carried out on these ratings revealed a highly significant effect of emotion [F(2, 38) = 16.12, p,.001,
gp2= .459]. Pairwise comparisons confirmed significant
differenc-es between unpleasant and neutral [t(19) = 4.19, p,.001] and unpleasant and pleasant [t(19) = 5.87, p,.001] scenes (Figure 3B), whereas no difference was observed between pleasant and neutral scenes [t(19) =20.28, p = .779]. Thus, unpleasant pictures were characterized by lower familiarity and higher picture complexity compared to neutral and pleasant scenes.
Familiarity and picture complexity were found to be anti-correlated, as confirmed by a significant negative correlation [Pearson’s r(360) =20.40, p,.001].
Accuracy for progressive unfolding experiment when controlling for familiarity and picture complexity of the visual scenes
Next, we included the average familiarity and picture complex-ity ratings, obtained for each visual scene separately, as concurrent
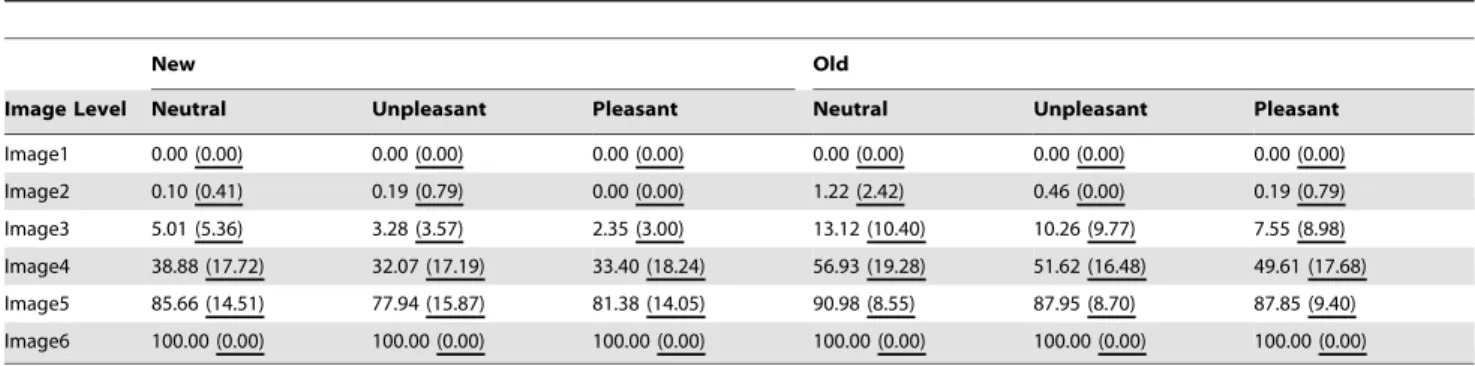
Table 3.Mean values and standard deviations (in parenthesis) of cumulative percentages of correct responses, separately for each image level, emotion and memory condition.
New Old
Image Level Neutral Unpleasant Pleasant Neutral Unpleasant Pleasant
Image1 0.00 (0.00) 0.00 (0.00) 0.00 (0.00) 0.00 (0.00) 0.00 (0.00) 0.00 (0.00)
Image2 0.10 (0.41) 0.19 (0.79) 0.00 (0.00) 1.22 (2.42) 0.46 (0.00) 0.19 (0.79)
predictors in the proportional odds model, in order to statistically assess whether the significant effects of memory (i.e., prolonged explorations for new relative to old scenes) and emotion (i.e., prolonged explorations for emotional relative to neutral scenes) might be confounded by trial-to-trial fluctuations along these non-emotional dimensions.
Main effects of familiarity and picture complexity were significant (all ps,.001), indicating earlier recognition for more familiar and less complex pictures, in line with our predictions. However, and crucially, the analysis revealed that, after having
modeled the potential contribution of these two factors (Table 5), pleasant scenes in the new condition were still associated with a delayed recognition relative to neutral pictures (p = .006) (see also Figure 4A). Pleasant scenes were also recognized later compared to unpleasant pictures (p = .034). However, this difference was no longer considered significant after correction for multiple com-parisons (see Table 5). Interestingly, the difference between neutral and unpleasant scenes was no longer significant in this analysis (p = .621), suggesting that familiarity and picture complexity might have accounted for the difference between neutral and emotional
Figure 2. Accuracy in the main progressive unfolding task.Cumulative percentage of correct Responses1 as a function of the six image levels, in the (A) new and (B) old condition, separately for neutral (solid line), unpleasant (dashed line) and pleasant (dotted line) scenes. The shape and variation of the psychometric function according to the main experimental factors (memory and emotion) confirmed that: (i) participants gathered perceptual evidence prior to recognition; (ii) they had a significantly earlier recognition (i.e., less perceptual evidence needed) for old compared to new scenes. Moreover, for each of these two memory levels, emotional scenes led to a delayed recognition relative to neutral scenes. Vertical bars correspond to standard errors of the means.
scenes in our first analysis (see Table 4). A very similar statistical outcome was observed for old scenes: pleasant pictures led to a prolonged recognition compared to either neutral (p,.001) or unpleasant (p,.001) scenes (see also Figure 4B), whereas the difference between neutral and unpleasant pictures was no longer significant (p = .671). Importantly, the interaction effect between emotion and memory was not significant (p = .102), indicating that the delay in recognition for pleasant scenes was comparable in the new and old conditions. The shift found for pleasant relative to neutral scenes before correcting for complexity and familiarity (see Figure 2) did not therefore appear to be related exclusively to these two specific factors (unlike the case of unpleasant scenes), because the refined analysis controlling for variations along these factors still confirmed this shift (Figure 4).
In order to assess whether familiarity and picture complexity had different influences on accumulation of evidence processes in our experiment, we next modeled recognition performance separately for familiarity and picture complexity. Including effects of familiarity in the model (Table 5) revealed, in the new condition, a significantly delayed recognition for pleasant relative to neutral scenes (p = .002). The difference between pleasant and unpleasant scenes (p = .179), and between unpleasant and neutral scenes (p = .092) were not significant. In the old condition, pleasant scenes were also recognized reliably later compared to neutral (p,.001) and unpleasant (p = .001) ones, whereas the difference between unpleasant and neutral scenes was not significant (p = .228).
When modeling the specific contribution of picture complexity (Table 5), the analysis revealed, in the new condition, a delayed recognition for pleasant relative to neutral scenes (p = .006), whereas the unpleasant vs. neutral comparison was not significant (p = .939). The difference between recognition of pleasant vs. unpleasant pictures (p = .008) was marginally significant after Bonferroni correction. The analysis of recognition performance in the old condition revealed that pleasant scenes were recognized significantly later relative to neutral (p,.001) and unpleasant (p,.001) scenes, whereas the difference between unpleasant and neutral scenes was not significant (p = .901).
Although these analyses led to the same conclusions, it is interesting to note that – based on the standard Akaike information criterion (AIC) [80] – the model including both familiarity and picture complexity was providing the best statistical fit. More specifically, the AIC was 13488 for the model including only familiarity, 12619 for the model with only picture complexity, and 12615 for the model with both factors. Since a lower AIC value is considered to fit the data better [80], these results suggest
that familiarity explained some of the variability over and beyond picture complexity, the inclusion of this latter factor providing a better fit than the former.
Discussion
The aim of our study was twofold: (i) to investigate whether the emotional valence of complex visual scenes could have an impact on the accumulation of perceptual evidence prior to their recognition, in line with previous findings showing a delayed recognition (i.e., prolonged accumulation of evidence) for emo-tional compared to neutral stimuli [43]; (ii) to verify whether these effects may be explained by trial-to-trial fluctuations along other non-emotional variables, with a focus on familiarity and picture complexity.
We used a progressive unfolding task that proved to be useful to explore accumulation of evidence processes prior to scene recognition [43]. After a standard picture encoding phase, participants were presented with series of filtered images that were progressively unfolding the same picture content, a new one or a scrambled one relative to encoding, and the task was to decide whether this scene had previously been presented or not (delayed-match-to-sample task). Of note, the content of either the same scene or a new one was progressively revealed by adding up, in a non-linear fashion, LSF and HSF information, providing a ‘‘coarse-to-fine’’ temporal decomposition of the visual stimulus [45,46,81]. We reasoned that the use of impoverished LSF information (and HSF information to a lesser extent), largely predominating at the beginning of the unfolding sequence, could foster the generation of proactive guesses about the actual identity of the scene progressively revealed [10,33,35].
Results showed a delayed recognition for new compared to old scenes, as well as for emotional relative to neutral pictures, consistent with our previous results [43]. While the former memory effect confirms that participants used abstract visual representations stored in short-term memory to perform the task [82,83], the latter effect indicates that these predictive coding mechanisms during scene recognition were not immune to the rapidly perceived emotional content of the input stimulus. Specifically, pleasant and unpleasant scenes were associated with a delayed recognition relative to neutral pictures, suggesting an emotion-specific modulation of predictive coding effects during scene recognition. Moreover, this systematic time lag for recognizing emotional scenes was similar in the new and old conditions, suggesting a general effect taking place irrespective of the memory status of the perceived scenes.
However, we also found that familiarity and picture complexity each had a substantial influence on accumulation of evidence processes prior to scene recognition. First, results of the additional rating experiments showed that the selected unpleasant scenes were rated as less familiar than either neutral or pleasant scenes (Figure 3A), consistent with previous work [69,71]. This result is in line with the well-known ‘‘mere-repeated-exposure’’ phenomenon [72–74], showing that human beings tend to develop a preference towards objects deemed familiar. Therefore, unpleasant objects or events that are typically avoided are considered as less familiar, exactly as found in our rating experiment. Second, our results showed that unpleasant pictures were also considered to be perceptually more complex compared to either neutral or pleasant scenes (Figure 3B). More specifically, unpleasant scenes were systematically associated with a less evident figure-ground segregation in the auxiliary rating experiment, an effect which might lead to a decreased fluency to process these scenes and hence confer them a negative valence [70,71]. Thus, based on the
Table 4.Results of the mixed proportional odds model.
Memory
condition Comparison
Odds ratio
(95% CI) p-value
pleasant vs. neutral 0.75 (0.63,0.90) 0.003* New pleasant vs. unpleasant 1.11 (0.92,1.33) 0.246
unpleasant vs. neutral 0.67 (0.56,0.81) ,0.001* pleasant vs. neutral 0.65 (0.53,0.77) ,0.001* Old pleasant vs. unpleasant 0.84 (0.71,1.01) 0.064
unpleasant vs. neutral 0.76 (0.64,0.91) 0.006* Note. An odds ratio larger than 1 (smaller than 1, respectively) implies that the probability of recognition at earlier levels is higher (smaller, respectively) for the first vs. the second condition included in the comparison. CI indicates confidence interval.
lower familiarity and higher picture complexity scores obtained for the unpleasant relative to the neutral and pleasant scenes selected in our study, one would predict a change in the speed of accumulation of perceptual evidence for this specific class of emotional stimuli, when compared to the two other conditions. Likewise, given the balanced mean ratings for pleasant and neutral scenes, one could anticipate that accumulation of perceptual evidence would be similar for these two conditions. Instead, our single-trial analysis, in which we included familiarity and complexity ratings – obtained for each and every scene separately – as concurrent regressors (in addition to emotion and memory),
revealed that pleasant scenes were associated with a distinctive delayed accumulation of evidence relative to the two other conditions, regardless of the memory status (old vs. new) and hence presumably ease of recognition of these scenes. Thus, at first sight, familiarity and complexity ratings alone could not account for the shift obtained for pleasant relative to neutral scenes during the main task. These results provide evidence for the contribution of positivity offset during emotion scene recognition [53,84–86]. This concept refers to the fact that, when inputs to the affect system are minimal, positivity outweighs negativity. As a consequence, organisms may engage in exploratory behavior under conditions
Figure 3. Familiarity and picture complexity ratings.Mean (A) familiarity and (B) picture complexity ratings, separately for neutral (dark grey bar), unpleasant (light grey bar) and pleasant (white bar) scenes. On average, unpleasant scenes were rated as less familiar and perceptually more complex (i.e., less obvious figure-ground segregation) relative to either neutral or pleasant scenes. *** p,.001. Vertical bars correspond to standard errors of the means.
in which no immediate threat is detected, with the aim to gain knowledge about novel stimuli in the environment and their potential value, an effect that is usually exacerbated for pleasant/ positive compared to neutral or unpleasant stimuli [53]. Accord-ingly, the results of our study show that participants were prone to gather additional evidence about pictures carrying intrinsic reinforcing hedonistic values (in this case, pleasant pictures), probably because these pictures better matched their actual motivational dispositions. This latter observation also suggests that the influence of positive emotion on perception in our task was probably operating at an abstract level of stimulus representation, before or after specific short-term memory traces came into play. Of note, a prolonged exploration for pleasant relative to neutral or unpleasant scenes in our experiment may alternatively be explained by the differential motivational relevance of this specific emotion stimulus category [53,84,87–89]. This general account appears unlikely though, because we did not observe any gain or change during accumulation of evidence for unpleasant compared to neutral scenes, despite the obvious motivational and/or evolutionary relevance of these negative stimuli [50,51].
The prolonged accumulation of evidence for pleasant relative to neutral and unpleasant scenes may stem from an increase in the number of actual iterations made between updated predictions (initially shaped or constrained by the encoding of the scene in short-term memory) and the progressively accumulated degraded sensory evidence during unfolding, with the aim to minimize prediction errors and favor the most likely interpretation concerning the actual identity of the scene [14,24,90,91]. Alternatively, rather than a quantitative change in the ratio between predictions and errors during accumulation of perceptual evidence, the processing of pleasant scenes may be associated with an overall shift in the decision criterion, relative to neutral or unpleasant scenes. In this view, accumulation of sensory evidence would occur equally fast for neutral and unpleasant scenes, but the delayed decision-making process for pleasant scenes would primarily stem from an enhanced competition between (two or more) choices or alternatives at the decision level per se. The use of computational modeling, and more specifically diffusion models, might turn out to be valuable in this context to tease apart these two accounts [11,48,92,93]. According to these models, decision-making is achieved after having accumulated sufficient sensory evidence, and eventually gathered information in favor of one out of two (or more) alternatives, hence reaching a decision threshold [47–49]. The speed of accumulation of perceptual evidence (also termed drift rate) heavily depends on the strength of the sensory
signal, as well as the signal-to-noise ratio. Thus, the aforemen-tioned computational models provide useful hints to better explain how specific dispositions to engage in exploratory or approach-related behavior in non-threatening environments (i.e., positivity offset) may ultimately influence proactive processes leading to perceptual decision-making. Further studies are needed to assess whether the processing of pleasant scenes is accompanied by a change in the drift rate compared to neutral or unpleasant scenes, or whether genuine post-perceptual processes may account for this emotion effect. Likewise, additional neuroimaging and/or neuro-physiological studies might help clarify whether accumulation of evidence processes are actually generic but vary in speed – depending on the emotional content of the input stimulus – or, instead, several non-overlapping accumulation of evidence brain process may co-exist and can be activated predominantly depending on the valence of this input stimulus.
We have to acknowledge some limitations related to our experimental design and specific data analysis. Familiarity and visual complexity ratings of the pre-selected scenes were collected from two independent samples of participants, while another sample of participants completed the unfolding experiment. It would probably have been more optimal, from a statistical point of view, to use a full within-subject design. However, we did not want to create any bias or expectation regarding the content of the pictures that were progressively revealed during the main experiment. Therefore, we could not ask the same participants to rate the pre-selected visual scenes along the familiarity and picture complexity dimensions before the unfolding experiment. Conversely, ratings obtained for these stimuli would probably be influenced by prior exposure and unbalanced explorations during the unfolding experiment, as revealed for pleasant relative to neutral and unpleasant scenes in our study. Another limitation lies in the possible specificity of these effects for women, because we included mainly female participants and a differential processing of the emotional content of visual stimuli for men and women has previously been reported [94–96]. However, the pictures were carefully selected according to the normative ratings published in the manual for this specific gender [75]. Moreover, we purpose-fully decided not to include highly arousing pictures (e.g., mutilations or erotica) in our stimulus set, because these extreme pictures were found to elicit the largest differences between male and female participants in previous research [65,77].
To sum up, the results of our study show that accumulation of evidence prior to scene recognition is substantially influenced by the perceived emotional content of the visual stimulus. More
Table 5.Results of the alternative mixed proportional odds model, once item-specific values along familiarity and picture complexity were included in the model.
Familiarity and picture
complexity Familiarity alone Picture complexity alone
Memory condition Comparison Odds ratio (95% CI) p-value Odds ratio (95% CI) p-value Odds ratio (95% CI) p-value
New pleasant vs. neutral 0.76 (0.63,0.91) 0.006* 0.74 (0.62,0.88) 0.002* 0.76 (0.63,0.91) 0.006* pleasant vs. unpleasant 0.80 (0.65,0.98) 0.034 0.88 (0.72,1.07) 0.179 0.76 (0.63,0.92) 0.008 unpleasant vs. neutral 0.95 (0.78,1.17) 0.621 0.84 (0.69,1.03) 0.092 0.99 (0.81,1.20) 0.939 Old pleasant vs. neutral 0.62 (0.51,0.74) ,0.001* 0.63 (0.52,0.76) ,0.001* 0.62 (0.51,0.74) ,0.001*
pleasant vs. unpleasant 0.64 (0.53,0.78) ,0.001* 0.71 (0.58,0.86) 0.001* 0.61 (0.50,0.73) ,0.001* unpleasant vs. neutral 0.96 (0.79,1.16) 0.671 0.89 (0.74,1.08) 0.228 1.01 (0.84,1.22) 0.901 Note.
specifically, emotional scenes were associated with a prolonged accumulation of evidence relative to neutral scenes. Controlling for non-emotional dimensions (i.e., familiarity and picture complexity) further revealed a delayed recognition for pleasant compared to unpleasant and neutral scenes, suggesting a valence-specific influence on the speed of proactive guesses prior to perceptual decision-making. More generally, these findings are
consistent with a positivity offset during complex scene recogni-tion. The propensity to dwell longer on pleasant compared to neutral or unpleasant scenes may be explained by a change in the ratio between predictions and errors during accumulation of evidence, while participants actively make guesses and computed online the most probable interpretation regarding the identity of the incoming and progressively unfolded visual scene. Finally,
Figure 4. Accuracy in the main progressive unfolding task, adjusted for non-emotional factors.Cumulative percentage of correct Responses1 as a function of the six image levels, in the (A) new and (B) old condition, separately for neutral (solid line), unpleasant (dashed line) and pleasant (dotted line) scenes, once these values were adjusted for familiarity and picture complexity. A significant shift of the psychometric function (corresponding to prolonged accumulation of evidence) was observed for pleasant compared to either neutral or unpleasant scenes, regardless of memory (old vs. new). No significant difference was found between neutral and unpleasant scenes.
given the evidence showing a strong positivity offset during emotional scene recognition (that cannot easily be accounted for by systematic trial-to-trial fluctuations along familiarity or picture complexity), we believe that this specific experimental paradigm and stimulus set may eventually turn out to be valuable to shed light on possible qualitative alterations during visual emotion perception typically observed in specific psychopathological conditions. For example, this task appears useful to explore possible changes between the expression of positivity offset vs.
negativity bias during scene or object recognition, a modification that might characterize exploration strategies preferentially used by depressed or high anxious individuals [97,98].
Author Contributions
Conceived and designed the experiments: AS GP. Performed the experiments: AS MB. Analyzed the data: AS TL MB GP. Wrote the paper: AS TL GP.
References
1. Palmer SE (1999) Vision Science: Photons to Phenomenology. Cambridge, MA: MIT Press. 832 p.
2. Riesenhuber M, Poggio T (1999) Hierarchical models of object recognition in cortex. Nat Neurosci 2(11): 1019–1025.
3. Blair MR, Watson MR, Walshe RC, Maj F (2009) Extremely Selective Attention: Eye-Tracking Studies of the Dynamic Allocation of Attention to Stimulus Features in Categorization. J Exp Psychol Learn 35(5): 1196–1206. 4. Treisman AM, Kanwisher NG (1998) Perceiving visually presented objects:
recognition, awareness, and modularity. Curr Opin Neurobiol 8(2): 218–226. 5. Kim S, Rehder B (2011) How prior knowledge affects selective attention during
category learning: An eyetracking study. Mem Cognition 39(4): 649–665. 6. Egner T, Hirsch J (2005) Cognitive control mechanisms resolve conflict through
cortical amplification of task-relevant information. Nat Neurosci 8(12): 1784–1790.
7. Summerfield C, Egner T (2009) Expectation (and attention) in visual cognition. Trends Cogn Sci 13(9): 403–409.
8. Rahnev D, Lau H, de Lange FP (2011) Prior Expectation Modulates the Interaction between Sensory and Prefrontal Regions in the Human Brain. J Neurosci 31(29): 10741–10748.
9. Oliva A, Torralba A (2007) The role of context in object recognition. Trends Cogn Sci 11(12): 520–527.
10. Bar M (2004) Visual objects in context. Nature Rev Neurosci 5(8): 617–629. 11. Heekeren HR, Marrett S, Ungerleider LG (2008) The neural systems that
mediate human perceptual decision making. Nature Rev Neurosci 9(6): 467–479.
12. Ridderinkhof KR, Ullsperger M, Crone EA, Nieuwenhuiss S (2004) The role of the medial frontal cortex in cognitive control. Science 306(5695): 443–447. 13. Enns JT, Lleras A (2008) What’s next? New evidence for prediction in human
vision. Trends Cogn Sci 12(9): 327–333.
14. Friston K (2005) A theory of cortical responses. Philos Trans R Soc Lond B Biol Sci 360(1456): 815–836.
15. Friston K, Kiebel S (2009) Predictive coding under the free-energy principle. Philos Trans R Soc Lond B Biol Sci 364(1521): 1211–1221.
16. Grossberg S (2009) Cortical and subcortical predictive dynamics and learning during perception, cognition, emotion and action. Philos T Roy Soc B 364(1521): 1223–1234.
17. Lochmann T, Deneve S (2011) Neural processing as causal inference. Curr Opin Neurobiol 21(5): 774–781.
18. Mumford D (1992) On the Computational Architecture of the Neocortex. II. The Role of Corticocortical Loops. Biol Cybern 66(3): 241–251.
19. Rao RPN, Ballard DH (1999) Predictive coding in the visual cortex: a functional interpretation of some extra-classical receptive-field effects. Nat Neurosci 2(1): 79–87.
20. Spratling MW (2008) Predictive coding as a model of biased competition in visual attention. Vision Res 48(12): 1391–1408.
21. Ullman S (1995) Sequence Seeking and Counter Streams - a Computational Model for Bidirectional Information-Flow in the Visual-Cortex. Cereb Cortex 5(1): 1–11.
22. Alink A, Schwiedrzik CM, Kohler A, Singer W, Muckli L (2010) Stimulus Predictability Reduces Responses in Primary Visual Cortex. J Neurosci 30(8): 2960–2966.
23. Di Lollo V, Enns JT, Rensink RA (2000) Competition for consciousness among visual events: The psychophysics of reentrant visual processes. J Exp Psychol Gen 129(4): 481–507.
24. Friston K (2009) The free-energy principle: a rough guide to the brain? Trends Cogn Sci 13(7): 293–301.
25. Bar M, Kassam KS, Ghuman AS, Boshyan J, Schmidt AM, et al. (2006) Top-down facilitation of visual recognition. P Natl Acad Sci USA 103(2): 449–454. 26. Pourtois G, Dan ES, Grandjean D, Sander D, Vuilleumier P (2005) Enhanced extrastriate visual response to bandpass spatial frequency filtered fearful faces: Time course and topographic evoked-potentials mapping. Hum Brain Mapp 26(1): 65–79.
27. Goffaux V, Peters J, Haubrechts J, Schiltz C, Jansma B, et al. (2011) From Coarse to Fine? Spatial and Temporal Dynamics of Cortical Face Processing. Cereb Cortex 21(2): 467–476.
28. Winston JS, Vuilleumier P, Dolan RJ (2003) Effects of low-spatial frequency components of fearful faces on fusiform cortex activity. Curr Biol 13(20): 1824–1829.
29. Oliva A, Schyns PG (1997) Coarse blobs or fine edges? Evidence that information diagnosticity changes the perception of complex visual stimuli. Cognitive Psychol 34(1): 72–107.
30. Schyns PG, Oliva A (1994) From Blobs to Boundary Edges: Evidence for Time-and Spatial-Scale-Dependent Scene Recognition. Psychol Sci 5(4): 195–200. 31. Torralba A, Oliva A (2003) Statistics of natural image categories.
Network-Comp Neural 14(3): 391–412.
32. Carretie´ L, Hinojosa JA, Lopez-Martin S, Tapia M (2007) An electrophysio-logical study on the interaction between emotional content and spatial frequency of visual stimuli. Neuropsychologia 45(6): 1187–1195.
33. Bar M (2003) A cortical mechanism for triggering top-down facilitation in visual object recognition. J Cognitive Neurosci 15(4): 600–609.
34. Bar M (2009) The proactive brain: memory for predictions. Philos Trans R Soc Lond B Biol Sci 364(1521): 1235–1243.
35. Bar M (2007) The proactive brain: using analogies and associations to generate predictions. Trends Cogn Sci 11(7): 280–289.
36. Kveraga K, Ghuman AS, Bar M (2007) Top-down predictions in the cognitive brain. Brain Cognition 65(2): 145–168.
37. Vuilleumier P (2005) How brains beware: neural mechanisms of emotional attention. Trends Cogn Sci 9(12): 585–594.
38. Vuilleumier P, Pourtois G (2007) Distributed and interactive brain mechanisms during emotion face perception: Evidence from functional neuroimaging. Neuropsychologia 45(1): 174–194.
39. O¨ hman A, Flykt A, Esteves F (2001) Emotion drives attention: Detecting the snake in the grass. J Exp Psychol Gen 130(3): 466–478.
40. Phelps EA, Ling S, Carrasco M (2006) Emotion facilitates perception and potentiates the perceptual benefits of attention. Psychol Sci 17(4): 292–299. 41. Bocanegra BR, Zeelenberg R (2009) Emotion Improves and Impairs Early
Vision. Psychol Sci 20(6): 707–713.
42. Barrett LF, Bar M (2009) See it with feeling: affective predictions during object perception. Philos Trans R Soc Lond B Biol Sci 364(1521): 1325–1334. 43. Schettino A, Loeys T, Delplanque S, Pourtois G (2011) Brain dynamics of
upstream perceptual processes leading to visual object recognition: A high density ERP topographic mapping study. Neuroimage 55(3): 1227–1241. 44. Navon D (1977) Forest Before Trees: The Precedence of Global Features in
Visual Perception. Cognitive Psychol 9(3): 353–383.
45. Bullier J (2001) Integrated model of visual processing. Brain Res Rev 36(2–3): 96–107.
46. Hegde´ J (2008) Time course of visual perception: Coarse-to-fine processing and beyond. Prog Neurobiol 84(4): 405–439.
47. Ratcliff R, McKoon G (2008) The diffusion decision model: Theory and data for two-choice decision tasks. Neural Comput 20(4): 873–922.
48. Gold JI, Shadlen MN (2007) The neural basis of decision making. Annu Rev Neurosci 30: 535–574.
49. Smith PL, Ratcliff R (2004) Psychology and neurobiology of simple decisions. Trends Neurosci 27(3): 161–168.
50. Ito TA, Larsen JT, Smith NK, Cacioppo, JT (1998) Negative information weighs more heavily on the brain: The negativity bias in evaluative categorizations. J Pers Soc Psychol 75(4): 887–900.
51. Cacioppo JT, Ito TA (1999) Activation functions for positive and negative affective processes: The negativity bias. Psychophysiology 36: S4.
52. Ito TA, Cacioppo JT, Lang PJ (1998) Eliciting affect using the international affective picture system: Trajectories through evaluative space. Pers Soc Psychol B 24(8): 855–879.
53. Norris CJ, Gollan J, Berntson GG, Cacioppo JT (2010) The current status of research on the structure of evaluative space. Biol Psychol 84(3): 422–436. 54. Spruyt A, De Houwer J, Hermans D (2009) Modulation of automatic semantic
priming by feature-specific attention allocation. J Mem Lang 61(1): 37–54. 55. Spruyt A, De Houwer J, Hermans D, Eelen P (2007) Affective priming of
nonaffective semantic categorization responses. Exp Psychol 54(1): 44–53. 56. Pessoa L (2008) On the relationship between emotion and cognition. Nat Rev
Neurosci 9(2): 148–158.
57. Pessoa L, Kastner S, Ungerleider LG (2002) Attentional control of the processing of neutral and emotional stimuli. Cognitive Brain Res 15(1): 31–45. 58. Bradley MM, Hamby S, Low A, Lang PJ (2007) Brain potentials in perception: Picture complexity and emotional arousal. Psychophysiology 44(3): 364–373. 59. Driver J, Baylis GC (1996) Edge-assignment and figure-ground segmentation in
60. Craft E, Schutze H, Niebur E, von der Heydt R (2007) A neural model of figure-ground organization. J Neurophysiol 97(6): 4310–4326.
61. Roelfsema PR, Lamme VAF, Spekreijse H, Bosch H (2002) Figure-ground segregation in a recurrent network architecture. J Cognitive Neurosci 14(4): 525–537.
62. Albright TD, Stoner GR (2002) Contextual influences on visual processing. Annu Rev Neurosci 25: 339–379.
63. Carretie´ L, Hinojosa JA, Martin-Loeches M, Mercado F, Tapia M (2004) Automatic attention to emotional stimuli: Neural correlates. Hum Brain Mapp 22(4): 290–299.
64. Wiens S, Sand A, Olofsson JK (2011) Nonemotional features suppress early and enhance late emotional electrocortical responses to negative pictures. Biol Psychol 86(1): 83–89.
65. Schupp HT, Stockburger J, Codispoti M, Jungho¨fer M, Weike AI, et al. (2007) Selective visual attention to emotion. J Neurosci 27(5): 1082–1089.
66. Schupp HT, Flaisch T, Stockburger J, Jungho¨fer M (2006) Emotion and attention: Event-related brain potential studies. J Psychophysiol 20(2): 115–115. 67. Libkuman TM, Otam H, Kern R, Viger SG, Novak N (2007) Multidimensional normative ratings for the international affective picture system. Behav Res Methods 39(2): 326–334.
68. Mendes WB, Blascovich J, Hunter SB, Lickel B, Jost JT (2007) Threatened by the unexpected: Physiological responses during social interactions with expectancy-violating partners. J Pers Soc Psychol 92(4): 698–716.
69. Bradley MM, Lang PJ, Cuthbert BN (1993) Emotion, Novelty, and the Startle Reflex: Habituation in Humans. Behav Neurosci 107(6): 970–980.
70. Winkielman P, Schwarz N, Fazendeiro T, Reber R (2003) The hedonic marking of processing fluency: Implications for evaluative judgment. In: Klauer JMKC, ed. The psychology of evaluation: Affective processes in cognition and emotion. Mahwah, NJ: Lawrence Erlbaum. pp 189–217.
71. Winkielman P, Cacioppo JT (2001) Mind at ease puts a smile on the face: Psychophysiological evidence that processing facilitation elicits positive affect. J Pers Soc Psychol 81(6): 989–1000.
72. Monahan JL, Murphy ST, Zajonc RB (2000) Subliminal mere exposure: Specific, general, and diffuse effects. Psychol Sci 11(6): 462–466.
73. Zajonc RB (2001) Mere exposure: A gateway to the subliminal. Curr Dir Psychol Sci 10(6): 224–228.
74. Zajonc RB (1968) Attitudinal effects of mere exposures. J Pers Soc Psychol 9(2, Pt. 2): 1–27.
75. Lang PJ, Bradley MM, Cuthbert BN (2008) International affective picture system (IAPS): Affective ratings of pictures and instruction manual. Technical Report A-8: University of Florida, Gainesville, FL.
76. Bradley MM, Lang PJ (1994) Measuring Emotion: The Self-Assessment Mannequin and the Semantic Differential. J Behav Ther Exp Psy 25(1): 49–59. 77. Schupp HT, Stockburger J, Codispoti M, Jungho¨fer M, Weike AI, et al. (2006) Stimulus novelty and emotion perception: the near absence of habituation in the visual cortex. Neuroreport 17(4): 365–369.
78. Delplanque S, N’diaye K, Scherer K, Grandjean D (2007) Spatial frequencies or emotional effects? A systematic measure of spatial frequencies for IAPS pictures by a discrete wavelet analysis. J Neurosci Meth 165(1): 144–150.
79. Agresti A (2007) An Introduction to Categorical Data Analysis. New York: Wiley.
80. Akaike H (1974) A new look at the statistical model identification. IEEE T Automat Contr 19(6): 716–723.
81. Marr D (1982) Vision: A Computational Investigation into the Human Representation and Processing of Visual Information. New York: Freeman. 82. Vogel EK, Woodman GF, Luck SJ (2001) Storage of features, conjunctions, and
objects in visual working memory. J Exp Psychol Human 27(1): 92–114. 83. Alvarez GA, Cavanagh P (2004) The capacity of visual short-term memory is set
both by visual information load and by number of objects. Psychol Sci 15(2): 106–111.
84. Cacioppo JT, Gardner WL (1999) Emotion. Annu Rev Psychol 50: 191–214. 85. Cacioppo JT, Gardner WL, Berntson GG (1999) The affect system has parallel
and integrative processing components: Form follows function. J Pers Soc Psychol 76(5): 839–855.
86. Cacioppo JT, Gardner WL, Berntson GG (1997) Beyond Bipolar Conceptu-alizations and Measures: The Case of Attitudes and Evaluative Space. Pers Soc Psychol Rev 1(1): 3–25.
87. Bradley MM (2009) Natural selective attention: Orienting and emotion. Psychophysiology 46(1): 1–11.
88. Lang PJ, Bradley MM, Cuthbert BN (1990) Emotion, Attention, and the Startle Reflex. Psychol Rev 97(3): 377–395.
89. Schupp HT, Cuthbert BN, Bradley MM, Cacioppo JT, Ito TA, et al. (2000) Affective picture processing: The late positive potential is modulated by motivational relevance. Psychophysiology 37(2): 257–261.
90. Friston K (2002) Functional integration and inference in the brain. Prog Neurobiol 68(2): 113–143.
91. Serences JT (2008) Value-Based Modulations in Human Visual Cortex. Neuron, 60(6): 1169–1181.
92. Heekeren HR, Marrett S, Bandettini PA, Ungerleider LG (2004) A general mechanism for perceptual decision-making in the human brain. Nature 431(7010): 859–862.
93. Philiastides MG, Auksztulewicz R, Heekeren HR, Blankenburg F (2011) Causal Role of Dorsolateral Prefrontal Cortex in Human Perceptual Decision Making. Curr Biol, 21(11): 980–983.
94. Wager TD, Phan KL, Liberzon I, Taylor S (2003) Valence, gender, and lateralization of functional brain anatomy in emotion: a meta-analysis of findings from neuroimaging. Neuroimage 19: 513–531.
95. Bradley MM, Codispoti M, Sabatinelli D, Lang PJ (2001) Emotion and motivation II: sex differences in picture processing. Emotion 1: 300–19. 96. Hamann S, Canli T (2004) Individual differences in emotion processing. Curr
Opin Neurobiol 14: 233–238.
97. Conklin LR, Strunk DR, Fazio RH (2009) Attitude formation in depression: Evidence for deficits in forming positive attitudes. J Behav Ther Exp Psy 40(1): 120–126.