AR
TICLE
203
Physical Frailty and cognitive performance in older populations,
part I: systematic review with meta-analysis
Abstract The purpose of present study was to analyze the magnitude of the effect-size in the assessment of the cognitive status of populations over 60 years of age. The search strategy included PubMed, B-on, Ebsco, Ebsco Health, Scielo, Eric, Lilacs and Sportdiscus data bases. Only obser-vational, cohort and cross-sectional studies were included in the meta-analysis. The central de-scriptors were elderly-frail, older adults, cognition and geriatric assessment and other additional terms. After applying the additional search crite-ria, 12 manuscripts were selected from an initial universe of 1,078 identified. When comparing the mean cognitive profile scores of the partici-pants of the pre-frail (n =11,265) and frail (n = 2,460) groups, significant statistical differences were found (p<0,001), with lower mean scores emerging in frail-group. The results showed that cognitive decline is strongly associated with frail-ty, being a probable main clinical outcome. In this sense, any strategy aimed at mitigating or revers-ing the incidence of frailty with agerevers-ing should take into account that physical and cognitive frailty seem to have similar temporal trajectories.
Key words Frail-older adults, Mild cognitive
im-pairment, Geriatric assessment, Cognition Guilherme Eustáquio Furtado 1
Rubens Letieri 2 Eef Hogervorst 3 Ana Botelho Teixeira 1 José Pedro Ferreira 1
DOI: 10.1590/1413-81232018241.03692017
1 Centro de Investigação em
Desporto e Atividade Física, Faculdade de Ciências do Desporto e Educação Física, Universidade de Coimbra. Av. Conímbriga/ Estádio Universitário de Coimbra Pavilhão III, Santa Clara. 3040248 Coimbra Portugal.
2 Núcleo de pesquisa
multidisciplinar em EducaçãoFísica, Universidade Federal de Tocantins. Tocantinópolis TO Brasil.
3 Grupo de Pesquisa
204
Fur
ta
do GE
et al.
Introduction
The frailty syndrome (FS) is a complex condition characterized by the decline of multiple physio-logical systems, leading to progressive loss of the energy reserves, compromising the ability to
re-sist the adverse effects of chronic stress1. There
are several approaches related to FS, but recently
the study developed by Fried et al.2, is one of the
most important. From this construct, emerged the main pillars considered as the pathological core of FS, such as negative energy balance, sar-copenia and low levels of physical activity.
From a frailty state, the individual tends to go through institutionalization and/or
hospitaliza-tion often followed by precociously death3,4. The
vulnerability acquired by these losses can lead to a frail state, due to exposure to aggression in
multiple physiological systems3,5. For this reason,
much of the money spent on health care for the population is concentrated on the frail individu-als who progress to developing more severe
clini-cal conditions6. This represents an average of
20-35% of the elderly population in contemporary
societies, according to recent research1,2,7.
The FS is aging-related, although it does not
exclusively result from the aging process8. The
gender differences indicated that frail men are more susceptible to early which was proven in studies linking the FS and the incidence of
mor-bidity9, however, the incidence in women has
exponentially increased. In general, older frail individuals are those at increased risk for adverse
clinical outcomes10-12. The consistent relationship
between FS and the physical-functional decline does not invalidate the importance of other
di-mensions associated with a frailty condition13-15.
Recent research has tried to identify other clinical
conditions associated with the FS3,5,16,17, such as
the ‘frailty’ of neurocognitive functions18,19.
An imminent consequence is the clinical
out-comes related to mental health20, which can also
be characterized by traumas caused by falls or
a high fear (risk) of falling21, acute neurological
outcomes triggered suddenly (dementia caused
by a stroke)22, Alzheimer and/or Parkinson19.
However, recent studies try to make it increas-ingly clear that there is an association between the FS and low cognitive profile or so-called mild
cognitive impairment (MCI)18,22. This condition
is characterized by the transient state between
normal cognitive aging and mild dementia23.
This condition results in progressive memory loss greater than expected for its age and
educa-tional level24, although other cognitive functions
are generally preserved and do not interfere with the daily living tasks. Several studies have shown statistically significant differences in cognitive status when analyzed according to subgroups of Frailty, that is those who are pre-frail or frail tend to be more affected by MCI when compared with
non-frail groups25-27.
Currently, there is a large number of stud-ies carried out in large population databases
aimed at screening and detecting the FS6,19,34:
Their results confirm the hypothetical premise of the existence of a ‘new frailty subgroup’ as a more recurring pattern, that results from a phys-ical-functional decline and an associated
neu-rocognitive decline19,30. Unlike some systematic
reviews on the topic31, the objective of this study
was to investigate, through a systematic review followed by meta-analysis (SRM), the magnitude of the effects of different frailty levels (pre-frail vs. frail) in evaluating cognitive status of people over 60 years of age.
Methods
Search strategies
Scientific research studies were conducted in the following databases: PubMed, ‘B-on, Scielo, Sportdiscus and PsycINFO, with access made be-tween the months of July 2015 and January 2016, using the advanced meta-search option, in which original articles of epidemiological studies of cross-sectional, observational, cohort and popu-lation-based published between 2000-2016 were selected. To refine the search, the combination
of the indexed descriptors in Medical Subjects
Headings32, was used: (((“frail elderly”[MeSH Terms] OR “frail” [MeSH Terms]) AND “cog-nition”[MeSH Terms]) OR ([mild cognitive impariment]] AND “frail older adults”[MeSH Terms]) OR “frail older adults”[MeSH Terms] AND”[mini-mental State exam]”AND”Fried criteria”AND”Frailty Phenotype AND”Pheno-type of Fried.”
205
C
iência & S
aúd
e C
ole
tiv
a,
24(1):203-218,
2019
criteria’, ‘Fried fragility phenotype’ and ‘Fried phenotype’ in English and Portuguese were used as additional search terms, following a strategy
used in a previous study9.
Central criterion studies selection
The main criterion for the selection of arti-cles in the SRM, is reflected in the inclusion of articles that used the evaluation criteria of the FS, according to the Phenotype of Frailty (PF)
The-ory2, as well as the use of the test Mini-Mental
State Examination (MMSE)33 in the assessment
of cognitive status in the populations.
The criterion of ‘weight loss’ is checked by self-report, which questions the individual on the loss of ‘ four or more kilograms of weight’ in the last year or, when there is a loss of 5% of total body weight in the three months prior to the evaluation date. The dimension “exhaustion” is verified through the negative concordance be-tween two questions (number seven and twen-ty) of the assessment questionnaire called the
CES-D34. For measurement of the ‘physical
ac-tivity levels’ through weekly energy expenditure in the elderly, we used the short version of the
Minnesota Questionnaire35. ‘Walking speed’ is
measured through a walking test of 4.6 meters, measuring the time taken by the elderly to go this distance at a comfortable speed, and whose
val-ues are adjusted for age and gender36. ‘Strength’ is
assessed using the handgrip test for grip strength, adjusting the values according to age and body
mass index37. The evaluation of these criteria
al-lows to classify the individual in frail (three or more obvious criteria), pre-frail (two of the ob-vious conditions) and non-frail or ‘robust’ (with nullity in five criteria)2,15.
The Mini-Mental State Examination
(MMSE)33 is an instrument composed of 30
ques-tions, which is able to assess the five dimensions
of cognitive profile38. Its score can range from
zero to 30 points, and according to the criteria established in several studies, cut-off values that classify individuals on the following cognitive profiles are accepted: a) Severe Cognitive Disor-der (from 1 to 9 points), b) MoDisor-derate Cognitive Disorder (10 to 18 points) c) Mild Cognitive Im-pairment (19 to 24 points), d) Normal Cognitive
Profile (equal to or over 25 points)39. The MMSE
is the most used assessment tool of cognitive sta-tus in studies of frailty since it is able to assess
what it is intended to evaluate40.
The exclusion criteria of this study presented the elimination of all the manuscripts that did
not meet the initial selection criteria, as well as all those that presented as opinion articles, letters to editor, systematic reviews and protocol format studies.
Data extraction
The initial search for the present SRM study was carried out by two researchers independent-ly, following the ultimate criterion for selection of the articles. For the final selection we included all manuscripts that evaluated older populations by FS subgroups of ‘pre-frail’ and ‘frail’, as well as comparing the mean scores (as a continuous variable) of the results of the MMSE according to the aforementioned subgroups, regardless of the gender of the participants in study samples
included in the review39.
Methodological design of the research
This study followed the PRISMA Positioning guidelines to aid in the methodological design of
this study41. These guidelines describe the four
stages (identification, screening, eligibility, fi-nal selection) needed to perform the search and selection of manuscripts under an RS, and
fea-ture the graphics option to draw a flowchart42.
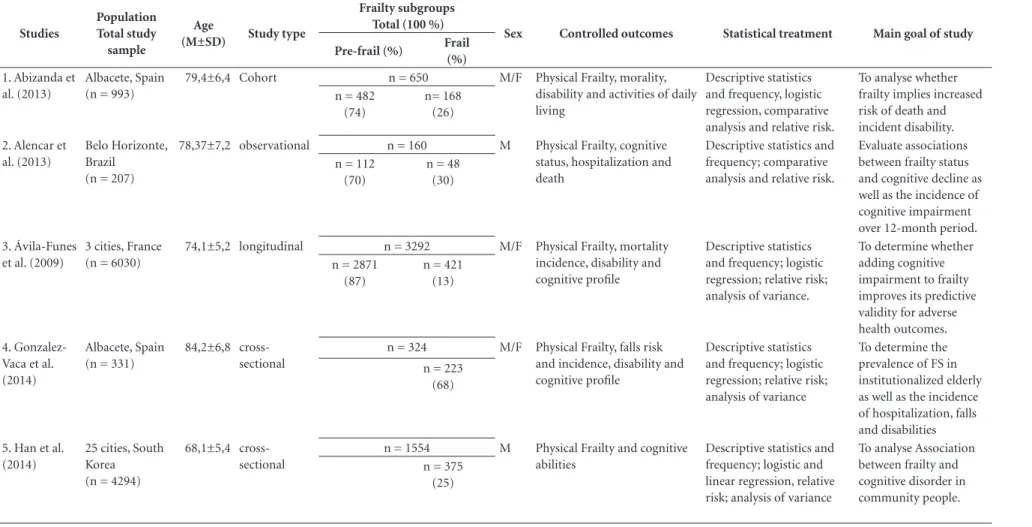
At the same time, the SRM presents the PICOS acronym (‘patient, problem or population’, ‘in-tervention’, ‘comparison, control or comparison’, ‘outcomes’), which directs the refinement of the systematic search, making the process more ef-fective (Table 1)41.
Quality of information assessment
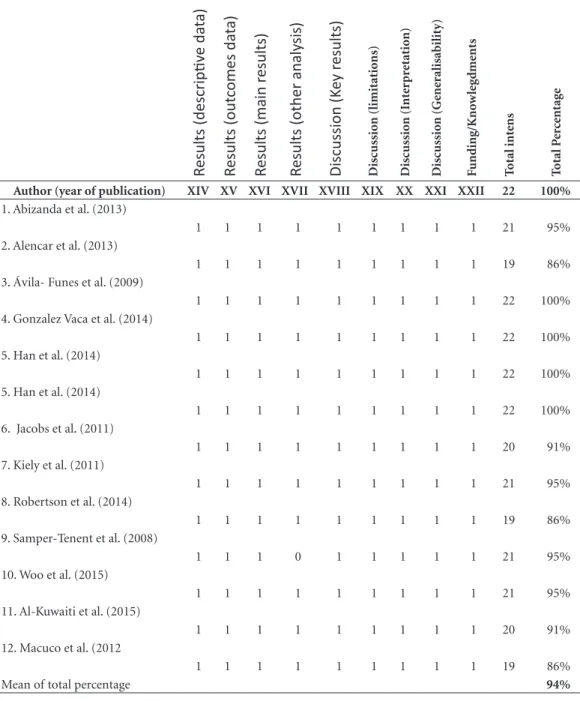
In addition to this method, we chose to use the Strobe Positioning43. This method consists of a checklist comprising 22 items, which char-acterizes a manuscript based on the Quality As-sessment (QA) that it presents. In this study, we used a combined model of study designs, specific to assess observational, epidemiological,
popu-lation-based, cross-sectional or cohort studies44.
After applying all the above criteria, to the total score of the 22 items has a value equal to 100%. However, the percentage was used to identify studies in which low QA could have interfered with the results of the SRM.
Statistical analysis
206 Furtado GE et al.
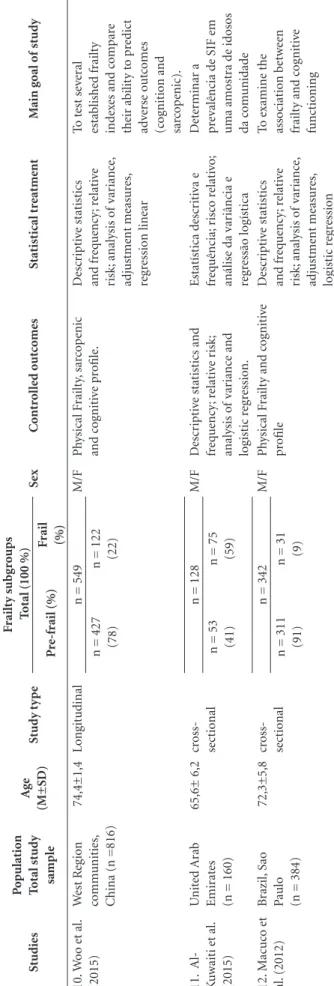
Table 1. Descriptive characteristics of all studies included in quantitative analysis following PRISMA guidelines.
Studies
Population Total study
sample
Age
(M±SD) Study type
Frailty subgroups Total (100 %)
Sex Controlled outcomes Statistical treatment Main goal of study Pre-frail (%) Frail
(%)
1. Abizanda et al. (2013)
Albacete, Spain (n = 993)
79,4±6,4 Cohort n = 650 M/F Physical Frailty, morality,
disability and activities of daily living
Descriptive statistics and frequency, logistic regression, comparative analysis and relative risk.
To analyse whether frailty implies increased risk of death and incident disability. n = 482
(74)
n= 168 (26)
2. Alencar et al. (2013)
Belo Horizonte, Brazil
(n = 207)
78,37±7,2 observational n = 160 M Physical Frailty, cognitive
status, hospitalization and death
Descriptive statistics and frequency; comparative analysis and relative risk.
Evaluate associations between frailty status and cognitive decline as well as the incidence of cognitive impairment over 12-month period. n = 112
(70)
n = 48 (30)
3. Ávila-Funes et al. (2009)
3 cities, France (n = 6030)
74,1±5,2 longitudinal n = 3292 M/F Physical Frailty, mortality
incidence, disability and cognitive profile
Descriptive statistics and frequency; logistic regression; relative risk; analysis of variance.
To determine whether adding cognitive impairment to frailty improves its predictive validity for adverse health outcomes. n = 2871
(87)
n = 421 (13)
4. Gonzalez-Vaca et al. (2014)
Albacete, Spain (n = 331)
84,2±6,8 cross-sectional
n = 324 M/F Physical Frailty, falls risk
and incidence, disability and cognitive profile
Descriptive statistics and frequency; logistic regression; relative risk; analysis of variance
To determine the prevalence of FS in institutionalized elderly as well as the incidence of hospitalization, falls and disabilities n = 223
(68)
5. Han et al. (2014)
25 cities, South Korea (n = 4294)
68,1±5,4 cross-sectional
n = 1554 M Physical Frailty and cognitive
abilities
Descriptive statistics and frequency; logistic and linear regression, relative risk; analysis of variance
To analyse Association between frailty and cognitive disorder in community people. n = 375
(25)
207
Ciência & S aúde C
oleti va, 24(1):203-218, 2019
Studies
Population Total study
sample
Age
(M±SD) Study type
Frailty subgroups Total (100 %)
Sex Controlled outcomes Statistical treatment Main goal of study Pre-frail (%) Frail
(%)
5. Han et al. (2014)
25 cities, South Korea (n = 4294)
64,8±3,72 cross-sectional
n = 3501 F Physical Frailty and cognitive
abilities.
Descriptive statistics and frequency; logistic and linear regression, relative risk; analysis of variance
To analyse association between frailty and cognitive disorder n = 2894
(83)
n = 607 (17)
6. Jacobs et al. (2011)
Jerusalem – Israel (n = 840)
87,5±5,4 Longitudinal n = 634 M Physical Frailty and cognitive
status.
Descriptive statistics and frequency; relative risk; comparison, adjustment measures, linear and logistic regression.
To examine the association between frailty and cognitive impairment and the impact on 5-years survival
(n = 840) n = 164
(26)
7. Kiely et al. (2008)
Boston – United Estates (n = 765)
78,1±5,4 Observacional n = 331 M/F Physical Frailty, falls, disability
and hospitalization.
Descriptive statistics and frequency; relative risk; analysis of variance, and linear regression
To validate two established frailty indexes and compare their ability to predict adverse outcomes.
(n = 765) n = 76
(11)
8. Robertson et al. (2014)
Ireland (n = 4651)
61,8±1,4 Longitudinal n = 1534 F Physical Frailty and cognitive
abilities
Descriptive statistics and frequency; relative risk; analysis of variance, adjustment measures, linear regression and relative risk
To explore the relationship between cognitive function and physical frailty syndrome.
Ireland n = 90
(6)
9. Samper-Tenent et al. (2008)
Hispano-descents residents United States (n = 1370)
75,2±5,8 Observacional n = 686 M/F Physical Frailty and cognitive
profile
Descriptive statistics and frequency; relative risk; analysis of variance, adjustment measures, linear regression
Examine the association between frailty status and change in cognitive function over time
(n = 1370) n = 60
(9)
Table 1. Descriptive characteristics of all studies included in quantitative analysis following PRISMA guidelines.
208
Fur
ta
do GE
et al.
when comparing the groups of pre-frail and frail groups, as well as their respective standard devi-ation, variance, confidence intervals (95%), the magnitude of the effects and levels of statistical
significance (p £ 0.05)45. The global average of
the studies included in the SRM was calculated based on the random effects model in relation to the methodological heterogeneity of the studies and their participants. The risk of publication bias was assessed by the method of the visual in-spection method of scatter plot generated by the
Egger’s intercept test46. The statistical
heteroge-neity of the studies included in the review was checked with the calculation of the Cochran Q
test and the Higgin I2, which represent the
per-centage of the variance attributed to the
hetero-geneity of the study, ranging from low (25% <I2
<50%) to high (I2> 75%)46. The statistical
treat-ment was performed using the statistical pro-gram Comprehensive Meta-Analysis - Version 3.047.
Results
Study manuscripts sample
Figure 1 depicts in detail the steps under-taken in conducting the SRM. After completion of the initial search, a total of 1078 manuscripts were initially identified. After applying the first study selection criteria, 954 were excluded and 124 studies passed the screening stage. At this stage, in which the selection criterion was to read the abstracts, 79 studies were excluded. From the 45 studies that passed the eligibility stage, 28 were excluded after a full reading of the manuscripts and 17 studies remained.
From the 17 manuscripts eligible for evalu-ation of the QA according to the criteria
estab-lished by the Strobbepositioning44, two were
ex-cluded as they presented the values of the MMSE categorically. Three other studies were excluded at the end of the eligibility stage as they used dif-ferent definitions of the FS or submitted incom-plete or agglutinated subgroups of the FS. A total of 12 manuscripts were selected to be integrated into the quantitative analysis (Table 1).
Study sample
The 12 selected manuscripts defined the FS according to the operational criteria proposed by
Fried et al.2. The use of this protocol for the
eval-uation of the participants requires a
multidimen-S tudies P o pulat io n T otal stud y sample Ag e (M±SD) S tud y t y p e F railt y s ubg roups T
otal (100 %)
S ex C o nt rol le d ou tc o mes S tat ist ical t re at me nt M ain g o al o f stud y P re-fr ail (%) F rail (%) 10. W oo e t al. (2015) W est R eg io n co mm unit ies, C
hina (n =816)
74,4±1,4
Lo
ng
it
udinal
n = 549
M/F Ph ysical F railt y, sar co p enic and c og nit iv e p rofile. D escr ip ti ve stat ist ics and fr eq ue ncy ; r elat iv e risk; anal ysis o f v ar ianc e, adj ust me nt meas ur es, re gr essio n linear To t est se ve ral estab lishe d fr ailt y ind ex
es and c
ompar e the ir ab ilit y t o p re dic t ad ve rse ou tc omes (c og nit io n and sar co p enic).
n = 427 (78) n = 122 (22)
11. A l-K uwait i e t al. (2015) U nit ed A rab Emir at es
(n = 160)
65,6± 6,2 cr oss-se ct io nal
n = 128
M/F D escr ip ti ve stat ist ics and fr eq ue ncy ; r elat iv e r isk; anal ysis o f v ar ianc e and lo gist ic r eg ressio n. Estatíst ica d escr it iv a e fr eq uência; r isc o r elat iv o;
análise da v
ar iância e re gr essão lo gíst ica D et er minar a pr ev alência d
e SIF e
m uma amost ra d e id osos da c om unida de
n = 53 (41) n = 75 (59)
12. M acuc o e t al. (2012) B razil, S ao
Paulo (n = 384)
72,3±5,8 cr oss-se ct io nal
n = 342
M/F
Ph
ysical F
railt
y and c
og nit iv e pr ofile D escr ip ti ve stat ist ics and fr eq ue ncy ; r elat iv e risk; anal ysis o f v ar ianc e, adj ust me nt meas ur es, lo gist ic r eg ressio n To e xamine the asso ciat io n b etw ee n fr ailt
y and c
og nit iv e func tio ning
n = 311 (91) n = 31 (9)
N
ot
es:
M = mean;
SD = standar
d d
ev
iat
io
n;
SF = fr
ail syndr
ome;
% = p
er
ce
ntag
e;
M = male;
F = f
emale T ab le 1. D escr ip ti ve c har ac te rist ics o f al l st udies inc lud
ed in q
uant itat iv e anal ysis f ol lo w
ing PRISMA guid
209
C
iência & S
aúd
e C
ole
tiv
a,
24(1):203-218,
2019
sional, categorical approach, based on the
evalu-ation of the five dimensions described above48. In
the assessment of the cognitive status, all selected
studies used the MMSE49 in the form of a
con-tinuous variable, describing the mean values and standard deviation, and comparing these values to the subgroup of the FS.
Only one study has clearly presented the
data in relation to gender38, being introduced
and subsequently analyzed in the meta-analy-sis as two independent studies, thus justifying a total of 13 entries in the statistical meta-anal-ysis. A total of eight studies analyzed the data without separation by gender, presenting values
only for the total sample19,25,26,49-53, which
deter-mines the shape of the meta-analysis to be car-ried out. A total of two studies were developed
only with samples of elderly men38,54, and three
were prepared with samples of elderly female
participants only18,55. Regarding the QA of the
studies, an average value of 94% was recorded.
Characteristics of participants
Regard to the total number of participants analyzed in the selected studies under this SRM, we identified a total of n = 26,935 elderly partic-ipants. From these, a total of 13,725 participants (51.0%) represent the sum of the pre-frail and frail individuals in the total of people evaluated, being 11,265 considered pre-frail and 2,460 frail. Considering the absolute and relative values of the sample (n = 13725), the pre-frail presented percentage values ranging from 32 to 94%, being
Figure 1. Flowchart of studies included following PRISMA guidelines.
Records identified through databases searching
n =1078
Potential records screened n = 124
First eligible manuscripts n = 45
First eligible manuscripts n = 17
Studies included in the quantitative analysis
n = 12
Excluded n = 05 Excluded
n = 28 Excluded
n = 79
Records excluded by reading title and abstract and replication
n = 9
Id
ent
ificat
io
n
Scr
ee
ning
Elig
ib
ilit
y
In
clu
de
210
Fur
ta
do GE
et al.
75% the mean value of the individuals in this cat-egory. In the subgroup of the frail, the amplitude values range from 6 to 68% of the sample, being 25% the mean value of individuals in this
cate-gory. The studies carried out in South Korea38,
Spain19 and Ireland55 are the ones with broader
samples (Table 2).
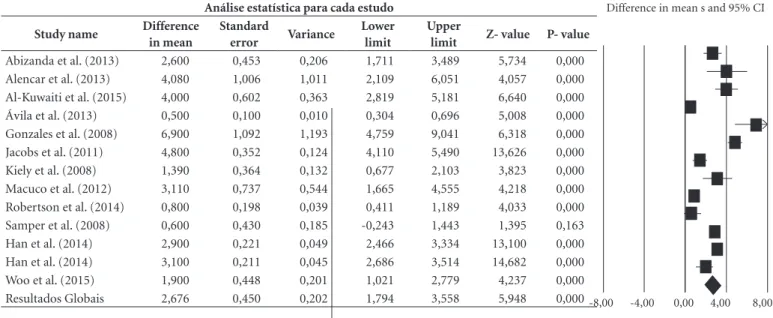
From the 12 studies included (13 entries) in this meta-analysis, they all started from the same research assumption, in which the elderly with classifications according to the FS (pre-frail ver-sus frail) differ in the assessment of their cogni-tive performance, having frail individuals’ lower cognitive performance in comparison to the pre-frail. The effect size is represented here by the dif-ference in means (Table 3).
Effect Size of the differences between groups
Regarding the central hypothesis of the pres-ent study, it was verified that the difference of averages found between the two subgroups of the FS for the evaluation of the DC was equal to 2,676, which means that the pre-frail had high-er mean values (2.7 points ) compared to frail subgroups. The confidence interval for the mean difference is 1.794 to 3.558, which means that the gross difference of means is within this range. On the other hand, this range does not include the difference of zero, which means that the true difference of averages is probably non-zero. The Z values obtained to test the null hypothesis, ac-cording to which the means difference is zero, showed a Z = 5.948, with the corresponding val-ue of p <0.001. In this way, we can reject the null hypothesis and affirm that the sample presented different DC levels in by FS subgroups, these dif-ferences being statistically significant.
Homogeneity of the effects
It is known that the magnitude of the ob-served effects may vary between studies, due to
sample error56. Thus, it was necessary to
deter-mine if the observed variation was located within the range attributed to the sampling error, which translates into an absence of evidence as to the variation of the true effects. To this, we deter-mined the value expected from the Q Cochran statistics, normally used as a significance test and we also tested the null hypothesis according to which all the studies involved in this meta-anal-ysis share a magnitude of common effects, being that any variation would result from the sam-pling error within the studies. If all studies share
the same magnitude of effects, the expected val-ue of Q will be equal to the degrees of freedom,
i.e., the number of studies minus 156. The value
obtained from Q is 361.762 with 12 degrees of freedom and with a value of p < 0.001. Thus, we can accept the alternative hypothesis, according to which the true magnitude of the effect varies from study to study.
The statistics of I2 corresponds to the ratio
of the real heterogeneity of the total variation of the observed effects, that is, it tells us what pro-portion (percentage) of the observed variance reflects the differences in the true magnitude of
the effect rather than in the error of the sample57.
In the current meta-analysis, the obtained value
of I2 is 96,683, which means that about 96.7% of
the variance on the observed effects reflects the
variance of the true effects. T2 corresponds to
the variance of the true effect sizes among stud-ies which, in the current study, depicts a value of
2.358. On the other hand, the value of T2, refers
to the standard deviation of the true magnitude of the effects, being in this meta-analysis equal to 1.536. Regarding the publication bias of integrat-ed studies in this SRM, we usintegrat-ed the visual inspec-tion of the funnel plot, which is the effect size of each study in relation to its standard error.
For the visual analysis of the graph, it is as-sumed that when there is no publication bias, the distribution of the studies should be symmetric around the magnitude of the effect of the true population and the graph becomes narrower as
the size of the sample increases58. Additionally,
the Egger intercept test was performed which is intended to test the null hypothesis according to which the intercept is equal to zero, in the popula-tion. In Figure 2, the intercept is 1.34143. 95% of the confidence interval (-3.18799, 5.87086), with t = 0,65184, gl = 11. The recommended value of p (2-tailed) is 0.52789. Thus, there is no statistical evidence of the existence of publication bias.
Discussion
A great number of studies use the FS construct
designed by Fried et al.2to evaluate the FS59-61.
Nevertheless, the literature contains over twenty different methods of assessing FS. However, there is some evidence that the multidimensional as-sessment provided by this construct seems to be more sensitive to detect the FS in the populations aged 60 years and over, as well as to establish as-sociations with mortality, morbidity and other
211
C
iência & S
aúd
e C
ole
tiv
a,
24(1):203-218,
2019
Table 2. Quality assessment of manuscript information by STROBE guidelines (n=12 studies and 13 inputs in
the metanalysis).
T
itle and abst
ract
Int
ro
d
uct
io
n (bac
kg
round r
at
io
nale)
Int
ro
d
uct
io
n (o
b
je
ct
iv
es)
M
etho
ds (stud
y d
esig
n)
M
etho
ds (se
tt
ing)
M
etho
ds (par
ticipants)
M
etho
ds (v
ar
iab
les)
M
etho
ds (r
isk o
f bias)
M
etho
ds (stud
y sample siz
e)
M
etho
ds (v
ar
iab
les)
M
etho
ds (q
uant
itat
iv
e v
ar
iab
les)
M
etho
ds (stat
ist
ical me
tho
ds)
R
es
ults (par
ticipants)
Author (year of publication) I II III IV V VI VII VIII IX X XI XII XIII
1. Abizanda et al. (2013)
1 1 1 1 1 1 1 0 1 1 1 1 1
2. Alencar et al. (2013)
0 1 1 1 0 1 1 0 1 1 1 1 1
3. Ávila- Funes et al. (2009)
1 1 1 1 1 1 1 1 1 1 1 1 1
4. Gonzalez Vaca et al. (2014)
1 1 1 1 1 1 1 1 1 1 1 1 1
5. Han et al. (2014)
1 1 1 1 1 1 1 1 1 1 1 1 1
5. Han et al. (2014)
1 1 1 1 1 1 1 1 1 1 1 1 1
6. Jacobs et al. (2011)
0 1 1 1 1 1 0 1 1 1 1 1 1
7. Kiely et al. (2011)
1 1 1 1 1 1 1 0 1 1 1 1 1
8. Robertson et al. (2014)
0 1 1 1 1 1 1 0 1 1 0 1 1
9. Samper-Tenent et al. (2008)
1 1 1 1 1 1 1 1 1 1 1 1 1
10. Woo et al. (2015)
1 1 1 1 1 1 1 0 1 1 1 1 1
11. Al-Kuwaiti et al. (2015)
0 1 1 1 1 1 1 0 1 1 1 1 1
12. Macuco et al. (2012
0 1 1 1 1 1 1 0 0 1 1 1 1
it continues
large38 or small samples62. In the final selection
stage of the study, studies were removed from the systematic review in which the change of evalua-tion criteria for each dimension was introduced. The QA studies that integrated the SRM show the scientific rigor of the researchers in this area. However, it is important to note that in the
orig-inal study2, the QA was reported systematically
and accurately, which may have influenced the replication, with high quality, of the studies in
other countries31.
212
Fur
ta
do GE
et al.
Table 2. Quality assessment of manuscript information by STROBE guidelines (n=12 studies and 13 inputs in
the metanalysis).
Results (descrip
tiv
e da
ta)
Results (out
comes da
ta)
Results (main r
esults)
Results (other analy
sis)
Discussion (K
ey r
esults)
Discussio
n (limitat
io
ns)
Discussio
n (I
nt
er
pr
etat
io
n)
Discussio
n (Ge
ne
ralisabilit
y)
F
unding/K
no
w
le
gdme
nts
T
otal int
ens
T
otal P
er
ce
ntag
e
Author (year of publication) XIV XV XVI XVII XVIII XIX XX XXI XXII 22 100%
1. Abizanda et al. (2013)
1 1 1 1 1 1 1 1 1 21 95%
2. Alencar et al. (2013)
1 1 1 1 1 1 1 1 1 19 86%
3. Ávila- Funes et al. (2009)
1 1 1 1 1 1 1 1 1 22 100%
4. Gonzalez Vaca et al. (2014)
1 1 1 1 1 1 1 1 1 22 100%
5. Han et al. (2014)
1 1 1 1 1 1 1 1 1 22 100%
5. Han et al. (2014)
1 1 1 1 1 1 1 1 1 22 100%
6. Jacobs et al. (2011)
1 1 1 1 1 1 1 1 1 20 91%
7. Kiely et al. (2011)
1 1 1 1 1 1 1 1 1 21 95%
8. Robertson et al. (2014)
1 1 1 1 1 1 1 1 1 19 86%
9. Samper-Tenent et al. (2008)
1 1 1 0 1 1 1 1 1 21 95%
10. Woo et al. (2015)
1 1 1 1 1 1 1 1 1 21 95%
11. Al-Kuwaiti et al. (2015)
1 1 1 1 1 1 1 1 1 20 91%
12. Macuco et al. (2012
1 1 1 1 1 1 1 1 1 19 86%
Mean of total percentage 94%
these studies explicitly related the FS to the
cog-nitive performance18,55. However, this seems to be
the first SRM that sought to test the magnitude of the effect of the differences between the groups of pre-frail and frail. On the other hand, a very
recent SRM carried out by Chang and Lin9, also
213
Ciência & S aúde C
oleti va, 24(1):203-218, 2019
Table 3. Studies summary of mean differences in cognitive status on pre-frail (favour A) and frail (favour B) groups comparison.
Análise estatística para cada estudo
Study name Difference in mean
Standard
error Variance
Lower limit
Upper
limit Z- value P- value
Abizanda et al. (2013) 2,600 0,453 0,206 1,711 3,489 5,734 0,000
Alencar et al. (2013) 4,080 1,006 1,011 2,109 6,051 4,057 0,000
Al-Kuwaiti et al. (2015) 4,000 0,602 0,363 2,819 5,181 6,640 0,000
Ávila et al. (2013) 0,500 0,100 0,010 0,304 0,696 5,008 0,000
Gonzales et al. (2008) 6,900 1,092 1,193 4,759 9,041 6,318 0,000
Jacobs et al. (2011) 4,800 0,352 0,124 4,110 5,490 13,626 0,000
Kiely et al. (2008) 1,390 0,364 0,132 0,677 2,103 3,823 0,000
Macuco et al. (2012) 3,110 0,737 0,544 1,665 4,555 4,218 0,000
Robertson et al. (2014) 0,800 0,198 0,039 0,411 1,189 4,033 0,000
Samper et al. (2008) 0,600 0,430 0,185 -0,243 1,443 1,395 0,163
Han et al. (2014) 2,900 0,221 0,049 2,466 3,334 13,100 0,000
Han et al. (2014) 3,100 0,211 0,045 2,686 3,514 14,682 0,000
Woo et al. (2015) 1,900 0,448 0,201 1,021 2,779 4,237 0,000
Resultados Globais 2,676 0,450 0,202 1,794 3,558 5,948 0,000-8,00 -4,00 0,00 4,00 8,00
214
Fur
ta
do GE
et al.
The results found in this study corroborate with the literature, it being increasingly evident that the FS is strongly related to cognitive
sta-tus22,26. The present study makes it more evident
that the pre-frail and frail groups, respectively, have a tendency to an imminent risk of suffering from more severe cognitive impairments, when the FS is detected. The geographic distribution and diversity in the countries involved in the study of this issue show that there is a global con-cern about the phenomenon of the FS in adverse
populations25,50,52, accompanied by an increasing
interest in terms of research, as well as evidence that this pattern occurs in countries on several continents. Currently, the term ‘cognitive frailty’ associated with the concept of disorder or MCI appears, which shows a growing interest in the search for other explanations for this phenom-enon63.
The consideration of data from non-frail individuals under this SRM as the first lim-itation of this study. The participants from the group of non-frail showed average values below 24.0 points, i.e., a score that, according to the cut-off values of the MMSE, indicates the existence
of an MCI18,21. In this sense, it is reinforced that
overall, non-frail individuals have a ‘preserved’ cognitive status. Regarding gender differences, it is valid to indicate that the literature points to a
trend similar to the FS for both genders38, with
earlier death for men, due to a higher incidence of metabolic diseases when compared to older women. However, in this study, it was not possi-ble to further explore these differences, since only one of the studies presented analyses by gender and most samples investigated only females.
Thus, we can infer that cognition, as well as frailty, can appear as potential predictors of ear-ly mortality in the populations aged 60 and over, besides pointing out that the evaluation of the FS cannot be dissociated from the assessment of the
cognitive function54,64,65. Comparing a pre-frail
population pool with a frail population sample, the poor cognitive function associated with the FS is a likely clinical outcome in these
popula-tions which should be assessed27.
Conclusion
By analyzing the magnitude of the effect in the mean difference of the studies included in this SRM, we found a low cognitive function associ-ated with the FS, i.e., we identified this as a prob-able clinical outcome, with the occurrence of a decrease in cognitive performance as the elder-ly progress from a pre-condition of frailty to a frail condition. Therefore, any strategy or public health policy that aims to mitigate or reverse the incidence of this condition should take into
ac-Figure 2. Funnel plot and Egger’s test.
-6 -5 -4 -3 -2 -1 0 1 2 3 4 5 6 7
-7 2,0 1,5 1,0 0,5 0,0
S
tandar
d e
rr
o
r
Difference in means
215
C
iência & S
aúd
e C
ole
tiv
a,
24(1):203-218,
2019
count that these two outcomes seem to have sim-ilar temporal trajectories, caused in a population phenotype to be investigated with due attention.
References
1. García-García FJ, Larrión Zugasti JL, Rodríguez Mañas L. [Frailty: a phenotype under review]. Gac Sanit [In-ternet]. 2011 Dec [cited 2014 Sep 27];25(Supl. 2):51-58. Available from: http://www.ncbi.nlm.nih.gov/ pubmed/22033007
2. Fried LP, Tangen CM, Walston J, Newman AB, Hirsch C, Gottdiener J, Seeman T, Racy R, Kop WJ, Burke G, Mc Burnie M. Frailty in older adults: evidence for a phenotype. J Gerontol A Biol Sci Med Sci [Internet]. 2001 Mar;56(3):M146-M156. Available from: http:// www.ncbi.nlm.nih.gov/pubmed/11253156
3. Clegg A, Young J, Iliffe S, Rikkert MO, Rockwood K. Frailty in elderly people. Lancet [Internet]. 2013 Mar 2 [cited 2014 Jul 14];381(9868):752-762. Available from: http://www.ncbi.nlm.nih.gov/pubmed/23395245 4. Gruver AL, Hudson LL, Sempowski GD.
Immunose-nescence of ageing. J Pathol [Internet]. 2007 Jan [cited 2014 Dec 26];211(2):144-56. Available from: http:// www.pubmedcentral.nih.gov/articlerender.fcgi?ar-tid=1931833&tool=pmcentrez&rendertype=abstract 5. Yao X, Li H, Leng SX. Inflammation and immune
sys-tem alterations in frailty. Clin Geriatr Med [Internet]. 2011 Feb [cited 2015 Apr 23];27(1):79-87. Available from: http://www.pubmedcentral.nih.gov/articlerend er.fcgi?artid=3011971&tool=pmcentrez&rendertype =abstract
6. Nelson ME, Rejeski WJ, Blair SN, Duncan PW, Judge JO, King AC, Macera C, Castaneda-Sceppa, C. Phys-ical activity and public health in older adults: rec-ommendation from the American College of Sports Medicine and the American Heart Association. Med Sci Sports Exerc [Internet]. 2007 Aug [cited 2014 Aug 1];39(8):1435-1445. Available from: http://www.ncbi. nlm.nih.gov/pubmed/17762378
7. Morley JE, Vellas B, van Kan GA, Anker SD, Bau-er JM, BBau-ernabei R. Frailty consensus: a call to ac-tion. J Am Med Dir Assoc [Internet]. 2013 Jun [cited 2015 Jan 8];14(6):392-397. Available from: http:// www.pubmedcentral.nih.gov/articlerender.fcgi?ar-tid=4084863&tool=pmcentrez&rendertype=abstract 8. Romero-Ortuno R. The Frailty Instrument for
pri-mary care of the Survey of Health, Ageing and Re-tirement in Europe predicts mortality similarly to a frailty index based on comprehensive geriatric assess-ment. Geriatr Gerontol Int [Internet]. 2013 Apr [cited 2015 Feb 17];13(2):497-504. Available from: http:// www.pubmedcentral.nih.gov/articlerender.fcgi?ar-tid=3530023&tool=pmcentrez&rendertype=abstract Collaborations
GE Furtado participated in all stages of the man-uscript. R Letieri assisted in the final meta-search. E Hogervorst contributed with its expertise in the topic of discussion. AB Teixeira made substantial contributions in the framework of the proposed theme. JP Ferreira assisted in methodological structure and interpretation of the results.
Acknowledgement
216
Fur
ta
do GE
et al.
9. Chang S-F, Lin P-L. Frail phenotype and mortality prediction: A systematic review and meta-analysis of prospective cohort studies. Int J Nurs Stud [Internet]. 2015; 52(8):1362-1374. Available from: http://linking-hub.elsevier.com/retrieve/pii/S0020748915001066 10. Robinson TN, Eiseman B, Wallace JI, Church SD,
Mc-Fann KK, Pfister SM. Redefining geriatric preopera-tive assessment using frailty, disability and co-mor-bidity. Ann Surg [Internet]. 2009 Sep [cited 2015 Jan 5];250(3):449-455. Available from: http://www.ncbi. nlm.nih.gov/pubmed/19730176
11. Schuurmans H, Steverink N, Lindenberg S, Frieswijk N, Slaets JPJ. Old or frail: what tells us more? J Gerontol A Biol Sci Med Sci [Internet]. 2004 Sep [cited 2015 Feb 25];59(9):M962-M965. Available from: http://www. ncbi.nlm.nih.gov/pubmed/15472162
12. Gobbens RJJ, Luijkx KG, van Assen MALM. Explaining quality of life of older people in the Netherlands using a multidimensional assessment of frailty. Qual Life Res
[Internet]. 2013 Oct [cited 2015 Feb 17];22(8):2051-2061. Available from: http://www.ncbi.nlm.nih.gov/ pubmed/23274572
13. Kim M-J, Yabushita N, Kim M-K, Nemoto M, Seino S, Tanaka K. Mobility performance tests for discriminat-ing high risk of frailty in community-dwelldiscriminat-ing older women. Arch Gerontol Geriatr [Internet]. 2010 Jan [cit-ed 2015 Feb 2];51(2):192-198. Available from: http:// www.ncbi.nlm.nih.gov/pubmed/19939477
14. Cho BL, Scarpace D, Alexander NB. Tests of stepping as indicators of mobility, balance, and fall risk in bal-ance-impaired older adults. J Am Geriatr Soc 2004; 52(7):1168-1173.
15. Greene BR, Doheny EP, O’Halloran A, Anne Kenny R. Frailty status can be accurately assessed using inertial sensors and the TUG test. Age Ageing [Internet]. 2014 May [cited 2015 Jan 10];43(3):406-411. Available from: http://www.ncbi.nlm.nih.gov/pubmed/24212918 16. Coelho FGDM, Gobbi S, Andreatto CAA, Corazza
DI, Pedroso RV, Santos-Galduróz RF. Physical ex-ercise modulates peripheral levels of brain-derived neurotrophic factor (BDNF): a systematic review of experimental studies in the elderly. Arch Gerontol Geriatr [Internet]. 2013 [cited 2014 Sep 4];56(1):10-15. Available from: http://www.ncbi.nlm.nih.gov/pub med/22749404
17. Darvin K, Randolph A, Ovalles S, Halade D, Breed-ing L, Richardson A, Espinoza, S. Plasma protein biomarkers of the geriatric syndrome of frailty. J Gerontol A Biol Sci Med Sci [Internet]. 2014 Feb [cit-ed 2015 Feb 17];69(2):182-186. Available from: http:// www.pubmedcentral.nih.gov/articlerender.fcgi?ar-tid=4038243&tool=pmcentrez&rendertype=abstract 18. Alencar MA, Dias JMD, Figueiredo LC, Dias RC.
Frailty and cognitive impairment among commu-nity-dwelling elderly. Arq Neuropsiquiatr [Internet]. 2013 Jun [cited 2015 Feb 9];71(6):362-367. Available from: http://www.scielo.br/scielo.php?script=sci_art- text&pid=S0004-282X2013000600362&lng=en&n-rm=iso&tlng=en
19. Avila-Funes JA, Amieva H, Barberger-Gateau P, Le Goff M, Raoux N, Ritchie K, Carrière I, Tavernier B, Tzourio C, Gutiérrez-Robledo L, Dartigues J. Cogni-tive impairment improves the predicCogni-tive validity of the phenotype of frailty for adverse health outcomes: the three-city study. J Am Geriatr Soc [Internet]. 2009 Mar [cited 2015 Feb 1];57(3):453-461. Available from: http://www.ncbi.nlm.nih.gov/pubmed/19245415 20. Nóbrega PVN, Maciel ACC, Almeida Holanda CM,
Oliveira Guerra R, Araújo JF. Sleep and frailty syndro-me in elderly residents of long-stay institutions: a cros-s-sectional study. Geriatr Gerontol Int [Internet]. 2014 Jul [cited 2015 Jul 26];14(3):605-612. Available from: http://www.ncbi.nlm.nih.gov/pubmed/24020502 21. de la Rica-Escuín M, González-Vaca J, Varela-Pérez
R, Arjonilla-García MD, Silva-Iglesias M, Oliver-Car-bonell JL. Frailty and mortality or incident disability in institutionalized older adults: the FINAL study. Matu-ritas [Internet]. 2014 Aug [cited 2015 Jul 7];78(4):329-334. Available from: http://www.ncbi.nlm.nih.gov/ pubmed/24929996
22. Faria CA, Lourenço RA, Ribeiro PC, Lopes CS. De-sempenho cognitivo e fragilidade em idosos clientes de operadora de saúde. Rev Saude Publica [Internet]. 2013 Oct [cited 2015 Jun 2];47(5):923-930. Available from: http://www.scielosp.org/scielo.php?script=sci_ arttext&pid=S0034-89102013000700923&lng=en&n-rm=iso&tlng=pt
23. Robertson DA, Savva GM, Kenny RA. Frailty and cognitive impairment—A review of the evidence and causal mechanisms. Ageing Res Rev [Internet]. 2013 Sep [cited 2016 Aug 18];12(4):840-851. Avail-able from: http://linkinghub.elsevier.com/retrieve/pii/ S1568163713000482
24. Gray SL, Anderson ML, Hubbard RA, Lacroix A, Crane PK, McCormick W, Bowen JD, McCurry S, M, Larson EB. Frailty and incident dementia. Journals Gerontol - Ser A Biol Sci Med Sci 2013;68(9):1083-1090. 25. Woo J, Yu R, Wong M, Yeung F, Wong M, Lum C. Frailty
Screening in the Community Using the FRAIL Scale. J Am Med Dir Assoc [Internet]. 2015 May 1 [cited 2015 May 15];16(5):412-419. Available from: http://www. ncbi.nlm.nih.gov/pubmed/25732832
26. Samper-Ternent R, Al Snih S, Raji MA, Markides KS, Ottenbacher KJ. Relationship between frailty and cognitive decline in older Mexican Americans.
J Am Geriatr Soc [Internet]. 2008 Oct [cited 2015 Jul 27];56(10):1845-1852. Available from: http:// www.pubmedcentral.nih.gov/articlerender.fcgi?ar-tid=2628807&tool=pmcentrez&rendertype=abstract 27. Ávila-Funes JA, Pina-Escudero SD, Aguilar-Navarro
217
C
iência & S
aúd
e C
ole
tiv
a,
24(1):203-218,
2019
28. Di Bari M, Profili F, Bandinelli S, Salvioni A, Mossel-lo E, Corridori C. Screening for frailty in older adults using a postal questionnaire: rationale, methods, and instruments validation of the INTER-FRAIL study. J Am Geriatr Soc [Internet]. 2014 Oct [cited 2015 Feb 16];62(10):1933-1937. Available from: http://www. ncbi.nlm.nih.gov/pubmed/25283959
29. Jones D, Song X, Mitnitski A, Rockwood K. Evaluation of a frailty index based on a comprehensive geriatric assessment in a population based study of elderly Ca-nadians. Aging Clin Exp Res [Internet]. 2005 Dec [cit-ed 2015 Feb 17];17(6):465-471. Available from: http:// www.ncbi.nlm.nih.gov/pubmed/16485864
30. Mitnitski A, Fallah N, Rockwood MRH, Rockwood K. Transitions in cognitive status in relation to frailty in older adults: a comparison of three frailty measures. J Nutr Health Aging [Internet]. 2011 Dec [cited 2015 Feb 16];15(10):863-867. Available from: http://www.ncbi. nlm.nih.gov/pubmed/22159774
31. Brigola AG, Rossetti ES, Santos BR dos, Neri AL, Zazzetta MS, Inouye K, Pavarini SC. Relationship between cognition and frailty in elderly: A systemat-ic review. Dement Neuropsychol [Internet]. 2015 Jun [cited 2016 Apr 26]; 9(2):110-119. Available from: http://www.scielo.br/scielo.php?script=sci_arttex- t&pid=S1980-57642015000200110&lng=en&n-rm=iso&tlng=en
32. Huang M, Névéol A, Lu Z. Recommending MeSH terms for annotating biomedical articles. J Am Med Inform As-soc [Internet]. 2011 Jan [cited 2015 May 22];18(5):660-667. Available from: http://www.pubmedcentral.nih. gov/articlerender.fcgi?artid=3168302&tool=pmcen-trez&rendertype=abstract
33. Mungas D. In-office mental status testing: a practical guide. Geriatrics [Internet]. 1991 Jul [cited 2014 Dec 21];46(7):54-58,63,66. Available from: http://www. ncbi.nlm.nih.gov/pubmed/2060803
34. Bouillon K, Sabia S, Jokela M, Gale CR, Singh-Ma-noux A, Shipley MJ, Kivimäki M, Batty D. Validating a widely used measure of frailty: are all sub-compo-nents necessary? Evidence from the Whitehall II co-hort study. Age (Dordr) [Internet]. 2013 Aug [cited 2015 Feb 17];35(4):1457-1465. Available from: http:// www.pubmedcentral.nih.gov/articlerender.fcgi?ar-tid=3705104&tool=pmcentrez&rendertype=abstract 35. van Kan GA, Rolland Y, Houles M, Gillette-Guyonnet
S, Soto M, Vellas B. The assessment of frailty in older adults. Clin Geriatr Med 2010; 26(2):275-286. 36. Wilson CM, Kostsuca SR, Boura JA. Utilization of a
5-Meter Walk Test in Evaluating Self-selected Gait Speed during Preoperative Screening of Patients Scheduled for Cardiac Surgery. Cardiopulm Phys Ther J [Internet]. 2013 Sep [cited 2015 Jul 24];24(3):36-43. Available from: http://www.pubmedcentral.nih.gov/ articlerender.fcgi?artid=3751713&tool=pmcentrez &rendertype=abstract
37. Sasaki H, Kasagi F, Yamada M, Fujita S. Grip strength predicts cause-specific mortality in middle-aged and elderly persons. Am J Med [Internet]. 2007 Apr [cited 2015 Jan 6];120(4):337-342. Available from: http:// www.ncbi.nlm.nih.gov/pubmed/17398228
38. Han ES, Lee Y, Kim J. Association of cognitive impair-ment with frailty in community-dwelling older adults.
Int Psychogeriatr [Internet]. 2014 Jan [cited 2015 Jul 27];26(1):155-163. Available from: http://www.ncbi. nlm.nih.gov/pubmed/24153029
39. Folstein MF, Folstein SE, McHugh PR. ‘Mini-men-tal state’. A practical method for grading the cogni-tive state of patients for the clinician. J Psychiatr Res
1975;12(3):189-198.
40. Melo DM, Barbosa AJG. [Use of the Mini-Mental State Examination in research on the elderly in Brazil: a systematic review]. Cien Saude Colet [Internet]. 2015 Dec [cited 2016 Jan 4];20(12):3865-3876. Available from: http://www.scielo.br/scielo.php?script=sci_art- text&pid=S1413-81232015001203865&lng=en&n-rm=iso&tlng=pt
41. Panic N, Leoncini E, De Belvis G, Ricciardi W, Boccia S. Evaluation of the endorsement of the preferred re-porting items for systematic reviews and meta-anal-ysis (PRISMA) statement on the quality of published systematic review and meta-analyses. PLoS ONE 2013; 8(12)e83138.
42. Liberati A, Altman DG, Tetzlaff J, Mulrow C, Gøtzsche PC, Ioannidis JPA. The PRISMA statement for report-ing systematic reviews and meta-analyses of studies that evaluate health care interventions: explanation and elaboration. PLoS Med [Internet]. 2009 Jul 21 [cit-ed 2014 Jul 15];6(7):e1000100. Available from: http:// journals.plos.org/plosmedicine/article?id=10.1371/ journal.pmed.1000100
43. Malta M, Cardoso LO, Bastos FI, Magnanini MMF, Sil-va CMFP. IniciatiSil-va STROBE: subsídios para a comu-nicação de estudos observacionais. Rev Saude Publica
2010; 44(3):559-565.
44. Abeysena C. Strengthening the reporting of observa-tional studies in epidemiology (STROBE) statement: New guidelines for reporting observational studies. J Coll Community Physicians Sri Lanka 2011; 13(2):20-22.
45. Batterham AM, Hopkins WG. Making meaningful inferences about magnitudes. Int J Sports Physiol Per-form [Internet]. 2006 Mar [cited 2014 Dec 25];1(1):50-57. Available from: http://www.ncbi.nlm.nih.gov/ pubmed/19114737
46. Egger M, Davey Smith G, Schneider M, Minder C. Bias in meta-analysis detected by a simple, graph-ical test. BMJ [Internet]. 1997 Sep 13 [cited 2015 Jan 2];315(7109):629-634. Available from: http:// www.pubmedcentral.nih.gov/articlerender.fcgi?ar-tid=2127453&tool=pmcentrez&rendertype=abstract 47. Bax L, Yu L-M, Ikeda N, Moons KGM. A systematic
comparison of software dedicated to meta-analysis of causal studies. BMC Med Res Methodol [Internet]. 2007 Jan [cited 2016 Apr 27];7:40. Available from: http://www.pubmedcentral.nih.gov/articlerender.fc- gi?artid=2048970&tool=pmcentrez&rendertype=ab-stract
218
Fur
ta
do GE
et al.
49. Macuco CRM, Batistoni SST, Lopes A, Cachioni M, da Silva Falcão DV, Neri AL, Yassuda, MS . Mini-Mental State Examination performance in frail, pre-frail, and non-frail community dwelling older adults in Ermel-ino Matarazzo, São Paulo, Brazil. Int Psychogeriatr
[Internet]. 2012 Nov [cited 2016 Apr 26];24(11):1725-1731. Available from: http://www.ncbi.nlm.nih.gov/ pubmed/22652040
50. Abizanda P, Romero L, Sánchez-Jurado PM, Martínez-Reig M, Gómez-Arnedo L, Alfonso SA. Frailty and mortality, disability and mobility loss in a Spanish cohort of older adults: the FRADEA study. Maturi-tas [Internet]. 2013 Jan [cited 2015 Jul 27];74(1):54-60. Available from: http://www.ncbi.nlm.nih.gov/ pubmed/23107816
51. González-Vaca J, de la Rica-Escuín M, Silva-Iglesias M, Arjonilla-García MD, Varela-Pérez R, Oliver-Car-bonell JL, Oliver, C. Frailty in INstitutionalized older adults from ALbacete. The FINAL Study: rationale, design, methodology, prevalence and attributes. Matu-ritas [Internet]. 2014 Jan [cited 2015 Jul 7];77(1):78-84. Available from: http://www.ncbi.nlm.nih.gov/ pubmed/24189222
52. Kiely DK, Cupples LA, Lipsitz LA. Validation and com-parison of two frailty indexes: The MOBILIZE Boston Study. J Am Geriatr Soc [Internet]. 2009 Sep [cited 2015 Jan 28];57(9):1532-1539. Available from: http:// www.pubmedcentral.nih.gov/articlerender.fcgi?ar-tid=2792729&tool=pmcentrez&rendertype=abstract 53. Al-Kuwaiti SJ, Aziz F, Blair I. Frailty in
Communi-ty-Dwelling Older People in Abu Dhabi, United Arab Emirates: A Cross-Sectional Study. Front public Heal
[Internet]. 2015 Jan [cited 2016 Apr 26];3:248. Avail-able from: http://www.pubmedcentral.nih.gov/arti- clerender.fcgi?artid=4630498&tool=pmcentrez&ren-dertype=abstract
54. Jacobs JM, Cohen A, Ein-Mor E, Maaravi Y, Stessman J. Frailty, cognitive impairment and mortality among the oldest old. J Nutr Health Aging [Internet]. 2011 Aug [cited 2015 Jul 27];15(8):678-682. Available from: http://www.ncbi.nlm.nih.gov/pubmed/21968864 55. Robertson DA, Savva GM, Coen RF, Kenny R-A.
Cog-nitive function in the prefrailty and frailty syndrome.
J Am Geriatr Soc [Internet]. 2014 Nov [cited 2015 Jul 27];62(11):2118-24. Available from: http://www.ncbi. nlm.nih.gov/pubmed/25370593
56. Kulinskaya E, Dollinger MB, Bjørkestøl K. Testing for Homogeneity in Meta-Analysis I. The One-Parame-ter Case: Standardized Mean Difference. Biometrics
[Internet]. 2011 Mar [cited 2017 Feb 9];67(1):203-212. Available from: http://www.ncbi.nlm.nih.gov/ pubmed/20528863
57. Dinnes J, Deeks J, Kirby J, Roderick P. A methodologi-cal review of how heterogeneity has been examined in systematic reviews of diagnostic test accuracy. Health Technol Assess [Internet]. 2005 Mar [cited 2016 May 22];9(12):1-113, iii. Available from: http://www.ncbi. nlm.nih.gov/pubmed/15774235
58. Sterne JA, Egger M, Smith GD. Systematic reviews in health care: Investigating and dealing with publication and other biases in meta-analysis. BMJ [Internet]. 2001 Jul 14 [cited 2015 Jul 28];323(7304):101-105. Available from: http://www.pubmedcentral.nih.gov/articleren-der.fcgi?artid=1120714&tool=pmcentrez&rendertype =abstract
59. Drubbel I, Numans ME, Kranenburg G, Bleijenberg N, de Wit NJ, Schuurmans MJ. Screening for frailty in primary care: a systematic review of the psychometric properties of the frailty index in community-dwelling older people. BMC Geriatr [Internet]. 2014;14(1):27. Available from: http://www.biomedcentral.com/1471-2318/14/27.
60. Zaslavsky O, Thompson H, Demiris G. The Role of Emerging Information Technologies in Frailty Assess-ment. Res Gerontol Nurs [Internet]. 2012 Jul 1 [cited 2015 Feb 17];5(3):216-28. Available from: http://www. ncbi.nlm.nih.gov/pubmed/22533942
61. Wells JL, Seabrook JA, Stolee P, Borrie MJ, Knoefel F. State of the art in geriatric rehabilitation. Part I: review of frailty and comprehensive geriatric assessment. Arch Phys Med Rehabil [Internet]. 2003 Jun [cited 2015 Jan 29];84(6):890-897. Available from: http://www.ncbi. nlm.nih.gov/pubmed/12808544
62. Abizanda P, Romero L, Sánchez-Jurado PM, Martínez-Reig M, Alfonso-Silguero SA, Rodríguez-Mañas L. Age, frailty, disability, institutionalization, multimorbidity or comorbidity. Which are the main targets in older adults? J Nutr Health Aging [Internet]. 2014 Jan [cit-ed 2015 Jul 26];18(6):622-627. Available from: http:// www.ncbi.nlm.nih.gov/pubmed/24950154
63. Panza F, Seripa D, Solfrizzi V, Tortelli R, Greco A, Pilot-to A. Targeting Cognitive Frailty: Clinical and Neuro-biological Roadmap for a Single Complex Phenotype.
J Alzheimers Dis [Internet]. 2015 Jan [cited 2016 Apr 29];47(4):793-813. Available from: http://www.ncbi. nlm.nih.gov/pubmed/26401761
64. Cano C, Samper-Ternent R, Al Snih S, Markides K, Ottenbacher KJ. Frailty and cognitive impairment as predictors of mortality in older Mexican Ameri-cans. J Nutr Health Aging [Internet]. 2012 Feb [cited 2015 Jul 27];16(2):142-147. Available from: http:// www.pubmedcentral.nih.gov/articlerender.fcgi?ar-tid=3281306&tool=pmcentrez&rendertype=abstract 65. Mohler MJ, Fain MJ, Wertheimer AM, Najafi B,
Niko-lich-Žugich J. The Frailty syndrome: clinical measure-ments and basic underpinnings in humans and ani-mals. Exp Gerontol [Internet]. 2014 Jun [cited 2015 Feb 17];54:6-13. Available from: http://www.ncbi.nlm.nih. gov/pubmed/24503059
Article submitted 22/11/2016 Approved 02/06/2017
Final version submitted 04/06/2017
This is an Open Access article distributed under the terms of the Creative Commons Attribution License BY