Where Should I Send It? Optimizing the
Submission Decision Process
Santiago Salinas1*¤, Stephan B. Munch2
1Center for Stock Assessment Research, University of California Santa Cruz, Santa Cruz, California, United States of America,2Southwest Fisheries Science Center, National Oceanic and Atmospheric
Administration, Santa Cruz, California, United States of America
¤. Current address: Department of Biological Sciences, University of the Pacific, Stockton, California, United States of America
Abstract
How do scientists decide where to submit manuscripts? Many factors influence this deci-sion, including prestige, acceptance probability, turnaround time, target audience, fit, and impact factor. Here, we present a framework for evaluating where to submit a manuscript based on the theory of Markov decision processes. We derive two models, one in which an author is trying to optimally maximize citations and another in which that goal is balanced by either minimizing the number of resubmissions or the total time in review. We parameterize the models with data on acceptance probability, submission-to-decision times, and impact factors for 61 ecology journals. We find that submission sequences beginning withEcology Letters,Ecological Monographs, orPLOS ONEcould be optimal depending on the impor-tance given to time to accepimpor-tance or number of resubmissions. This analysis provides some guidance on where to submit a manuscript given the individual-specific values as-signed to these disparate objectives.
Introduction
The question of where to submit a finished manuscript is an inescapable part of life as a scien-tist. Yet, it has received little attention beyond cursory advice in“how to be a scientist”guides. Many factors can drive this decision, including journal prestige, likelihood of acceptance, turn-around time, target audience, and impact factor (IF).
Journal impact factors (IF) are now widely used by universities and agencies to evaluate per-formance and make hiring and funding decisions [1,2]. Moreover—and despite the many ar-guments against the IF (e.g., [3–5])—it is undeniable that scientists are well aware of, and make submission decisions based on, them. 85.6% of 1,250 ecologists indicated that a high journal IF is a‘very important’to‘important’criterion in selecting where to send manuscripts [6], data on resubmission patterns suggest a flow from higher to lower IF journals [7], and a survey of Canadian researchers found that journal prestige and impact factor greatly outranked other criteria [8].
a11111
OPEN ACCESS
Citation:Salinas S, Munch SB (2015) Where Should I Send It? Optimizing the Submission Decision Pro-cess. PLoS ONE 10(1): e0115451. doi:10.1371/jour-nal.pone.0115451
Academic Editor:Renaud Lambiotte, University of Namur, BELGIUM
Received:June 5, 2014
Accepted:November 24, 2014
Published:January 23, 2015
Copyright:This is an open access article, free of all copyright, and may be freely reproduced, distributed, transmitted, modified, built upon, or otherwise used by anyone for any lawful purpose. The work is made available under theCreative Commons CC0public domain dedication.
Data Availability Statement:All relevant data are within the paper and its Supporting Information files.
Funding:The authors have no support or funding to report.
Although a poor predictor of the ultimate success of any particular paper [9], the journal impact factor offers a concise summary of the expected citation rate for papers published there-in. Assuming that scientists would like to have their publications cited, the IF therefore is a po-tentially useful criterion in deciding where to send their work (roughly ¼ of all natural science and engineering articles go uncited in the first 5 years of publication [10]). Thus, a researcher seeking to maximize citation counts might choose to submit to the journal with the highest IF and then work down the IF list as the manuscript is rejected. From a decision theoretic point of view, this is known as a‘myopic policy’; it ignores the value of subsequent actions and opportu-nity costs (e.g., what happens if the paper is rejected). In fact, many other factors are relevant to this decision, including likelihood of acceptance, the time to publication, and the appropriate-ness of the target audience. Here, we present a simple framework for evaluating where to sub-mit a manuscript based on the theory of Markov decision processes [11] and apply it to journals publishing ecological research. We also use this framework to evaluate trade-offs be-tween citations and competing concerns such as the time to publication and number of revi-sions. We compare the follow-the-IF strategy to the one we obtain and arrive at some surprising conclusions.
Methods
We approach this problem in two ways. First, we derive the optimal submission sequence for a scientist attempting to maximize the expected number of citations obtained over some finite period. Recognizing that revising and resubmitting a manuscript multiple times is both time-consuming and demoralizing, in our second approach we solve the dual-objective problem posed by balancing the trade-off between the expected number of citations and either the ex-pected number of revisions or the time to publication.
Model 1. Maximizing citations
In this first model, we assume that a scientist is trying to maximize the expected number of ci-tations his/her manuscript receives over a finite time interval ending at timeT. For example, Tmight be the time to tenure for a new professor, the time to retirement for a midcareer scien-tist, or the researcher’s life expectancy. LetCdenote the expected number of citations accruing to a manuscript over [0,T] given the sequence of journals to which the paper is submitted.
If the paper is certain to be accepted by the first journal, thenCis simply the product of the expected citation rate for papers in that journal and the time remaining once the publication is in print. The expected number of citations per year is approximately the impact factor of a journal, since the IF is a“measure of the frequency with which the‘average article’in a journal has been cited”over a 1-yr period [12].
However, it is typically not certain that a publication will be accepted. Thus, we must ac-count for the possibility of rejection, followed by a round of reformatting and revision, followed by submission to the next journal, etc. During this time, there is, of course, some chance that an analogous publication will be produced by a competing author, i.e., you get scooped. For simplicity, we assume that a publication that has been scooped has negligible value. Given these criteria, the expected number of citations,C, is
C¼q 1XN
j¼1
a jlj½T
Xj
k¼1
t
j ðj 1ÞtR
þYj 1
k¼1ð 1 a
kÞð1 sÞ t
kþtR ð1Þ
whereα
jis the acceptance rate of journalj,λjis the expected number of citations for a paper in that journal,tjis the time (days) from submission to publication,tR(days) is the revision time,
details). The term in square brackets is the time remaining over which citations can be accumu-lated with the superscript + indicating that negative values are replaced by 0. The product term indicates the probability of having neither been accepted nor scooped prior to submission to the jthjournal and the quantityqis the normalization constant. Here, we have assumed that the average rate at which citations are accumulated is constant and is roughly equal to the jour-nal’s impact factor.
The goal is to maximizeCover possible submission sequences. As detailed inS1 Model, the criteria for choosing to start with journaljover journalkis
a
jljfT tj ð1 akÞð1 sÞ tRþtka
klkðT tkÞ þ ð1 akÞð1 sÞ
tRþtka
jljðT tk tR tjÞg
a
klkfT tk ð1 ajÞð1 sÞ tRþtja
jljðT tjÞ þ ð1 ajÞð1 sÞ tRþtja
klkðT tj tR tkÞg ð2Þ
Criterion (2) is applied to all pairs of journals and the optimal journal is the one that dominates the greatest number of other journals. Note that this criterion merely establishes which journal to visitfirst. To determine an optimal submission schedule, one starts with T, evaluates all jour-nals,finds the best journal,j, then reducesTbytj+tRand starts over withjremoved from
the list.
This ranking scheme is dependent on the set of journals being evaluated. In cases whereTis large relative to the publication and revision times (i.e.,tkþtR
T tj 0), we can simplify this
inequali-ty and refine our ranking of journals based on an index valueVjgiven by
Vj¼
a
jljð1 tj=TÞ
1 1 tj
T tR
T
ð1 a
jÞð1 sÞ
tRþtj ð3Þ
(see theSupporting Informationfor a derivation). This allows us to give each journal an inde-pendent score without evaluating all pairwise comparisons and is indeinde-pendent of the pool of journals being compared.
Note that we have implicitly assumed that all manuscripts are of equal relevance to all jour-nals. This is clearly not the case. The journals under ISI’s‘Ecology’category are still quite het-erogeneous—a single manuscript is unlikely to be relevant to bothPolar Biologyand
Biotropica. When considering where to send a specific manuscript, the ranking criteria (2 or 3) should be applied to the relevant subset of journals.
Model 2. Balancing citations and frustrations
Obviously, there are factors beyond likely citation rates that authors might value in choosing where to submit their manuscript. Here, we consider that authors might also want to minimize either the number of rejections and resubmissions or the total time it takes for their paper to get accepted. Following a given submission sequence, the expected number of submissions is given by
R¼q 1XN
j¼1j
a j
Yj 1
i¼1ð 1 a
iÞð1 sÞ
tRþtiHðT Xj
k¼1
t
j ðj 1ÞtRÞ ð4Þ
Here, H is the Heaviside function, taking the value 1 if its argument is positive and zero other-wise. This is used to ensure that the expected number of resubmissions is calculated within the time horizonT.
the boundary where the expected number of resubmissions is minimized for a given number of citations. Although algorithms for finding the‘efficiency frontier’exist (see, e.g., [15,13]), the space to be evaluated is vast (between 1.4x10¹⁷and 4x1076depending on the algorithm em-ployed). We therefore adopted a Monte Carlo approach. We used a Metropolis algorithm in which a proposed submission sequence was obtained from the current‘best’sequence by swap-ping the position of two journals at random. For both the current and new sequence, we calcu-latedCandRand replaced the current sequence with probability determined by the ratios Cproposed/CcurrentandRcurrent/Rproposed. To ensure that the space of possible orderings was well covered, we used multiple starting conditions representing all N(N-1) possible pairs of first two journals. From these simulations, we obtainedCandRfor 3.2 million different submission schedules. We identified the efficiency frontier by finding the sequence that minimizedRfor each value ofC. For these analyses, we assumed thatT= 5 years,s= 0.001, andtr= 30 days.
Using an analogous approach, we also evaluated the trade-off between the expected number of citations and the mean time to acceptance. The mean time to acceptance is given by
P¼q 1XN
j¼1½
t
iþ ðj 1ÞtRaj
Yj 1
i¼1ð 1 a
iÞð1 sÞ
tRþtiH T Xj
k¼1
t
j ðj 1ÞtR
!
ð5Þ
Data
To gather data on acceptance probability and submission-to-decision times, we contacted the editor or managing editor of each journal listed under the‘Ecology’category in ISI’s Web of Science (n = 125) as well as 6 general journals that publish ecological research (Nature,Nature Climate Change,PLOS ONE,Proceedings of the Royal Society B,Proceedings of the National Academy of Sciences, andScience). We excluded from analysis journals that clearly do not fol-low the standard publishing model (e.g.,Annual Review of Ecology, Evolution, and Systematics has an acceptance rate of 90% because it is an invitation-only journal). We obtained all neces-sary data from 61 journals (47% response;S1 Table). Journal metrics were gathered from ISI’s Journal Citation Reports. Our dataset includes journals from the entire IF spectrum (IF of re-sponding and non-rere-sponding journals were similar;S1 Fig.). Unfortunately, some premier journals are missing from our analysis due to a lack of response. Particularly noteworthy is the absence ofPLOS Biology, despite its core objective“to pursue a publishing strategy that opti-mizes the openness, quality and integrity of the publication process.”
Results
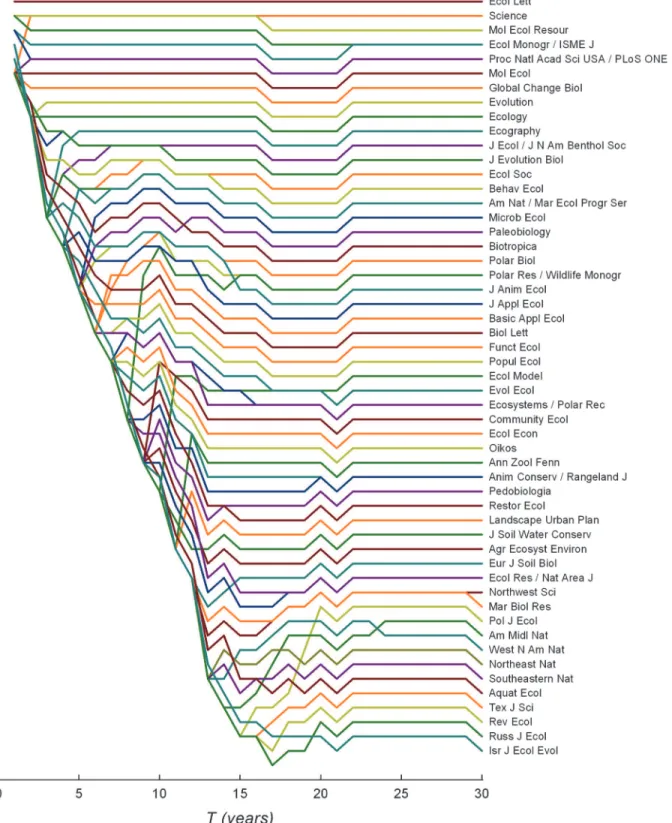
Assuming the probability of getting scooped is relatively low (s=0.001),Ecology Lettersis the optimal ecological journal for anyT. However, for other journals, the time over which to accrue citations,T, changes the optimal submission ranking considerably (Fig. 1). The shape ofFig. 1
is due to the fact that the number of journals that can be tried increases withT. Submitting to every single one of the 61 journals would take ~15 years (and a very thick skin). WhenTis small, relatively few journals can be tried and these are all high-ranking. A higher risk of being scooped (s= 0.01) pushesMolecular Ecology Resourcesto share the top optimal spot with Ecolo-gy Letters; the top 10 journals remain the same but in slightly different order (S2 Fig.).
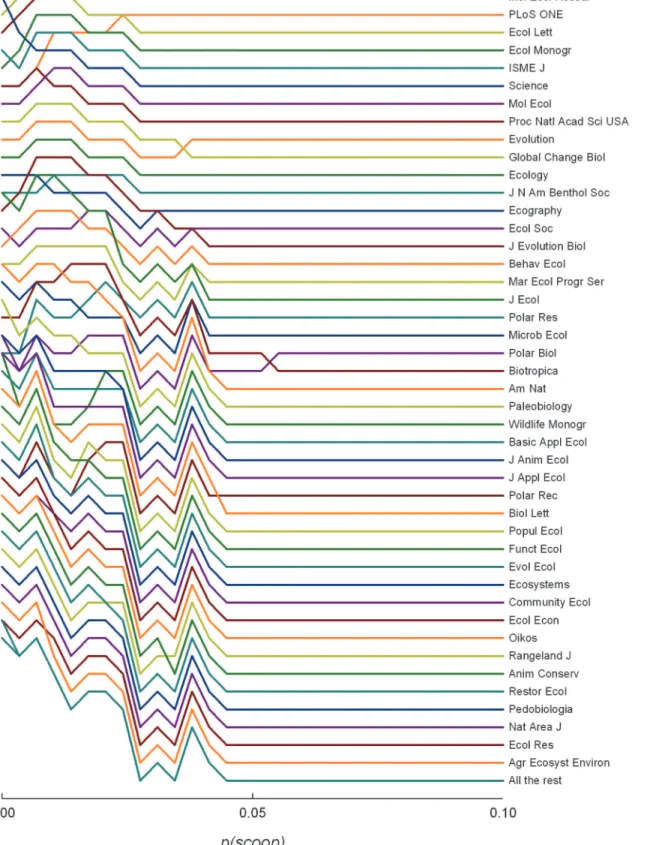
For an intermediateT(10 years),Molecular Ecology Resourcesbecomes the top-ranked jour-nal for most values ofs, followed byPLOS ONEandEcology Letters(Fig. 2). The same general patterns hold atT= 2 years (S3 Fig.). Revision times had very little effect on overall rankings.
Figure 1. Ranking of journals based solely on maximizing citations over different periods of time,T(i.e., maximizingCineq. 1over all possible submission strategies; probability of getting scooped,s= 0.001, time for revisions after each submission,tR= 30 days).The time over which to accrue citations,T, changes the optimal submission ranking considerably.
Figure 2. Ranking of journals, under a citation maximization framework, for different values of scooping probability,s(T= 10 years,tR= 30 days).
p<0.001). Thus, it is possible to extend this analysis to other journals without re-evaluating all pairs if acceptance rate and submission-to-decision times are known.
If we are trying to maximize citations and allow for the fact that a manuscript might be re-jected, the strategy of just working down the IF ranking is clearly suboptimal. But how bad is it, exactly? When considering all ecological journals, following the IF ranking produces an ex-pected number of citations that is never less than 90% of that obtained following the optimal submission schedule, wheneverTis>3 yrs. However, if only a subject-specific subset of jour-nals was used (e.g., only jourjour-nals that would realistically accept a modeling paper like this one), the citations resulting from using the IF ranking are relatively worse, but still within ~70% of optimal. Thus, if an author cares only about accumulating citations and wishes not to do any calculating, working down the IF list is not too bad of a strategy.
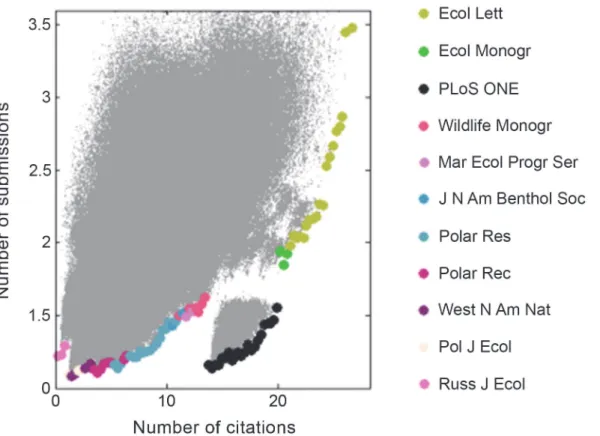
However, researchers may not wish to go through multiple resubmissions or might want to minimize the time it takes for their paper to appear in print. In light of this, we evaluated the trade-off between the expected number of citations and the expected number of times the man-uscript will be submitted (Fig. 3&S4 Fig.) and the mean time to decision (Fig. 4&S5 Fig.). Note that in both cases, the efficiency frontier is nonlinear and has a complex structure result-ing from the discrete nature of the state space. These figures suggest that three tiers exist: the top citation-getters (Ecology Letters,Science,Ecological Monographs,ISME Journal), the oddly high-valuePLOS ONE, and the more specialized/focused journals. In keeping with the results from model 1, the simulation indicates that sequences begun withEcology Lettersobtain the
Figure 3. 3,200,000 different submission strategies (each grey dot) are evaluated in terms of expected number of citations (over 5 years) and number of submissions needed before acceptance (s= 0.002,tR= 30 days).Highlighted are the top journals for citation-maximizing strategies that minimize resubmissions (efficiency frontier).Ecology Lettersdominates the high expected number of citations area, whilePLOS ONEis the clear optimal choice at intermediate citations.
highest expected number of citations. However, authors willing to give up four to fourteen cita-tions on average can save themselves up to 0.5 to 1.5 revisions (Fig. 3) and between 30 and 150 days (Fig. 4) by submitting first toPLOS ONE.Indeed, the sharp nonlinearity indicates that publishing in any of the journals to the left ofPLOS ONEwould result in lower citations for a negligible reduction in resubmissions or publication time.
Discussion
Given the negative relationship between IF and the probability of acceptance (S1 Table, [6]), we expected the follow-the-IF strategy to be sub-optimal. Quite surprisingly, following an IF-ranked submission strategy was negligibly worse than the optimal strategy, which included important considerations like time over which to maximize the citation count and the inherent risks of trying new journals (e.g., getting scooped). Following the IF heuristic is quite close to optimal when the chance of getting scooped is low orTis large. This result, however, relies on authors’willingness to re-submit however many times are necessary.
If, in addition to maximizing citations, a scientist is interested in keeping the number of re-submissions low,Fig. 3should provide some guidance.PLOS ONEis a clear winner for low to moderate expected citations (less than 20 in 5 years). At the high end, submission sequences beginning withEcology LettersandEcological Monographssurprisingly provide a better value than those starting withScience, the top IF journal in our dataset.
Figure 4. Expected number of citations (over 5 years) and time spent in review for 3,200,000 different submission strategies (s= 0.002,tR= 30 days).Highlighted are the top journals for citation-maximizing strategies that minimize time spent in review.
We note that while the model we developed is quite general and could be applied to deter-mine where to publish for any discipline, these specific results apply only to the subset of eco-logical journals for which we had data. It would be interesting to evaluate whether the‘IF heuristic’is nearly optimal in other disciplines, or whether a sharply nonlinear trade-off be-tween citations and‘frustrations’is common across disciplines or unique to ecology.
Many important considerations were left out of this analysis. Price per article, for
instance, may dissuade some authors from submitting to costly journals (see [16] for an analy-sis of publication fees and article influence scores). Our model also makes several important simplifications. First, we assumed that the time to publication is roughly constant among pa-pers at a given journal. Although this is not the case [17], we did not have data on variation in the processing time among papers for each journal. Given the nonlinear dependence of our model on publication time, Jensen’s inequality guarantees that—all else being equal— a journal with variable publication times should rank lower than one in which they are constant.
We have also assumed that the acceptance rate and probability of getting scooped are the same for all manuscripts. Manuscripts vary considerably in relevance and quality, even within a single research group, and this is likely to affect the acceptance rate and probability of being scooped. For instance, manuscripts on the spawning periodicity of mummichogs [18] or the re-cruitment dynamics of bluefish [19] are in little danger of being scooped and hardly likely to be accepted byScienceorEcology Letters. In applying our strategy to a real manuscript, authors should start at the“appropriate”level for their article (Aarsen and Budden [20] suggest a meth-od for judging the quality of a manuscript).
Perhaps the most important assumptions we made involve the use of IF to measure the expected citation rate of an article. Article-specific citation rates are not constant [21–23] and the average impact factor may be a poor predictor for an individual article over its citation history [9]. Since the expected number of citations depends linearly on the journal-specific ci-tation rate, the mean is sufficient to summarize variation in the average rate among
papers within a journal. However, the assumption that there is no variation through time in the rate at which citations are accumulated at a particular journal is more problematic. To compensate for this, our analysis could be extended to include the time-dependent citation profile derived by Wang et al. [9]. Doing so would dramatically increase the complexity of our model and require estimation of the parameter distributions for each eco-logical journal.
Along similar lines, we assumed that IF ratings were constant over the decision interval. Though this is clearly not the case, forecasting IFs is outside the scope of this note. Particularly relevant to our results is the fact thatPLOS ONE’s IF has been declining steadily since 2010. Re-peating our analysis withoutPLOS ONE, while assuming all other journals remain the same, dramatically changes the shape of the efficiency frontier by eliminating the concavity that ap-peared in Figs.3–4(S6&S7Figs.).Ecological MonographsandISME Journallargely take the place ofPLOS ONE, but the absence of a sharp corner to their left means that many other jour-nals could be optimal places to submit, depending on the relative importance of citations, revi-sions, and publication time.
Supporting Information
S1 Fig. Impact factor of journals that responded to our request for data did not differ from those that did not respond.
(PDF)
S2 Fig. Sensitivity of journal ranking to varying values ofTassuming a relatively high
scooping probability (s= 0.01).
(PDF)
S3 Fig. Sensitivity of journal ranking to varying values ofsassuming a relatively short
peri-od of interest for the accumulation of citations (T= 2 years).
(PDF)
S4 Fig. Expected number of citations for a given number of submissions for 3,200,000
dif-ferent journal ranking combinations.Highlighted are the second-top journals for
citation-maximizing strategies that minimize re-submissions (i.e., the journals that follow those in
Fig. 3). (PDF)
S5 Fig. Expected number of citations (over 5 years) and time spent in review for 3,200,000
different journal ranking combinations.Highlighted are the second-top journals for
citation-maximizing strategies that minimize time spent in review (i.e., the journals that follow those in
Fig. 3). (DOCX)
S6 Fig. Expected number of citations (over 5 years) and time spent in review for 3,200,000
different journal rankings excludingPLOS ONEfrom the analysis.Highlighted are the top
journals for citation-maximizing strategies that minimize re-submissions. (PDF)
S7 Fig. Expected number of citations (over 5 years) and time spent in review for
3,200,000 different journal rankings excludingPLOS ONEfrom the analysis.
Highlighted are the top journals for citation-maximizing strategies that minimize time spent in review.
(DOCX)
S1 Model. Model derivation.
(PDF)
S1 Table. Data used in the analysis.
(PDF)
S1 Text. Editors who contributed data.
(PDF)
Acknowledgments
Author Contributions
Conceived and designed the experiments: SS SBM. Performed the experiments: SS SBM. Ana-lyzed the data: SS SBM. Contributed reagents/materials/analysis tools: SS SBM. Wrote the paper: SS SBM.
References
1. Adam D (2002) The counting house. Nature 415: 726–729. doi:10.1038/415726aPMID:11845174 2. Smith R (2006) The power of the unrelenting impact factor—is it a force for good or harm? Int J
Epide-miol 35: 1129–1130. doi:10.1093/ije/dyl191PMID:16987843
3. Seglen PO (1997) Why the impact factor of journals should not be used for evaluating research. BMJ 314: 498–502. doi:10.1136/bmj.314.7079.497PMID:9056804
4. Archambault E, Larivière V (2009) History of the journal impact factor: contingencies and conse-quences. Scientometrics 79: 635–649. doi:10.1007/s11192-007-2036-x
5. Vanclay JK (2012) Impact factor: outdated artifact or stepping-stone to journal certification? Sciento-metrics 92: 211–238. doi:10.1007/s11192-011-0561-0
6. Aarsen LW, Tregenza T, Budden AE, Lortie CJ, Koricheva J, et al. (2008) Bang for your buck: rejection rates and the impact factors in ecological journals. Open Ecol J 1: 14–19. doi:10.2174/
1874213000801010014
7. Calcagno V, Demoinet E, Gollner K, Guidi L, Ruths D, et al. (2012) Flows of research manuscripts among scientific journals reveal hidden submission patterns. Science 338: 1065–1069. doi:10.1126/ science.1227833PMID:23065906
8. Phase5 Research. 2014.Canadian researchers’publishing attitudes and behaviours.
9. Wang D, Song C, Barabási A-L (2013) Quantifying long-term scientific impact. Science 342: 127–132.
doi:10.1126/science.1237825PMID:24092745
10. Larivière V, Gingras Y, Archambault E (2009) The decline in the concentration of citations, 1900–2007.
J Am Soc Inf Sci Technol 60: 858–862. doi:10.1002/asi.21011
11. Ross SM (1970) Applied probability models with optimization applications. San Francisco: Holden-Day, San Francisco. 198 p.
12. Garfield E (1994) The impact factor. Current Contents 25: 3–7.
13. Cohon JL (1978) Multiobjective programming and planning. San Diego: Academic Press. 333 p.
14. Bertsekas D (2007) Dynamic programming and optimal control: approximate dynamic programming. Nashua, NH: Athena Scientific. 1270 p.
15. Liu GP, Yang J, Whidborne JF (2003) Multiobjective optimisation and control. Philadelphia, PA: Re-search Studies Press. 300 p.
16. West J.D., Bergstrom T, Bergstrom CT (2014) Cost effectiveness of open access publications. Econ In-quiry 52: 1315–1321. doi:10.1111/ecin.12117
17. Björk B-C, Solomon D (2013) The publishing delay in scholarly peer-reviewed journals. J Informetr 7: 914–923. doi:10.1016/j.joi.2013.09.001
18. Petersen CW, Salinas S, Preston RL, Kidder GW III (2010) Spawning periodicity and reproductive be-havior ofFundulus heteroclitusin a New England salt marsh. Copeia 2010: 203–210. doi: 10.1643/CP-08-229
19. Munch SB, Conover DO (2000) Recruitment dynamics of bluefish (Pomatomus saltatrix) from Cape Hatteras to Cape Cod, 1973–1995. ICES J Mar Sci 57: 393–402. doi:10.1006/jmsc.1999.0636 20. Aarsen LW, Budden AE (2010) Judging the quality of our research: a self-assessment test. Web Ecol
10: 23–26. doi:10.5194/we-10-23-2010
21. Redner S (1998) How popular is your paper? An empirical study of the citation distribution. Eur Phys J B 4: 131–134. doi:10.1007/s100510050359
22. Colquhoun D (2003) Challenging the tyranny of impact factors. Nature 423: 479. doi:10.1038/423479a
PMID:12774093