Monitoring Low Molecular Weight Heparins
at Therapeutic Levels: Dose-Responses of,
and Correlations and Differences between
aPTT, Anti-Factor Xa and Thrombin
Generation Assays
Owain Thomas1,2*, Emanuel Lybeck1, Karin Strandberg1,3, Nahreen Tynngård4,5,
Ulf Schött1,6
1Medical Faculty, University of Lund, Lund, Sweden,2Department of Paediatric Anaesthesia and Intensive Care, SUS Lund University Hospital, Lund, Sweden,3Coagulation Laboratory, Dept. of Clinical Chemistry, Division of Laboratory Medicine, Skåne University Hospital, Malmö, Sweden,4Department of Clinical Immunology and Transfusion Medicine, Department of Clinical and Experimental Medicine, Linköping University, Linköping, Sweden,5Department of Clinical Chemistry, Department of Clinical Experimental Medicine, Linköping University, Linköping, Sweden,6Department of Anaesthesia and Intensive Care, SUS Lund University Hospital, Lund, Sweden
*odt@cantab.net
Abstract
Background
Low molecular weight heparins (LMWH’s) are used to prevent and treat thrombosis. Tests for monitoring LMWH’s include anti-factor Xa (anti-FXa), activated partial thromboplastin time (aPTT) and thrombin generation. Anti-FXa is the current gold standard despite LMWH’s varying affinities for FXa and thrombin.
Aim
To examine the effects of two different LMWH’s on the results of 4 different aPTT-tests, anti-FXa activity and thrombin generation and to assess the tests’concordance.
Method
Enoxaparin and tinzaparin were added ex-vivo in concentrations of 0.0, 0.5, 1.0 and 1.5 anti-FXa international units (IU)/mL, to blood from 10 volunteers. aPTT was measured using two whole blood methods (Free oscillation rheometry (FOR) and Hemochron Jr (HCJ)) and an optical plasma method using two different reagents (ActinFSL and PTT-Auto-mat). Anti-FXa activity was quantified using a chromogenic assay. Thrombin generation (Endogenous Thrombin Potential, ETP) was measured on a Ceveron Alpha instrument using the TGA RB and more tissue-factor rich TGA RC reagents.
OPEN ACCESS
Citation:Thomas O, Lybeck E, Strandberg K, Tynngård N, Schött U (2015) Monitoring Low Molecular Weight Heparins at Therapeutic Levels: Dose-Responses of, and Correlations and Differences between aPTT, Anti-Factor Xa and Thrombin Generation Assays. PLoS ONE 10(1): e0116835. doi:10.1371/journal.pone.0116835
Academic Editor:Masaru Katoh, National Cancer Center, JAPAN
Received:September 3, 2014
Accepted:December 15, 2014
Published:January 27, 2015
Copyright:© 2015 Thomas et al. This is an open access article distributed under the terms of the
Creative Commons Attribution License, which permits unrestricted use, distribution, and reproduction in any medium, provided the original author and source are credited.
Data Availability Statement:All relevant data are within the paper and its Supporting Information files.
Results
Methods’mean aPTT at 1.0 IU/mL LMWH varied between 54s (SD 11) and 69s (SD 14) for enoxaparin and between 101s (SD 21) and 140s (SD 28) for tinzaparin. ActinFSL gave sig-nificantly shorter aPTT results. aPTT and anti-FXa generally correlated well. ETP as mea-sured with the TGA RC reagent but not the TGA RB reagent showed an inverse exponential relationship to the concentration of LMWH. The HCJ-aPTT results had the weakest correla-tion to anti-FXa and thrombin generacorrela-tion (Rs0.62–0.87), whereas the other aPTT methods
had similar correlation coefficients (Rs0.80–0.92).
Conclusions
aPTT displays a linear dose-respone to LMWH. There is variation between aPTT assays. Tinzaparin increases aPTT and decreases thrombin generation more than enoxaparin at any given level of anti-FXa activity, casting doubt on anti-FXa’s present gold standard sta-tus. Thrombin generation with tissue factor-rich activator is a promising method for monitor-ing LMWH’s.
Introduction
Low molecular weight heparins (LMWH’s) are among the most-commonly used anticoagu-lants in modern healthcare, usually given in fixed doses once or twice daily. Although monitor-ing is not routine, it is recommended when accurate dosmonitor-ing is especially important, such as in the context of renal impairment, which incurs the risk of accumulation, or at extremes of weight or age [1].
Routine coagulation analysis includes activated partial thromboplastin time (aPTT), pro-thrombin time-international normalized ratio (PT-INR) and platelet count (Plc). aPTT is widely available but is generally considered suboptimal for monitoring agents other than unfractionated heparin (UFH) since it has low and varying sensitivity to anticoagulation caused by LMWH’s, direct thrombin (factor IIa, FIIa) and anti-factor Xa (anti-FXa) inhibitors such as dabigatran and rivaroxaban respectively [2]. In contrast to PT-INR, which is interna-tionally standardized such that all PT-INR measurements on a single sample ought always to be the same, variation in aPTT exists between laboratories and reagents, complicating the use of this assay for guiding dosage of LMWH [3,4].
While anti-FXa activity assays are reliable determinants of the concentration of LMWH in the blood [5] and are established as a gold standard, they do not necessarily correlate well to the actual effect of the drug in vivo: they describe pharmacokinetics rather than pharmacody-namics. Tests of global coagulation such as aPTT and PT-INR are different from anti-FXa ac-tivity tests in that they reflect LMWH’s clinical effect [6,7].
Most of LMWH’s anticoagulative effect is provided by indirect inhibition of FXa which cleaves FII to FIIa, but like UFH they also show some indirect inhibition of FIIa itself. The anticoagulative effect of UFH and LMWH also depends on numerous other factors both phar-macokinetic and pharmacodynamic. Among these factors are that these drugs release tissue factor pathway inhibitor, and there are interindividual variations in heparin-binding proteins [8,9].
LMWH’s are produced through depolymerization of UFH resulting in shorter heparin frag-ments and a lower mean molecular weight. There are several brands of LMWH available,
manufactured through different chemical methods. This results in various chemical structures in the saccharide fragments that are isolated [10]. LMWH’s with longer fragments, such as tinzaparin, tend to inhibit FIIa more strongly, while LMWH’s with shorter fragments, such as enoxaparin, exert more specific inhibition of FXa. The resultant pharmacodynamic differences are described by the FXa/FIIa ratio–seeTable 1[11,12].
In vivostudies have suggested that measurement of the area under the thrombin generation curve, the endogenous thrombin potential (ETP), could be superior to the aPTT in monitoring the effect of LMWH and UFH [9,13,14]. It measures the total and physiologically relevant amount of thrombin formed uponin vitroactivation of coagulation, whereas global methods based on clot formation time measure are sensitive only when the amount of thrombin formed is small.
The aim of this study was to compare the correlation of anti-FXa activity and thrombin gen-eration with aPTT using four different methods. This is relevant to our clinical practice where we are confronted with the simple question: which test should we order to ensure correct dos-age of LMWH? The tests were run on both enoxaparin and tinzaparin, since they have different FXa/FIIa inhibition ratios. Our hypothesis was that increased concentrations of LMWH would give prolongations of the aPTT, increased anti-FXa activity and inhibit FIIa generation. Due to the higher FXa/FIIa inhibition ratio of enoxaparin we expected it to have a lesser effect on the aPTT and FIIa generation than tinzaparin at any given level of anti-FXa activity.
Materials and Methods
Approval was obtained from the Regional Ethical Review Board (Lund, Protocol DNR 2010/ 482) and signed consent given by the volunteers.
Blood sampling and preparation
Blood taken from 10 volunteers by venous puncture was collected in citrated tubes (BD Vacutainer, 4.5 ml, 0.109 M sodium citrate). The samples were diluted with enoxaparin or tinzaparin to concentrations of 0.0, 0.5, 1.0 and 1.5 anti-FXa international units (IU) per ml plasma by adding a volume of 30μl LMWH (0, 10, 20 and 30 IU/ml in physiological saline) to
each ml blood. This dilution assumed that plasma accounted for 60% of the blood volume. The samples were then incubated for 10 minutes at 37°C before those intended for plasma-based aPTT and thrombin generation tests were immediately centrifuged for 20 minutes (2000 rpm at−20°C). Plasma was separated and stored at−80°C for later analysis. Whole blood aPTT was
measured using the free oscillation rheometry (FOR) and Hemochron Jr apparatuses within an hour of sampling.
Table 1. Molecular weight and anti-factor Xa and anti-factor IIa activities of heparin and commonly used low molecular weight heparins (LMWH).a
Agent Trade name in Sweden Mean molecular mass Anti FXa/FIIa (anti-FXa IU/mg) Anti FXa/FIIa ratio
Unfractionated heparin (UFH) Heparin 15 kDa 193/193 1
Tinzaparin Innohep 6.8 kDa 90/45 2.0
Dalteparin Fragmin 6.0 kDa 130/52 2.5
Enoxaparin Klexane 4.2 kDa 100/25 3.9
Fondaparinux Arixtra 1.7 kDa 930/0 1
a
The shorter the LMWH fragments, the more specific the agent is for factor Xa [11].
The titrations of LMWH used were selected to cover therapeutic concentrations: the plasma level of LMWH for treatment of pulmonary embolism should be 0.5 to 1.1 IU/ml of anti-FXa activity for twice-daily dosing, or 0.8 and 1.6 IU/mL for once-daily dosing [15].
FOR
–
aPTT
FOR was performed using a ReoRox 4 instrument (MediRox AB, Nyköping Sweden). The ref-erence interval in healthy individuals is 26–35 seconds (s). Two hundredμl of whole blood
was added to a cylindrical plastic cup and incubated with 200μl of aPTT reagent (MRX931,
MediRox AB) for 5 minutes. The reaction was started by recalcification with 200μl CaCl
2.5 mmol/ml. The sample was set into free oscillation and the frequency and damping of the sample measured over time.
Hemochron Jr
–
aPTT
Whole blood aPTT was analysed using the Hemochron Jr (International Technidyne Corpora-tion, Edison, New Jersey) (HCJ) system with a reference interval of 26–36s. Seventyμl citrated
blood was added to a disposable cuvette specifically for citrated blood. The instrument moves the blood back and forth within a test channel having mixed it with a reagent. Clotting is de-tected using a LED light source and optical detectors.
Plasma-aPTT
Plasma-aPTT was performed using a BCS-XP analyzer (Siemens Healthcare Diagnostics, Mar-burg, Germany) with two reagents, Actin FSL (Siemens) with a reference interval of 26–33s and PTT- Automat (Stago, Asnières, France) with a reference interval of 28–45s. For clinical reasons, aPTT’s of more than 150s are recorded as‘>150s’. Coagulation is initiated with a
con-tact activator and phospholipids in the reagent and after recalcification with CaCl2, the coagu-lation time is measured in seconds through optical detection.
Anti-FXa activity
Anti-FXa activity was analysed on a BCS-XP with Coamatic Heparin (Chromogenix, Instru-mentation Laboratories, Bedford, USA). This method is based on the inhibition of FXa by its forming inactive complexes with the antithrombin. LMWH accelerates this process such that the concentration of LMWH can be determined by the addition of a substrate which releases a colour upon cleavage by the remaining FXa, which has not bound to antithrombin [16].
Thrombin generation
Thrombin generation was measured over time on a Ceveron Alpha (Technoclone, Vienna, Austria). The concentration of thrombin is measured with a fluorescent peptide substrate, which is cleaved by thrombin to release a fluorophore. Coagulation is initiated through the addition of tissue factor and phospholipids. The rate of thrombin generation is measured over time resulting in a thrombin formation curve. The area under the curve is calculated to give the‘endogenous thrombin potential’(ETP), which represents the total amount of thrombin generated.
We initially used the TGA RB (also manufactured by Technoclone) reagent, which contains 2pM human recombinant tissue factor. Due to the results from these analyses (seeresults
Statistical analysis
All statistical analysis was performed using the R software (version 3.0.3,www.r-project.org). The Wilcoxon signed rank test was conducted on each pair of contiguous groups of LMWH concentrations to test whether there was a significant difference in aPTT between the two groups. It was chosen over the standard Student’s t-test due to the relatively small number of samples in this study, where the Wilcoxon signed rank test has proven to be more powerful [13]. P<0.05 was considered statistically significant. Box-plots were drawn where the
box represents the interquartile range and the whiskers represent the range excluding outliers, defined as being more than 1.5 times the interquartile range from the upper or low quartiles. Spearman’s ranked correlation test was performed to quantify the correlation between each aPTT method and the anti-FXa activity. It was chosen instead of Pearson’s product-moment correlation due to the samples of the full group not being normally distributed, which is a re-quirement for using the Pearson’s product moment correlation.
Since the plasma-based methods (ActinFSL and PTT-Automat) gave numerical results for aPTT’s of 150s or less, we registered results of‘>150s’as 150s in our data set. Due to 8 of the
10 subjects having at least one plasma-aPTT of‘>150s’in the presence of 1.5 IU/ml of
tinzaparin, we excluded all data from this concentration of LMWH when calculating correlation factors.
Results
Ten volunteers were included, all healthy men with ages ranging from 23–62 years. None had a known coagulation disorder. Our results are available as raw data inS1 File.
aPTT exhibits a linear dose-response to LMWH; there is variation between assays.
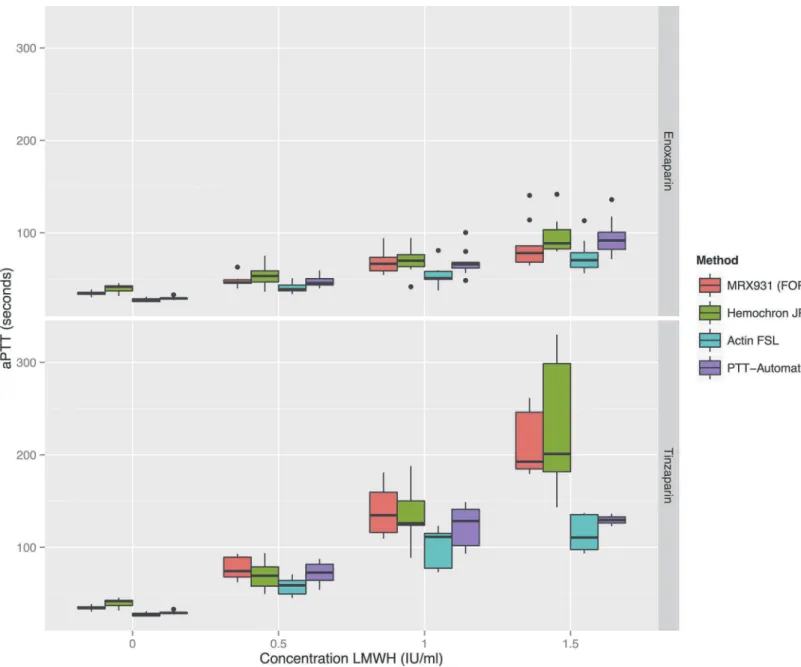
Fig. 1shows that within the range tested, there is a linear dose-response relationship for each LMWH measured with the four different aPTT tests. With every increase of 0.5 IU/ml in LMWH concentration there was a statistically significant increase in aPTT for all the tests.
There were some significant differences between different methods’aPTT results. The Hemochron Jr showed a tendency to give longer aPTT’s but the only reagent which consistent-ly gave different results compared to the other methods was the plasma-based ActinFSL, which gave the shortest mean aPTT for all concentrations of LMWH. Which significant differences were present between reagents at different concentrations is shown inS2 File.
Tinzaparin prolongs aPTT more than enoxaparin
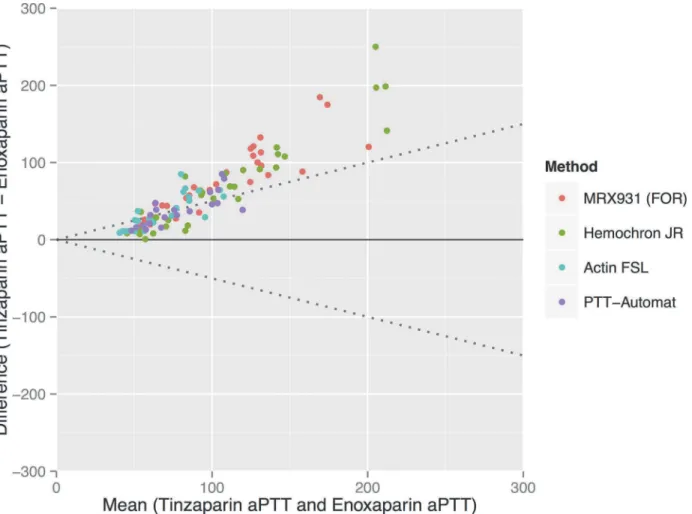
Tinzaparin gave significantly longer aPTT’s than enoxaparin at any given dosage of anti-FXa activity—see Figs.1and2. Complete tables of this data inS3 Fileshow that the mean aPTT at a concentration of 1 IU/mL of LMWH varied from between 54s (SD 11.4) and 69s (SD 13.8) for the enoxaparin samples to between 101s (SD 21.0) and 140s (SD 27.6) for the tinzaparin sam-ples. The standard deviation of the aPTT results increases with increasing concentrations of LMWH.
APTT is linearly correlated to anti-FXa activity, which is strongly
correlated to the concentration of LMWH
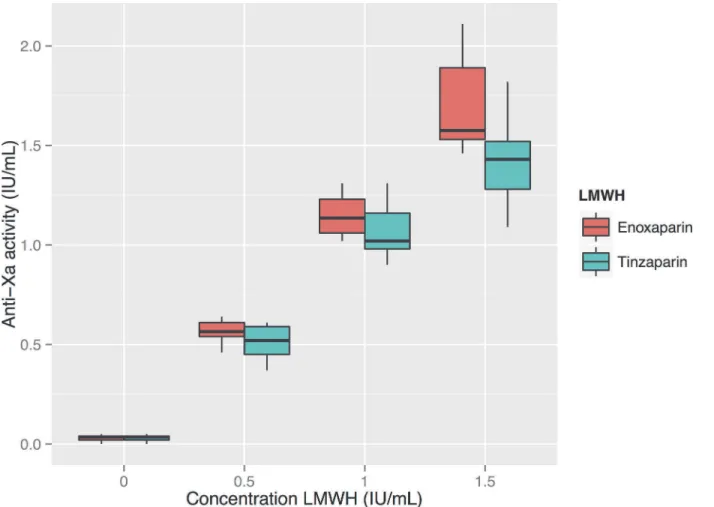
Anti-FXa activity showed a strong dose-response to both enoxaparin and tinzaparin—see
methods, reflecting the fact that ActinFSL gives lower values of aPTT compared to the other methods.
Thrombin generation shows a negative exponential dose-response to
increasing doses of LMWH
Thrombin generation measured using the TGA RB reagent was strongly inhibited by all con-centrations of LMWH and showed an unacceptable degree of variation between results at each concentration—see diagram inS3 File.
Figure 1. Boxplots of the four aPTT methods’results for enoxaparin and tinzaparin in three different concentrations.When comparing the contiguous groups with the same aPTT-method but different concentrations of LMWH, a significant difference in aPTT was found in all cases. Statistical significances between classes are shown inS1 File.
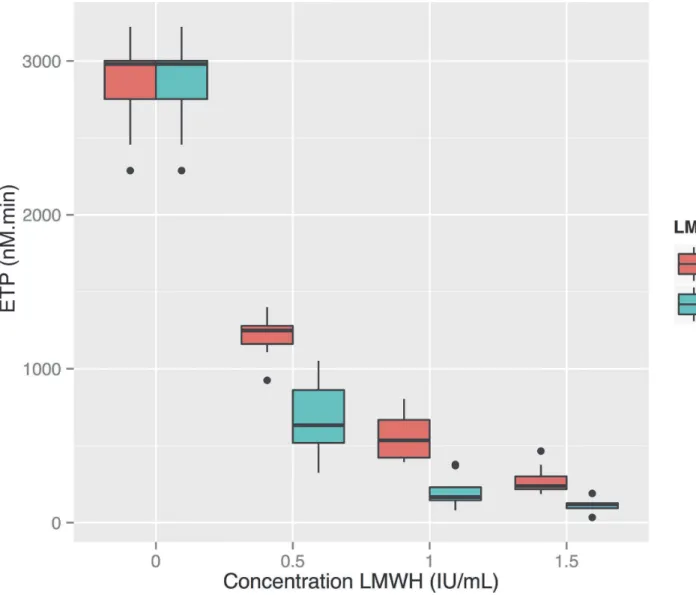
Enough plasma remained to run the tests again using the TGA RC reagent on eight of the ten subjects’plasma. With this reagent the ETP showed a negative exponential relationship to the dose of LMWH, with tinzaparin exhibiting stronger inhibition of thrombin generation than enoxaparin: the mean ETP at a LMWH concentration of 1.0 anti-FXa IU/ml was 560 nM. min (SD 152) for enoxaparin and 206 nM.min (SD 104) for tinzaparin (seeFig. 5). Differences between the different concentrations as well as the two LMWH’s were all
statistically significant.
APTT shows a negative linear correlation to thrombin generation
’
s
logarithm
SeeFig. 6andTable 3. The logarithm of ETP measured using the TGA RC reagent showed a
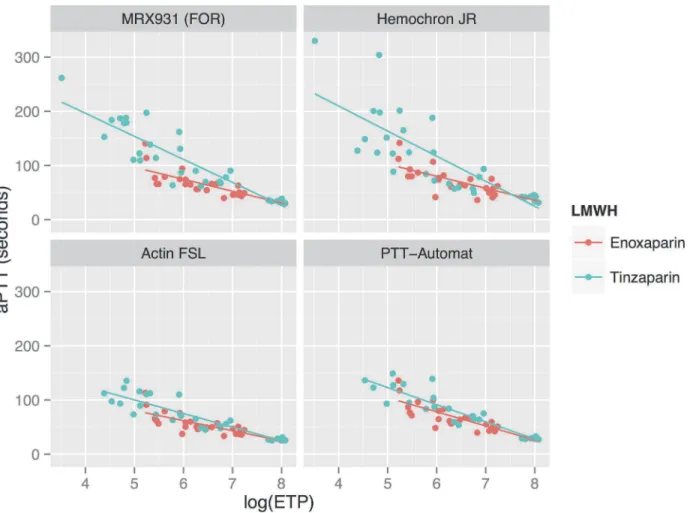
strong linear negative correlation to the aPTT, as measured using all apparatuses other than Hemochron Jr. For enoxaparin the correlation coefficient RS was between−0.80 and−0.88
while for tinzaparin RS was between−0.87 and−0.92. Due to HCJ’s aPTT results being more
variable at higher concentrations of LMWH, the correlation between HCJ-aPTT and
log10(ETP) was weaker (Rs−0.62–0.85). In the whole blood assays (FOR and HCJ) there was a
tendency for tinzaparin to elevate the aPTT more than enoxaparin at any given level of inhibi-tion of thrombin generainhibi-tion.
Figure 2. A comparison of enoxaparin and tinzaparin’s relative effects on aPTT.Bland-Altman plot showing that the aPTT’s induced by tinzaparin ranged from on average 49% more than enoxaparin (when measured using the PTT-Automat reagent) to 66% more than enoxaparin (when measured using the MRX931 reagent (FOR: free oscillation rheometry).
aPTT: activated partial thromboplastin time. ETP: endogenous thrombin potential. FOR: Free-oscillation rheometry.
Anti-FXa activity shows a negative linear correlation to thrombin
generation
’
s logarithm
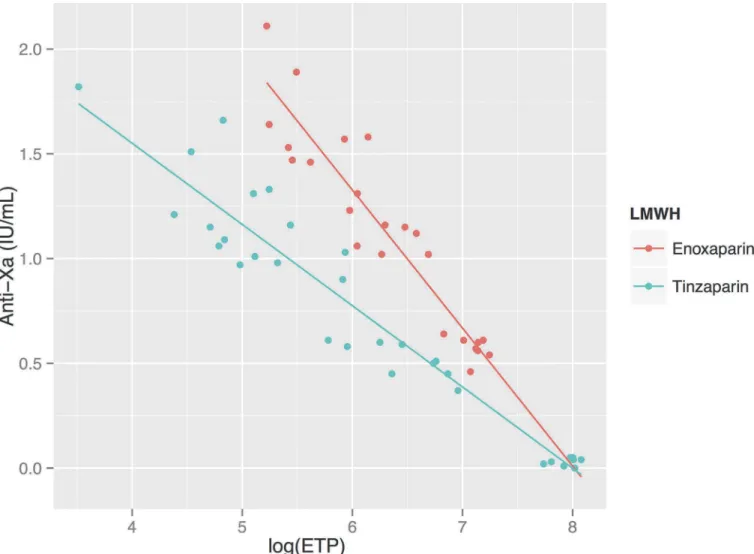
Correlations between the log10(ETP) and anti-FXa activity were also very strong for both LMWH’s (RS−0.93 and−0.94 for enoxaparin and tinzaparin respectively)—seeFig. 7. In
con-trast to aPTT, which was elevated more by tinzaparin in the whole-blood samples, enoxaparin resulted in a somewhat more elevated anti-FXa for any given level of inhibition of thrombin generation, which is to be expected since it has an anti-FXa/FIIa ratio of 3.9 compared to tinzaparin’s ratio of 2.0.
Discussion
Enoxaparin and tinzaparin vary in their pharmacological properties and
the anticoagulative effect of LMWH may vary between patients
Our results support previous work showing that the anti-FXa assay is an excellent test for de-termining the concentration of LMWH in plasma [5]. It does not, however, reflect the absolute anticoagulative effect of the drugs it measures despite being strongly correlated to aPTT in this Figure 3. Relationship between measured anti-FXa and the concentration of low molecular weight heparin (LMWH).There is a strong linear correlation between anti-FXa results and the concentration of LMWH (dosed in anti-FXa units per ml). For enoxaparin and tinzaparin the correlation coefficients Rsare 0.97 and 0.96 respectively.
study (excluding Hemochron Jr: RS= 0.80–0.91). One recent study conducted on 149 patients receiving unfractionated heparin for various indications found the correlation between the anti-FXa activity and aPTT to be much weaker (r = 0.61), which was attributed to variation in FII and FVIII [17]. We suggest that although the anti-FXa test should be used to dose LMWH’s in patients with unpredictable pharmacokinetics: children, the obese, those in renal failure; Figure 4. Correlations between aPTT and anti-FXa at varying concentrations of enoxaparin and tinzaparin, using various reagents.Anti-FXa activity reflects the concentration of LMWH and the aPTT correlated well to this measure. The correlation for Hemochron Jr is slightly weaker than for the other reagents (seeTable 2).
doi:10.1371/journal.pone.0116835.g004
Table 2. Explanatory toFig. 4: Correlation and regression between aPTT and Anti-FXa for enoxaparin and tinzaparin.
Enoxaparin Tinzaparin
Reagent RS Regression line RS Regression line
MRX931 (FOR) 0.88 y = 32x + 32 0.88 y = 119x + 25
Hematochron Jr 0.67 y = 32x + 37 0.85 y = 129x + 21
ActinFSL 0.80 y = 28x + 25 0.89 y = 68x + 25
PTT-Automat 0.86 y = 39x + 26 0.91 y = 91x + 27
FOR: free-oscillation rheometry.
Figure 5. Thrombin generation at increasing concentrations of LMWHa, measured using the TGA RC reagent.Thrombin generation is inhibited in a negative exponential manner by increasing doses of LMWH. There is a significant difference between Endogenous Thrombin Potential (ETP) at all contiguous concentrations and between ETP for the two reagents at each individual concentration (P<<0.05).aLow Molecular Weight Heparin.bETP:
Endogenous Thrombin Potential.
more functional tests of anticoagulation are required to monitor the actual effect of these drugs [18,19].
Since both enoxaparin and tinzaparin were dosed in FXa units in our study, the anti-FXa effect of each drug at each concentration was the same—seeFig. 3. Tinzaparin attenuated the ETP more potently, and prolonged aPTT more than enoxaparin at equivalent levels of anti-FXa activity—see Figs.1and5. This has been observed in previous studies and would ap-pear to be due to tinzaparin’s stronger inhibition of FIIa [20]. We would like to emphasize that it is illogical and confusing that despite tinzaparin’s greater anti-FIIa effect, it is clinically ad-ministered in anti-FXa IU/mL/kg while enoxaparin is adad-ministered in mg/kg.
aPTT is prolonged by LMWH; there is variation between methods and
reagents
Due to there being no standardisation of reagents used for aPTT, each laboratory has its own reference interval for their own specific reagent, instruments and population. This leads to clin-ical problems interpreting aPTT results in the clinclin-ical context, confounded by the fact that pro-longed aPTT can be caused by factors other than coagulopathyper se.The time between sampling and analysing and the fasting state of the patient may influence the aPTT, as can a high haematocrit, which results in a lower plasma volume per ml blood taken at venepuncture such that the ratio of citrate to plasma is increased, prolonging the aPTT [21]. Our results dem-onstrate that there is significant variation between the different methods even when time to sampling and hydration state of each individual subjects was the same for all the tests.
The aPTT’s produced using the ActinFSL reagent were lower than the values provided by the other methods (seeFig. 4). This does not mean that ActinFSL is a less useful assay than the other tests since it correlates just as strongly to the concentration of LMWH, aPTT and anti-FXa activity. Clinicians must, however, be aware that changing to ActinFSL from one of the other reagents will result in a shorter aPTT despite an unchanged level of anticoagulation.
Patient-near monitoring with aPTT
The two whole blood methods (FOR and Hemochron Jr: HCJ) can be used in the point-of-care setting. The Hemochron Jr apparatus in particular is portable, robust and easy to use. At lower concentrations of LMWH it has a similar profile to the FOR in terms of sensitivity and variance of results—seeFig. 1—and may therefore be suitable for monitoring thrombosis prophylaxis in patients at risk of accumulation of LMWH, for example in renal failure. The Hemochron Jr did, however, have a lower correlation coefficient to anti-FXa activity and ETP than the other aPTT methods in our study, and a greater variance than the FOR apparatus at higher concen-trations—see Figs.1and4. The more cumbersome FOR apparatus would therefore be more Table 3. Explanatory toFig. 6.
Reagent Enoxaparin Tinzaparin
RS Regression line RS Regression line
MRX931 (FOR) -0.88 y =−0.017x + 80 -0.87 y =−0.042x + 147
Hematochron Jr -0.62 y =−0.017x + 85 -0.87 y =−0.043x + 153
ActinFSL -0.83 y =−0.015x + 66 -0.92 y =−0.027x + 100
PTT-Automat -0.80 y =−0.021x + 85 -0.92 y =−0.035x + 125
FOR: free-oscillation rheometry.
appropriate for monitoring higher concentrations of LMWH where the dose must be titrated to balance the risk of thrombosis and haemorrhage. It would be of clear clinical interest to com-pare FOR with the activated clotting time (ACT), which has shown somein vitropotential for monitoring LMWH [22].
Thrombin generation measures both anti-FXa and anti-FIIa activity and
therefore has clinical potential
Generation of thrombin (FIIa) is a key event in the coagulation process, and is dependent upon FXa. Measurement of thrombin generation therefore reflects both LMWH’s main effects: indi-rect inhibition of FXa and diindi-rect inhibition of thrombin itself.
The negative exponential relationship that we demonstrated between increasing concentra-tion of LMWH and thrombin generaconcentra-tion, and thrombin generaconcentra-tion’s very strong correlaconcentra-tion to anti-FXa activity mean that it would also be useful for monitoring the effect of LMWH. When al Dieri et al. found that the ETP had a much higher sensitivity (43% for aPTT and 93% for ETP) for low doses of UFH, they attributed this to the exponential dose-response curve of the ETP resulting in a high reduction of the ETP already at very low doses of UFH, rather than a higher accuracy or more stable normal value than the aPTT [13].
Figure 6. Relationship between aPTT measured using various reagents, and the logarithm of thrombin generation.SeeTable 3for correlation factors and regression lines. There is a negative linear relationship between aPTT and log10(ETP). Tinzaparin results in prolonged aPTT results compared to enoxaparin in the whole blood analyses (FOR and Hemochron Jr) at any given level of thrombin generation.
Figure 7. Relationship between anti-FXa activity and thrombin generation.Anti-FXa activity is strongly negatively correlated to the logarithm of ETP (Endogenous Thrombin Potential): Rsfor enoxaparin and tinzaparin are−0.93 and−0.94 respectively. Anti-FXa activity is more prolonged by enoxaparin than tinzaparin at any given level of thrombin generation.
Although thrombin generation appears to be a suitable method to estimate the anticoagula-tive effect of LMWH, it is noteworthy that the aPTT’s produced by tinzaparin and enoxaparin at equivalent levels of thrombin generation differ (seeFig. 6). This supports the concept that the two LMWH’s affect global coagulation by mechanisms other than pure thrombin-inhibition.
Strengths and weaknesses of the study
We are not aware of any previous study where several methods of aPTT measurement, anti-FXa activity and thrombin generation have simultaneously been tested with low molecular weight heparins with differing anti-FXa/anti-FIIa ratios. It is of particular clinical interest to bring to attention the finding that the anti-FXa is not a functional measure of anticoagulation.
Among the weaknesses of this study is that it is anin vitrostudy—enoxaparin and tinzaparin were administered directly into citrated blood samples rather than subcutanously into our volunteers. Another weakness is that all samples were taken from healthy men and not patients.
It is known that there is an interindividual variation in response to intravenous administra-tion of unfracadministra-tionated heparin to patients and after subcutaneous administraadministra-tion of LMWH to healthy volunteers [8,9]. We cannot in this study be sure whether the greatly increased stan-dard deviation of aPTT results at higher levels of LMWH was due to the methods used to mea-sure aPTT or to variation in the subjects’responses. We can, however, be sure that there was a significant difference between aPTT methods.
Conclusion
aPTT and anti-FXa display linear dose-responses to LMWH, although aPTT is less strongly correlated to the dose of LMWH than anti-FXa activity. There is some variation between aPTT assays. Tinzaparin increases aPTT and decreases thrombin generation more than enoxaparin at any given level of anti-FXa activity, which should lead to caution in interpreting clinical anti-FXa results. Thrombin generation with tissue factor-rich activator is a promising method for monitoring LMWH’s.
Supporting Information
S1 File. Raw data as tabulated text file. (TXT)
S2 File. Modification ofFig. 1displaying which aPTT methods gave statistically different results at each concentration of low molecular weight heparin (LMWH).Horizontal bars in-dicate a significant difference in aPTT results given by reagents at each concentration of LMWH as tested by the Wilcoxon signed rank test (P<0.05). The aPTT results given by the
ActinFSL reagent were significantly different from the other reagents at almost all concentrations.
(TIFF)
S3 File. Thrombin generation at increasing concentrations of LMWHa, measured using the TGA RB reagent.ETP (Endogenous Thrombin Potential) is strongly inhibited by LMWH. aLow Molecular Weight Heparin.
Acknowledgments
Fikrije Rakip and Margaretha D Persson, biomedical scientists, Coagulation Laboratory, Dept of Clinical Chemistry, Division of Laboratory Medicine, Skåne University Hospital, Malmö, Sweden.
Author Contributions
Conceived and designed the experiments: US KS NT. Performed the experiments: EL OT US KS. Analyzed the data: OT EL US KS. Contributed reagents/materials/analysis tools: US KS. Wrote the paper: OT EL KS NT US.
References
1. Gouin-Thibault I, Pautas E, Siguret V (2005) Safety profile of different low-molecular weight heparins used at therapeutic dose. Drug Saf 28: 333–349. PMID:15783242
2. Linkins LA, Julian JA, Rischke J, Hirsh J, Weitz JI (2002) In vitro comparison of the effect of heparin, enoxaparin and fondaparinux on tests of coagulation. Thromb Res 107: 241–244. PMID:12479885
3. Kitchen S, Jennings I, Woods TA, Preston FE (1996) Wide variability in the sensitivity of APTT reagents for monitoring of heparin dosage. J Clin Pathol 49: 10–14. PMID:8666677
4. Ip BK, Thomson AR, Moriarty HT (2001) A comparison of the sensitivity of APTT reagents to the effects of enoxaparin, a low-molecular weight heparin. Pathology 33: 347–352. PMID:11523938
5. Harris LF, Castro-Lopez V, Hammadi N, O’Donnell JS, Killard AJ (2010) Development of a fluorescent anti-factor Xa assay to monitor unfractionated and low molecular weight heparins. Talanta 81: 1725–
1730. doi:10.1016/j.talanta.2010.03.030PMID:20441964
6. Sibbing D, Spannagl M (2014) Direct oral anticoagulants and antiplatelet agents. Clinical relevance and options for laboratory testing. Hamostaseologie 34: 78–84. doi:10.5482/HAMO-13-11-0055PMID: 24301324
7. Greaves M (2002) Limitations of the laboratory monitoring of heparin therapy. Scientific and Standardi-zation Committee Communications: on behalf of the Control of Anticoagulation Subcommittee of the Scientific and Standardization Committee of the International Society of Thrombosis and Haemostasis. Thromb Haemost 87: 163–164. PMID:11848446
8. Benchekroun S, Eychenne B, Mericq O, Colombani A, Douste-Blazy P, et al. (1986) Heparin half-life and sensitivity in normal subjects and in patients affected by deep vein thrombosis. Eur J Clin Invest 16: 536–539. PMID:3104055
9. Al Dieri R, Alban S, Beguin S, Hemker HC (2006) Fixed dosage of low-molecular-weight heparins causes large individual variation in coagulability, only partly correlated to body weight. J Thromb Haemost 4: 83–89. PMID:16409456
10. Andrassy K, Eschenfelder V (1996) Are the pharmacokinetic parameters of low molecular weight hepa-rins predictive of their clinical efficacy? Thromb Res 81: S29–38. PMID:8822125
11. Gerotziafas GT, Petropoulou AD, Verdy E, Samama MM, Elalamy I (2007) Effect of the anti-factor Xa and anti-factor IIa activities of low-molecular-weight heparins upon the phases of thrombin generation. J Thromb Haemost 5: 955–962. PMID:17461929
12. Alban S, Welzel D, Hemker HC (2002) Pharmacokinetic and pharmacodynamic characterization of a medium-molecular-weight heparin in comparison with UFH and LMWH. Semin Thromb Hemost 28: 369–378. PMID:12244484
13. al Dieri R, Alban S, Beguin S, Hemker HC (2004) Thrombin generation for the control of heparin treat-ment, comparison with the activated partial thromboplastin time. J Thromb Haemost 2: 1395–1401. PMID:15304046
14. Gionis MN, Ioannou CV, Katsamouris AN, Katonis P, Balalis K, et al. (2013) The study of the thrombin generation mechanism and the effect of low molecular weight heparin as thromboprophylaxis in pa-tients undergoing total knee and hip replacement. Thromb Res 132: 685–691. doi:10.1016/j.thromres. 2013.09.037PMID:24182549
15. Meysman M, Haentjens P (2005) Pulmonary embolism: current treatment options. Curr Treat Options Cardiovasc Med 7: 483–490. PMID:16283976
17. Takemoto CM, Streiff MB, Shermock KM, Kraus PS, Chen J, et al. (2013) Activated partial thrombo-plastin time and anti-xa measurements in heparin monitoring: biochemical basis for discordance. Am J Clin Pathol 139: 450–456. doi:10.1309/AJCPS6OW6DYNOGNHPMID:23525615
18. Hainer JW, Barrett JS, Assaid CA, Fossler MJ, Cox DS, et al. (2002) Dosing in heavy-weight/obese patients with the LMWH, tinzaparin: a pharmacodynamic study. Thromb Haemost 87: 817–823. PMID: 12038783
19. Vermylen CG, Levin M, Lanham JG, Hardisty RM, Barratt TM (1987) Decreased sensitivity to heparin in vitro in steroid-responsive nephrotic syndrome. Kidney Int 31: 1396–1401. PMID:3613410
20. White RH, Ginsberg JS (2003) Low-molecular-weight heparins: are they all the same? Br J Haematol 121: 12–20. PMID:12670327
21. Kamal AH, Tefferi A, Pruthi RK (2007) How to interpret and pursue an abnormal prothrombin time, activated partial thromboplastin time, and bleeding time in adults. Mayo Clin Proc 82: 864–873. PMID: 17605969

