www.biogeosciences.net/12/4875/2015/ doi:10.5194/bg-12-4875-2015
© Author(s) 2015. CC Attribution 3.0 License.
Are recent changes in sediment manganese sequestration in the
euxinic basins of the Baltic Sea linked to the expansion of hypoxia?
C. Lenz1, T. Jilbert2, D.J. Conley3, M. Wolthers3, and C.P. Slomp3
1Department of Geology, Lund University, Sölvegatan 12, 22362 Lund, Sweden
2Department of Earth Sciences, Faculty of Geosciences, Utrecht University, Budapestlaan 4,
3584 CD Utrecht, the Netherlands
3University College London, Department of Chemistry, 20 Gordon Street, London, WC1H 0AJ, UK Correspondence to:C. Lenz ([email protected])
Received: 11 April 2014 – Published in Biogeosciences Discuss.: 25 June 2014 Revised: 17 July 2015 – Accepted: 21 July 2015 – Published: 19 August 2015
Abstract.Expanding hypoxia in the Baltic Sea over the past century has led to the development of anoxic and sulfidic (eu-xinic) deep basins that are only periodically ventilated by in-flows of oxygenated waters from the North Sea. In this study, we investigate the potential consequences of the expanding hypoxia for manganese (Mn) burial in the Baltic Sea using a combination of pore water and sediment analyses of dated sediment cores from eight locations. Diffusive fluxes of dis-solved Mn from sediments to overlying waters at oxic, hy-poxic and euxinic sites are consistent with an active release of Mn from these areas. Although the present-day fluxes are significant (ranging up to ca. 240 µmol m−2d−1),
compari-son to published water column data suggests that the current benthic release of Mn is small when compared to the large pool of Mn already present in the hypoxic and anoxic water column. Our results highlight two modes of Mn carbonate formation in sediments of the deep basins. In the Gotland Deep area, Mn carbonates likely form from Mn oxides that are precipitated from the water column directly following North Sea inflows. In the Landsort Deep, in contrast, Mn car-bonate and Mn sulfide layers appear to form independently of inflow events, and are possibly related to the much larger and continuous input of Mn oxides linked to sediment focusing. Whereas Mn-enriched sediments continue to accumulate in the Landsort Deep, this does not hold for the Gotland Deep area. Here, a recent increase in euxinia, as evident from mea-sured bottom water sulfide concentrations and elevated sed-iment molybdenum (Mo), coincides with a decline in sedi-ment Mn content. Sedisedi-ment analyses also reveal that recent inflows of oxygenated water (since ca. 1995) are no longer
consistently recorded as Mn carbonate layers. Our data sug-gest that eutrophication has not only led to a recent rise in sulfate reduction rates but also to a decline in reactive Fe in-put to these basins. We hypothesize that these factors have jointly led to higher sulfide availability near the sediment– water interface after inflow events. As a consequence, the Mn oxides may be reductively dissolved more rapidly than in the past and Mn carbonates may no longer form. Using a simple diagenetic model for Mn dynamics in the surface sediment, we demonstrate that an enhancement of the rate of reduction of Mn oxides is consistent with such a scenario. Our results have important implications for the use of Mn carbonate en-richments as a redox proxy in marine systems.
1 Introduction
dissolved Mn availability thought to be the key control (Neu-mann et al., 2002). Nevertheless, sediment Mn data for both the Landsort Deep in the Baltic Sea (Lepland and Stevens, 1998) and the Black Sea (Lyons and Severmann, 2006) indi-cate that Mn enrichments may also form in sediments over-lain by continuously anoxic bottom waters. In the Landsort Deep, these enrichments consist of both Mn carbonates and Mn sulfides (Lepland and Stevens, 1998; Suess, 1979). The formation of Mn carbonate is assumed to be driven by an exceptionally high alkalinity derived from sulfate reduction, whereas Mn sulfides form when H2S exceeds Fe availability
(Böttcher and Huckriede, 1997; Lepland and Stevens, 1998). Some Mn may also be incorporated in pyrite (e.g. Huerta-Diaz and Morse, 1992; Jacobs et al., 1985), but the amounts are relatively minor when compared to those present in Mn carbonate, as shown in a recent study on Baltic Sea sediments (Lenz et al., 2014). Finally, Mn enrichments may also form in sediments overlain by oxic bottom waters upon increased in-put and precipitation of Mn oxides and transformation to Mn carbonate during burial (e.g. Macdonald and Gobeil, 2012). A better understanding of the various modes of formation of sedimentary Mn and the link with variations in bottom water redox conditions is essential when interpreting Mn en-richments in geological deposits (e.g. Calvert and Pedersen, 1996; Huckriede and Meischner, 1996; Jones et al., 2011; Meister et al., 2009).
Redox-dependent dynamics of Mn have been studied ex-tensively in the Baltic Sea (e.g. Huckriede and Meischner, 1996; Lepland and Stevens, 1998; Neumann et al., 2002) and are of interest because of the large spatial and temporal variations in bottom water oxygen conditions over the past century that have been particularly well documented since the 1970’s (Fonselius and Valderrama, 2003). The available hydrographic data provide evidence for sporadic inflows of oxygenated saline water from the North Sea that affect brack-ish bottom waters in all deep basins (Matthäus and Franck, 1992; Matthäus et al. 2008). Since the end of the 1970’s, the frequency of North Sea inflows has declined from mul-tiple events per decade to only one inflow per decade (e.g. Mohrholz et al., 2015). Between inflows, when bottom ters in the deep basins of the Baltic Sea are anoxic, pore wa-ters in the surface sediments are typically assumed to be un-dersaturated with respect to Mn carbonates down to a depth of ∼5 to 8 cm, based on saturation state calculations for idealized minerals (Carman and Rahm, 1997; Heiser et al., 2001). Mn oxides that formed during oxic inflows and set-tled in the surface sediment will dissolve upon subsequent exposure to reducing pore water or overlying water. This is thought to lead to high dissolved Mn concentrations in the pore water during – and shortly after – the inflow events. The high Mn concentrations may lead in turn to strong oversat-uration with respect to Mn carbonates, although this has not been proven due to the lack of real-time studies during in-flow events (Huckriede and Meischner, 1996; Sternbeck and Sohlenius, 1997; Heiser et al., 2001). Furthermore, high Mn
concentrations must coincide with sufficiently high alkalin-ity for Mn carbonate precipitation to initiate (Lepland and Stevens, 1998). Despite these uncertainties, various authors have correlated historically-recorded inflow events to spe-cific accumulations of Mn carbonate in sediments of the Got-land Basin (e.g. Heiser et al., 2001; Neumann et al., 1997).
Hydrographic data also indicate a major expansion of the hypoxic area in the Baltic Sea over the past century. This expansion is primarily caused by increased eutrophi-cation, implying that the oxygen demand in deeper waters has increased as a result of higher organic matter supply (Carstensen et al., 2014; Conley et al., 2009; Gustafsson et al., 2012; Savchuk et al., 2008). While the shallower areas in the Baltic Sea are now seasonally hypoxic, the deep basins all show a major shift towards anoxic and sulfidic (euxinic) con-ditions around 1980 (Fonselius and Valderrama, 2003; Mort et al., 2010). These basin-wide changes in redox conditions likely had a major impact on both the sources and sinks of sediment Mn in the Baltic Sea.
River input (Ahl, 1977; Martin and Meybeck, 1979) and release from sediments (Sundby et al., 1981; Yeats et al., 1979) are the key sources of Mn in the water column of marine coastal basins. Whereas in areas with oxic bottom waters, dissolved Mn produced in the sediment will mostly be oxidized to Mn oxide in the surface layer and thus will be trapped in the sediment, dissolved Mn may escape to the overlying water when the oxic surface layer is very thin (Slomp et al., 1997). In the water column, this Mn may be oxidized again (e.g. Dellwig et al., 2010; Turnewitsch and Pohl, 2010) and contribute to the depositional flux of Mn oxides (Mouret et al., 2009), or may be laterally transferred in dissolved or particulate form. The lateral transfer of Mn from oxic shelves to deep basins, where the Mn may be trapped and ultimately may precipitate as authigenic min-erals, is termed the “Mn shuttle” (Lyons and Severmann, 2006).
During the expansion of hypoxia and anoxia, as observed in the Baltic Sea over the past century (Conley et al., 2009), the Mn shuttle likely became more efficient in transporting Mn to deeper, euxinic basins because of decreased trapping of Mn in oxygenated surface sediments (Lyons and Sever-mann, 2006). However, during an extended period of hypoxia and anoxia, sediments in hypoxic areas may become depleted of Mn oxides, thus reducing the strength of the Mn shuttle from oxic and hypoxic shelves to the deep basins. In addi-tion, the formation rate of authigenic Mn minerals in deep basin sediments may change in response to bottom water hy-poxia and anoxia. If release of dissolved Mn2+
car-bonates. This mechanism was recently invoked to explain the lack of Mn carbonates in the sediment during periods of bot-tom water euxinia in the Gotland Deep during the Holocene Thermal Maximum (Lenz et al., 2014). A reduced shuttling of Fe oxides from shelves linked to expanding hypoxia (e.g. Lyons and Severmann, 2006) could contribute to this mecha-nism by reducing the buffering capacity of the sediments for sulfide (Diaz and Rosenberg, 2008). If alkalinity production is the key control, however, as suggested for the Landsort Deep (Lepland and Stevens, 1998), Mn sequestration would be expected to be similar or increase due to higher rates of sulfate reduction.
In this study, we use geochemical analyses of dated sed-iment cores for eight sites in the Baltic Sea, combined with pore water data to assess the role of variations in water col-umn redox conditions for Mn dynamics in surface sediments in the Baltic Sea. We capture the full range of redox condi-tions (oxic, hypoxic and euxinic) to investigate the cycling of Mn in the sediment, the present-day diffusive flux from the sediments and the sequestration of Mn in mineral phases. Whereas the pore water data only provide a snapshot of the conditions at the time of sampling, the sediment data in the euxinic basins record both the expansion of hypoxia and anoxia and the effects of short-term inflows of oxygenated North Sea water. Our results indicate release of Mn from oxic and hypoxic areas as well as the deep basin sites, and sequestration of Mn carbonates and sulfides in the Landsort Deep. The lack of recent Mn accumulation at various deep basin sites suggests that inflows of oxygenated seawater are no longer consistently recorded by Mn carbonate deposits in these settings.
2 Materials and methods 2.1 Study area
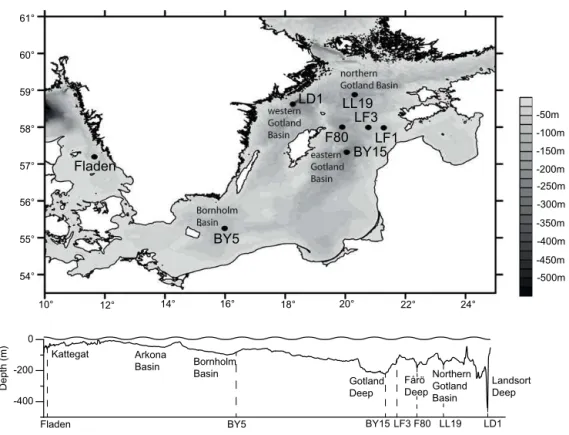
Fine-grained, highly porous sediments from eight locations in the southern and central Baltic Sea were collected dur-ing four cruises between 2007 and 2011 (Fig. 1, Table 1) using a multi-corer. The sites differ with respect to their wa-ter depths and their present-day bottom wawa-ter redox condi-tions. The Fladen and LF1 sites are located in the Kattegat and along the eastern side of the Gotland Deep, respectively, and are fully oxic, whereas site BY5 in the Bornholm Basin is seasonally hypoxic (Jilbert et al., 2011; Mort et al., 2010). The remaining stations, LF3, LL19, BY15 (Gotland Basin), F80 (Fårö Deep) and LD1 (Landsort Deep), are situated be-low the redoxcline, which was located between 80 and 120 m water depth at the time of sampling. Therefore, bottom wa-ters at these sites were all anoxic and sulfidic (euxinic). The latter four sites are located in the deep central basins of the Baltic Sea, at water depths ranging from 169 m at LL19 to 416 m at LD1. When sampling the sediment at these sites, the weights of the multi-corer were reduced and the frame of the
multi-corer was modified to prevent it from sinking into the soft sediment, allowing the retrieval of undisturbed sediment cores with overlying water. Water column data for oxygen and hydrogen sulfide for LL19 and LD1 (as recorded at LL23 as a nearby station) are available from the ICES Dataset on Ocean Hydrology (2014). The sampling as well as selected pore water and sediment analyses for many of our sites have been described previously (Mort et al., 2010; Jilbert et al., 2011; Jilbert and Slomp, 2013a). For completeness, all pro-cedures are described below.
2.2 Bottom water and pore water analyses
A bottom water sample was taken from the water overlying the sediment in each multicore as soon as possible after core collection. At each site, sediment multicores (<50 cm, 10 cm i.d.) were either immediately sectioned in a N2-filled
glove-box at in situ temperature or sampled with syringes from which the top was cut off and that were pushed into the sed-iment through taped, pre-drilled holes in the core liner. The tape was cut with a sharp object directly prior to inserting the syringe. A small portion of each sample was stored at 5◦C or −20◦
C in gas-tight jars for sediment analyses. The remain-ing sediment was centrifuged (10–30 min; 2500 g) in 50 mL Greiner tubes to collect pore water. Both the pore water and a bottom water sample were filtered (0.45 µm pore size) and subdivided for later laboratory analyses. All pore water han-dling prior to storage was performed in a N2atmosphere. A
subsample of 0.5 mL was directly transferred to a vial with 2 mL of a 2 % Zn-acetate solution for analysis of hydrogen sulfide. Sulfide concentrations were determined by complex-ation of the ZnS precipitate using phenylenediamine and fer-ric chloride (Stfer-rickland and Parsons, 1972). The relative pre-cision of the sulfide analyses determined for replicate sam-ples was<10 %. Subsamples for total Mn, Fe, Ca and S were acidified with either HNO3(Fladen, BY5) or HCl (all other
stations) and stored at 5◦C until further analysis by
induc-tively coupled plasma optical emission spectroscopy (ICP-OES; Perkin Elmer Optima 3000; relative precision and ac-curacy as established by standards (ISE-921) and duplicates were always<5 %). Hydrogen sulfide was assumed to be released during the initial acidification, thus S is assumed to represent SO2−
4 only. Total Mn and Fe are assumed to
repre-sent Mn2+and Fe2+although in the former case, some Mn3+
may also be included (Madison et al., 2011). Subsamples for NH4were frozen at−20◦C until spectrophotometric
analy-sis using the phenol hypochlorite method (Riley, 1953). The relative precision of the NH+4 analyses was <5 %. A final subsample was used to determine the pH with a pH electrode and meter (Sentron). We note that degassing of CO2may
61°
60°
59°
58°
56° 57°
55°
54°
10° 12° 14° 16° 18° 20° 22° 24°
-50m -100m -150m -200m -250m -300m -350m -400m -450m -500m
Fladen
BY5
BY15 F80
LF3 LF1 LL19 LD1
-400 -200 0
Kattegat Arkona
Basin Bornholm Basin
Gotland Deep
Landsort Deep
Fladen BY5 BY15 LF3 F80 LL19 LD1
Depth (m)
Bornholm Bornholm Basin Basin
eastern eastern Gotland Gotland Basin Basin
northern northern Gotland Basin Gotland Basin
western western Gotland Gotland Basin Basin
Fårö Deep
Northern Gotland Basin
Figure 1.Bathymetric map and depth profile of the Baltic Sea showing the locations of the sampling sites.
0.05 meq/L. All colorimetric analyses were performed with a Shimadzu spectrophotometer.
At four deep basin sites (LL19, BY15, F80, LD1), a sec-ond multicore was sampled and analysed for methane as de-scribed by Jilbert and Slomp (2013a). Briefly, a cut-off sy-ringe was inserted into a pre-drilled, taped hole at 1.5 cm intervals directly after core collection. Precisely 10 mL wet sediment was extracted from each hole and transferred im-mediately to a 65 mL glass bottle filled with a saturated sodium chloride (NaCl) solution. This bottle was then closed with a rubber stopper and screw cap, and a headspace of 10 mL N2 gas was inserted. The bottles were shaken and
then stored upside down at room temperature for ca. 1 month before analysis in the laboratory at Utrecht. Selected sam-ples were analysed again after 1 year and gave identical re-sults. Methane was assumed to be quantitatively salted out into the headspace during the equilibration process. As de-termined by O’Sullivan and Smith (1970), methane is effec-tively insoluble in a NaCl solution of molality 4 at 100 at-mosphere pressure and 51◦C. In our case, the molality of the
saturated salt solution was ∼5, pressure was 1 atmosphere and temperature was 25◦C. As shown by the same authors,
methane solubility declines with increasing salinity and de-creasing pressure and is effectively independent of temper-ature, so our assumption of insolubility is valid. A similar method has been employed successfully by e.g. Mastalerz et al. (2009). Methane concentrations in the headspace of the glass bottles were determined by injection of a subsample
into a Thermo Finnigan Trace GC gas chromatograph (flame ionization detector, Restek Q-PLOT column of 30 m length, 0.32 mm internal diameter, oven temperature 25◦C). Data
were then back-calculated to the original pore water concen-trations using the measured porosities (see Sect. 2.3). Be-cause of degassing, which is unavoidable at sites with very high CH4concentrations, the CH4profile at LD1 is expected
to have a larger error than at other sites, and likely represents a minimum estimate of the true concentrations.
2.3 Sediment analyses
Sediment samples were freeze-dried and water contents and porosities were calculated from the weight loss, assuming a sediment density of 2.65 g cm−3. Sediments were then
ground in an agate mortar in a N2or argon-filled glovebox.
Table 1.Characteristics of the eight study sites in the Baltic Sea. Redox: bottom water redox conditions at the time of sampling. Pore water samples were obtained during every cruise and were similar between years at each station. Here, the most complete data sets for each station are presented. Average sedimentation rates for the last 30 years are based on210Pb dating.
Site name Location Cruise Position Water Sedimentation Redox Salinity
depth rate
(m) (cm yr−1)
Fladen Fladen R/VSkagerak
Sept. 2007
57◦11.57 N
11◦39.25 E
82 1.0 oxic 34.2
LF1 Northern
Gotland Basin
R/VAranda May/June 2009
57◦58.95 N
21◦16.84 E
67 0.25 oxic 8.2
BY5 Bornholm
Basin
R/VSkagerak Sept. 2007
55◦15.16 N
15◦59.16 E
89 0.23 O2=4.0 µM 16.2
LF3 Eastern
Gotland Basin
Sediment: R/VAranda May/June 2009 Pore water: R/VPelagia May 2011
57◦59.50 N
20◦46.00 E
95 0.50 H2S=2.9 µM 10.1
LL19 Northern
Gotland Basin
Sediment: R/VAranda May/June 2009 Pore water: R/VHeincke July 2010
58◦52.84 N
20◦18.65 E
169 0.30 H2S=19.9 µM 11.4
BY15 Gotland Deep Sediment R/VAranda May/June 2009 Pore water: R/VHeincke July 2010
57◦19.20 N
20◦03.00 E
238 0.27 H2S=74.1 µM 12.5
F80 Fårö Deep Sediment:
R/VAranda May/June 2009 Pore water: R/VHeincke July 2010
58◦00.00 N
19◦53.81 E
191 0.55 H2S=45.6 µM 12.0
LD1 Landsort Deep R/VPelagia May 2011
58◦37.47 N
18◦15.23 E
416 0.77 anoxic and sulfidic 10.6
an HF/HClO4/HNO3 mixture in closed Teflon bombs at
90◦C, followed by evaporation of the solution and
redissolu-tion of the remaining gel in 1M HNO3(Passier et al., 1999).
The accuracy and precision of the measurements were estab-lished by measuring laboratory reference materials (ISE-921
and in-house standards) and sample replicates; relative errors were<5 % for all reported elements. The detection limits of ICP-OES for Mn, Mo, Ca, Fe, Al and S in the HNO3
so-lution are 0.6, 14, 5, 6 and 24 µg kg−1and 0.28 mg kg−1,
corrected for the weight of the salt in the pore water using the ambient salinity and porosity.
Age models based on 210Pb analyses for six multicores used in this study have been previously published. For de-tails, we refer the reader to the relevant studies: Fladen and BY5 (Mort et al., 2010), LF1 and LF3 (Jilbert et al., 2011), LL19 (Zillén et al., 2012) and BY15 (Jilbert and Slomp, 2013b). A new 210Pb age model was constructed for LD1.
Samples from the Landsort Deep (LD1) were analysed with a Canberra BeGe gamma-ray spectrometer at Utrecht Uni-versity. The samples were freeze-dried, homogenized, and transferred into vent-free petri dishes, which were sealed in polyethylene bags and stored for 2 weeks before the mea-surement was taken. Each sample was measured until 200– 250210Pb gamma-ray counts were reached. For the age de-termination, a constant rate of supply model (Appleby and Oldfield, 1983) was implemented using a background esti-mated from the mean counts of214Pb and214Bi. For further details on the age models and the 210Pb data for LD1, we refer to Supplement 1.
The age model for the site in the Fårö Deep (F80) was constructed using high-resolution Mo and Mn data. In 2013, an extra sediment core was taken from this station. Mini sub-cores of the upper sediments were embedded in Spurr’s epoxy resin and measured by laser ablation-inductively cou-pled plasma mass spectrometry (LA-ICP-MS) line scanning (see Sect. 2.4). Due to non-linear compaction of the sed-iments during the embedding procedure, the depth scale of the LA-ICP-MS data was adjusted by alignment to dis-crete sample data from the corresponding core section (not shown). Subsequently, fluctuations in Mo/Al and Mn/Al ratios were compared with instrumental records of bottom water oxygen conditions, and ages were assigned to features in the Mo/Al and Mn/Al profiles (Supplement 1; Fig. S2). The adjustment of the depth scale and the allocation of ages allowed sedimentation rates to be estimated (Supplement 1; Fig. S3). The 2009 multicore profiles from F80 were then tuned to the dated profiles from 2013 (see Supplement 1 for more details).
2.4 Microanalysis
Mini sub-cores of 1 cm diameter and up to ∼12 cm length each were taken from the top part of sediment multicores at sites LL19 and LD1 in May 2011 as described in detail by Jilbert and Slomp (2013b). Briefly, the pore water was replaced by acetone and the sub-core was fixed in Spurr’s epoxy resin. During the whole procedure the sub-cores re-mained upright. During the dewatering process the sediment compacted resulting in a reduction of length of both sections by up to 50 %. After curing, epoxy-embedded sub-cores were opened perpendicular to the plane of sedimentation and the exposed internal surface was polished.
Line scans were performed with LA-ICP-MS, to measure high-resolution vertical profiles of selected elements in the
resin blocks of the two cores (Hennekam et al., 2015). A Lambda Physik laser with a wavelength of 193 nm and pulse rate of 10 Hz was focused onto the sample surface with a spot size of 120 µm. During line scanning, the sample was moved under the laser beam at 0.0275 mm/s, creating an overlapping series of pulse craters. From the closed sam-ple chamber, the ablated samsam-ple was transferred to a Micro-mass Platform ICP-MS by He-Ar carrier gas. Specific iso-topes of aluminum (27Al), iron (57Fe), manganese (55Mn),
sulfur (34S) and molybdenum (98Mo) were measured. For site LD1, bromine (81Br) was also measured. LA-ICP-MS data for each element were calibrated by reference to the sensitivities (counts/ppm) of the glass standard NIST SRM 610 (Jochum et al., 2011) and corrected for the natural abun-dances of the analysed isotopes. All data are reported normal-ized to Al to correct for variations in sample yield. For S/Al data, a further sensitivity factor was applied which compen-sates for the contrasting relative yield of S from NIST SRM 610 with respect to embedded sediments.
The resin-embedded samples were also mounted inside an EDAX Orbis Micro-XRF Analyzer to construct elemental maps at a spatial resolution of 30 µm for manganese (Mn), calcium (Ca) and sulfur (S) (Micro-XRF settings: Rh tube at 30 kV, 500 µA, 300 ms dwell time, 30 µm capillary beam). 2.5 Flux calculations
The diffusive flux of manganese across the sediment–water interface (Jsed) was calculated from the concentration
gradi-ent that was obtained from the difference in concgradi-entration in the bottom water and the first pore water sample (with the depths of this first sample ranging from 0.25 to 2.5 cm) us-ing Fick’s first law for six sites, assumus-ing that most dissolved Mn is in the form of Mn2+:
Jsed= −φDsed
dCMn2+
dx , (1)
whereϕ is the porosity (as listed in Supplement 2),Dsedis
the whole sediment diffusion coefficient for dissolved Mn2+,
Cis the dissolved Mn2+concentration and x is depth in the
sediment.Dsedwas calculated from the diffusion coefficient
of Mn2+ in free solution corrected for ambient salinity and
temperature (DSW) and porosity (Boudreau, 1997): Dsed= DSW
(1−lnφ2). (2)
Whenever possible (LL19, BY15 and F80), higher resolution data from the 2009 Aranda cruise were used for the calcula-tion (Table 2 and data in Supplement 2).
2.6 Saturation state
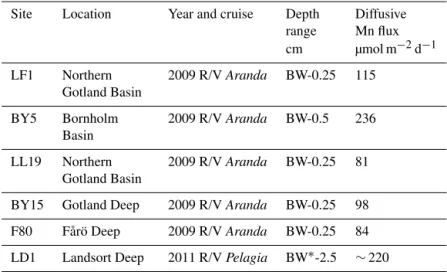
Table 2.Diffusive fluxes of Mn across the sediment–water interface at all six sites. For further details, see text. For the bottom water and pore water data, see Supplement 2.
Site Location Year and cruise Depth Diffusive range Mn flux cm µmol m−2d−1
LF1 Northern Gotland Basin
2009 R/VAranda BW-0.25 115
BY5 Bornholm Basin
2009 R/VAranda BW-0.5 236
LL19 Northern Gotland Basin
2009 R/VAranda BW-0.25 81
BY15 Gotland Deep 2009 R/VAranda BW-0.25 98
F80 Fårö Deep 2009 R/VAranda BW-0.25 84
LD1 Landsort Deep 2011 R/VPelagia BW∗-2.5 ∼220
∗
LD1 has no measured bottom water sample. Therefore, the flux was estimated using the bottom water value from the Landsort Deep site BY31 from Mort et al. 2010.
(Parkhurst and Appelo, 1999) with the LLNL database. Our calculations should be seen as approximations with the main purpose of providing a comparison to previous calculations by Carman and Rahm (1997) and Heiser et al. (2001) to as-sess whether there are any indications for a change in sat-uration state of the pore water between inflows. The LLNL database does not contain the authigenic carbonate phases present in the Baltic Sea. Data from the literature (Jakobsen and Postma, 1989; Sternbeck and Sohlenius, 1997; Lepland and Stevens, 1998; Huckriede and Meischner 1996; Kulik et al., 2000) suggest that Baltic carbonates are predominantly Mn carbonates with a substantial contribution of Ca. There-fore, an approximation of the solubility product of (Mn, Ca) CO3solid solutions was generated using the equations given
in Katsikopoulos et al. (2009). The stoichiometric solubility product (Kst) was calculated using Mn0.74Ca0.26CO3(Kulik
et al., 2000) as a common ratio measured for (Mn, Ca) CO3
solid solutions in Baltic Sea sediments.
An equilibrium constant pK of 0.377 (Emerson et al., 1983) was used for Mn sulfide. The solubility of iron sulfide from Rickard (2006) was added to the database as well as MnHS+as a solute (Luther et al., 1996) because it is likely
abundant in pore water in sulfidic sediments (Heiser et al., 2001). At sites LF3 and LD1, Fe2+was below the detection
limit and the calculation of the saturation state with respect to FeS could not be performed. Carbonate alkalinity was cal-culated from titration alkalinity as described by Carman and Rahm (1997).
2.7 Diagenetic model for Mn
A simple diagenetic model for Mn was developed to assess the potential effect of changes in the kinetics of reductive dis-solution of Mn oxides to dissolved Mn2+and subsequent Mn
carbonate formation in Baltic Sea surface sediments follow-ing an inflow event. Our modellfollow-ing is generic and addresses this research question only. Therefore, we do not attempt to describe all the relevant processes potentially controlling Mn carbonate formation in the sediment nor do we focus on a specific location. The model accounts for two biogeochem-ical processes: reductive dissolution of Mn oxides to Mn2+
and precipitation of Mn2+in the form of Mn carbonates.
Em-pirical rate laws for Mn oxide reduction and Mn carbonate formation are assumed, with rates depending on first-order rate constants for both processes (kredandkprec) and the
sed-iment concentration of Mn oxide and dissolved Mn2+,
re-spectively (Berner, 1980; Slomp et al., 1997). The use of a first-order rate constant for a process that is more complex, does not imply that all other factors are ignored. Instead, it implies that all other factors are combined in the first-order rate constant (Berner, 1980). Here, the dependence of the rate of Mn carbonate formation on only dissolved Mn implies that we assume that alkalinity is never limiting for Mn carbonate formation. Transport is assumed to occur through diffusion (Mn2+) and sediment burial (Mn2+and both solids).
Poros-ity (ϕ), temperature, sediment density (ρs) and rates of
∂CMn2+
∂t =DMn2+
∂2CMn2+
∂x2 −ω ∂CMn2+
∂x −kprecCMn2+
+ρs(1 −φ)
φ kredCMnoxide (3) ∂CMnoxide
∂t = −ω
∂CMnoxide
∂x −kredCMnoxide (4) ∂CMnCO3
∂t = −ω
∂CMnCO3
∂x +
φ ρs(1−φ)
kprecCMn2+, (5)
whereCMn2+,CMn
oxideandCMnCO3 are the concentrations of dissolved Mn2+, Mn oxides and MnCO
3, respectively and DMn2+ is the diffusion coefficient of dissolved Mn2+as
de-fined in Eq. (2). The model code was written in R using the marelac (Soetaert et al., 2010) and ReacTran (Soetaert and Meysman, 2012) packages. The model domain is represented by a one-dimensional grid of 1000 cells that captures the in-terval from the sediment–water interface to a depth of 1 cm. Environmental parameters typical for surface sediments in the deep basins of the Baltic Sea and boundary conditions were assumed as defined in Table 3.
Here, we assess a scenario for Baltic Sea sediments where Mn oxides are deposited during a period of oxic bottom wa-ter conditions for 4 months directly afwa-ter a North Sea inflow followed by a period of 2 months in which no Mn oxides are deposited because of the return of bottom water anoxia (Ta-ble 3; Sect. 4.1). We assume that there is no Mn in the sedi-ment (in any form) at the start of the scenario, consistent with Mn being low or absent in surface sediments in the Gotland Basin between inflows (Fig. 4). We set kprec to 5000 yr−1,
placing the maximum rate of Mn carbonate formation in the model calculations in the upper range given by Wang and Van Cappellen (1996). We then assess the response of ben-thic fluxes of Mn2+, rates of formation of Mn carbonate in
the sediment and profiles of the various Mn forms to varia-tions inkredwhen assuming values of either 0.1, 1, 10, 100 or
1000 yr−1during 4 months of the simulation followed by a
period of 2 months with akredof 1000 yr−1(i.e. representing
rapid Mn oxide reduction after the return of anoxic condi-tions). By varying kred, we wish to capture a wide range in
the availability of reductants for Mn oxides in the surface sediment. Values ofkredestimated for different sedimentary environments overlain by oxic bottom waters in the North Sea range from 0.04 to 150 yr−1 (Slomp et al., 1997). The
slightly wider range assumed here is reasonable because of the more important role of anaerobic pathways of organic matter degradation in deep basin sediments of the Baltic Sea compared to those in the North Sea (e.g. Mort et al., 2010 vs. Slomp et al., 1997). To assess the robustness of our results, we also perform the same simulations with even higherkprec
values (up to 30 000 yr−1).
3 Results
At the time of sampling, bottom waters were oxic at the Fladen and LF1 sites in the eastern Gotland Basin, hypoxic at the Bornholm Basin site BY5, and anoxic and sulfidic at all other locations (Table 1). Pore water Mn concentrations increase with depth in the sediment at most sites (Fig. 2; Supplement 2). At the Fladen site, however, pore water Mn concentrations decrease again below ca. 5 cm and at the east-ern Gotland Basin sites LF1 and LF3, Mn concentrations are lower than at other sites. Pore water Fe shows a subsurface maximum at the Fladen and LF1 sites, but is low or absent at all other sites. Pore water Ca2+concentrations show little
change with depth and are consistent with the salinity gra-dient in the Baltic Sea. Alkalinity and ammonium concen-trations increase with sediment depth simultaneously with a decline in sulfate. CH4 is present at depth where sulfate is
depleted at the sites in the Fårö Deep (F80) and Landsort Deep (LD1) (Supplement 2). Similar to Ca2+
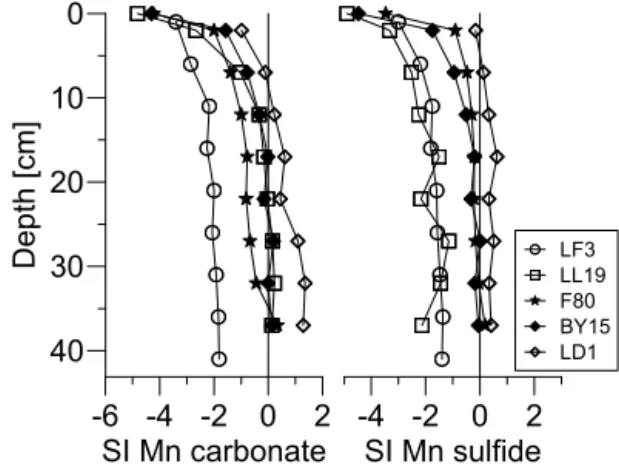
, sulfate con-centrations in the bottom water at the different stations are consistent with the salinity gradient in the Baltic Sea (Ta-ble 1). Concentrations of hydrogen sulfide in the pore wa-ter>2 mM are found at the Fårö Deep and Landsort Deep sites F80 and LD1. The pore waters are supersaturated with respect to Mn carbonate below the surface sediment at the Landsort Deep. With the exception of LF3, the other hypoxic and anoxic sites reach saturation only at greater depth. For Mn sulfide, in contrast, supersaturation is only observed at the Landsort Deep site, LD1 (Fig. 3) and below 35 cm at site F80. Pore waters were supersaturated with respect to FeS at the sites in the northern Gotland Basin (LL19), in the Gotland Deep (BY15) and Fårö Deep (F80) (Supllement 2). We note that degassing of CO2 during centrifugation may have led
to a shift in pH to higher values, thereby enhancing the de-gree of saturation with respect to carbonate and sulfide min-erals. Nevertheless, an upward shift of ca. 0.5 pH units due to this effect would not greatly affect the observed trends with depth and contrasts between stations in the calculated satura-tion states presented. Calculated diffusive fluxes of dissolved Mn vary from 81 to 236 µmol m−2d−1, with the highest
ef-flux from the sediment being observed at the hypoxic Born-holm Basin site BY5 and in the anoxic Landsort Deep (LD1) (Table 2).
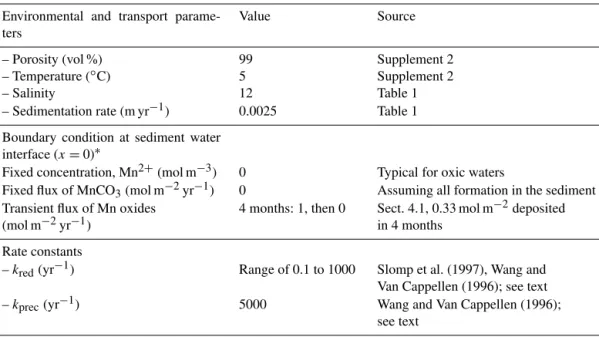
Table 3.Environmental parameters, boundary conditions (wherex=0 refers to the sediment–water interface andx=1 cm refers to a depth of 1 cm in the sediment) and first-order rate constants used in the simple diagenetic model for Mn for a “typical” Gotland Basin sediment, including the sources, where relevant.
Environmental and transport parame-ters
Value Source
– Porosity (vol %) 99 Supplement 2
– Temperature (◦C) 5 Supplement 2
– Salinity 12 Table 1
– Sedimentation rate (m yr−1) 0.0025 Table 1
Boundary condition at sediment water interface (x=0)∗
Fixed concentration, Mn2+(mol m−3) 0 Typical for oxic waters
Fixed flux of MnCO3(mol m−2yr−1) 0 Assuming all formation in the sediment Transient flux of Mn oxides
(mol m−2yr−1) 4 months: 1, then 0 Sect. 4.1, 0.33 mol m
−2deposited in 4 months
Rate constants
–kred(yr−1) Range of 0.1 to 1000 Slomp et al. (1997), Wang and Van Cappellen (1996); see text
–kprec(yr−1) 5000 Wang and Van Cappellen (1996);
see text
∗For all chemical species a zero-gradient boundary condition was specified at the bottom of the model domain.
clays, are consistent with the presence of fine-grained sedi-ments throughout the cores (Supplement 2). Total sulfur con-tents are low at Fladen, but are higher at all other sites, and show considerable variation with depth in the sediment. Mn is enriched in the surface sediment at Fladen, but is nearly absent at the LF1, BY5 and LF3 sites. At sites LL19, BY15 and F80, Mn is present but mostly observed at greater depth in the sediment. The upper 30 cm of the sediment at site LD1 is highly enriched in Mn. Sediment Ca is high at Fladen, is enriched in the surface sediment at site LF1, is low at sites BY5, LF3 and LL19 and follows the pattern in Mn at sites BY15, F80 and LD1. Sediment Fe typically ranges from 2 to 6 wt % and there is a trend towards lower Fe contents in the upper 5 to 20 cm of the sediment, following an initial max-imum at the bottom of the TOC-rich interval at many sites (Supplement 2). This upward declining trend is even more apparent when the Fe contents are normalized to Al (Fig. 4). Sediment Mo is low at the Fladen, LF1, BY5 and LF3 sites but is enriched at the other sites, where profiles largely follow those of TOC (Fig. 4).
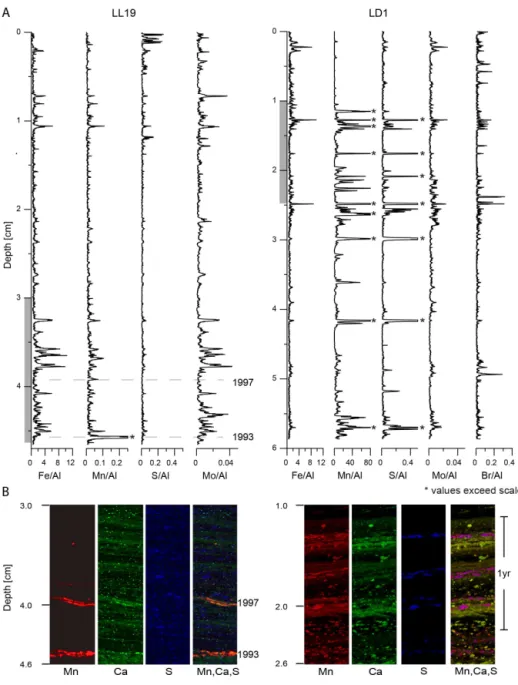
The LA-ICP-MS line scans of resin-embedded surface sediments at site LL19 in the northern Gotland Basin (Fig. 5a) support the results of the discrete sample analysis (Fig. 4) and confirm that there are very few Mn-rich lam-inae in recent sediments at this location. Whereas most of the minor enrichments of Mn are correlated with Fe, S and Mo (Fig. 5a), three peaks (at 3.6, 3.9 and 4.6 cm) are inde-pendent of these elements, suggesting that these Mn enrich-ments dominantly consist of carbonates. This is confirmed by the Micro-XRF maps (Fig. 5b) of the corresponding
in-terval, which indicate coincident Mn and Ca-rich layers. The maps show clear Mn carbonate layers at∼3.9 and∼4.6 cm. A third enrichment at 3.6 cm is less continuous and is only represented by one spot on the map. The two distinct Mn carbonate layers can be linked to inflow events in 1993 and 1997, using the210Pb-based age model for this site, after cor-rection for compaction of the sediment during embedding.
In the surface sediments of the Landsort Deep site (LD1), in contrast, a large number of Mn enrichments with much higher concentrations than at LL19 are observed (Figs. 4 and 5). The LA-ICP-MS line scans show that the highest values often coincide with enrichments in S, Mo and Br but are not related to maxima in Fe. The micro-XRF maps of Mn, Ca and S confirm that enrichments in Mn are present as discrete layers. The RGB (red, green, blue; Mn, Ca, S, respectively) composite reveals two different compositions for the Mn en-richments. The purple layers in the RGB composite are a result of enrichments of Mn (red) and S (blue) in the same pixel, suggesting the presence of Mn sulfide. Other layers and spots are orange to yellow, indicating coincident ments of Ca (green) and Mn, suggesting carbonate enrich-ments (Fig. 5b).
The change in the integrated amount of Mn oxide and Mn carbonate in the sediment with time, as calculated using the diagenetic model, depends on the value of the rate constant for the reduction of Mn oxides (kred) assumed for the
pe-riod with oxic (4 months) bottom waters (Fig. 6a and b). The amount of Mn oxide that is preserved during this phase de-creases with increasing values ofkred. Whenkred, is low, most
dur-Figure 2.Pore water profiles of dissolved manganese (Mn), iron (Fe), calcium (Ca), alkalinity, ammonium and sulfate for all eight sites, and hydrogen sulfide for the five deepest sites. Note that dissolved Fe is below the detection limit in core LF3 and LD1 and dissolved sulfide is expressed as HS−; some H
2S can be present as well.
40 30 20 10 0
Depth [cm]
-4 -2 0 2
SI Mn sulfide
-6 -4 -2 0 2
SI Mn carbonate
LF3 LL19 F80 BY15 LD1
Figure 3. Saturation indices (SI) for Mn carbonate (here as Mn0.74Ca0.26CO3) and Mn sulfide as calculated from the pore wa-ter data with PHREEQC.
ing the first 4 months of the simulation. The results show
that the more Mn oxide is preserved during the oxic phase, the more Mn carbonate forms during the following anoxic phase, because less dissolved Mn escapes to the overlying water through diffusion. In runs with low values ofkred, Mn
carbonate is mostly formed in the 2-month anoxic phase. At intermediate values ofkred, there is also formation of Mn car-bonate in the oxic phase. At high values ofkred, Mn carbonate formation is negligible. Corresponding changes in integrated amounts of dissolved Mn in the sediment and benthic fluxes of Mn during the simulations are shown in Supplement 3.
Examples of depth profiles of Mn oxides, dissolved Mn and Mn carbonate at various key stages of the simulation illustrate the dependence of Mn carbonate formation on the rate of reduction of Mn oxides during the oxic phase (Fig. 6c). After 4 months, a large amount of Mn oxides has accumulated in the surface sediment whenkredis equal
to 0.1 yr−1. Such an enrichment is absent when k red is
1000 yr−1. High dissolved Mn concentrations at the onset of
for-eastern Gotland Basin LF1
Fladen BS1
Bornholm Basin BY5
eastern Gotland Basin LF3
Gotland Deep BY15
Fårö Deep F80 northern Gotland Basin LL19
Landsort Deep LD1
Depth [cm]
1990
1990
1990
1990
1990
1990 1940
1940
1940
1940 Age
1990 1940 1990 1940
0 1 2 3
Mo [µmol/g]
0 1 2
Fe/Al [%/%]
0 1 2 3 4 5 Ca[wt%]
0 0.4 0.8
Mn [wt%]
0 10 20 30 0 2 4 6 8 10 0 2 4 6 8
S [wt%]
0 8 16
TOC [wt%]
40 20 0
20 10 0
20 0
40 20 0
20 0
40 20 0
40 20 0
40 20 0
Figure 4.Sediment depth profiles of total organic carbon (TOC), sulfur (S), manganese (Mn), iron to aluminum ratio (Fe/Al), calcium (Ca) and molybdenum for all eight sites. Note the different scale for manganese at Fladen and LF1, and LD1. Grey lines indicate the years 1990 and 1940, based on sediment dating. These date markers are used to demonstrate the variability of sedimentation rates in the study area.
mation of a Mn carbonate-rich layer (shown for the end of the simulation) is restricted to the scenario which allows the Mn oxides to accumulate. Runs with a higher rate constant for precipitation of Mn carbonates (kprec) lead to more sharply
defined peaks in Mn carbonate and more Mn carbonate for-mation at higherkredvalues, but the same trends in fluxes and
rates with varyingkredare observed (not shown).
4 Discussion
4.1 Sediment Mn cycling in the Baltic Sea
Our results indicate major differences in Mn dynamics in the varied depositional settings of the Baltic Sea. Although lo-cated in the Kattegat far from the euxinic basins, processes at the Fladen site (Figs. 2 and 3) can be used to illustrate the
po-Figure 5. (a)High-resolution elemental profiles of Fe/Al, Mn/Al, S/Al, Mo/Al and Br/Al (only LD1) generated by LA-ICP-MS line scanning for resin-embedded surface sediment blocks. Note the difference in absolute values for Mn/Al between LL19 and LD1. The depth scale refers to the compacted sediment in the resin blocks (the total length of wet sediment prior to embedding was 5.5 cm (LL19) and 11.3 cm (LD1)). Peaks marked with a∗exceed the scale.(b)Compilation of micro-XRF maps for station LL19 and LD1, showing the distribution
of manganese (red), calcium (green) and sulfur (blue) at the depths indicated by grey panels in the LA-ICP-MS line scans. Colour intensity within each map is internally proportional to XRF counts, but relative scaling has been modified to highlight features. The fourth picture for each station shows a RGB (red, green, blue) composite of the three elements with orange to yellow colours, indicating a mix of Mn and Ca, and therefore, representing Ca-Mn carbonates. The pink/purple represents a mix of Mn and S, and hence represents Mn sulfide.
tentially bringing this Mn to the deep basins (Huckriede and Meischner, 1996; Jilbert and Slomp, 2013a; Lyons and Sev-ermann, 2006; Scholz et al., 2013).
The pore water profiles of the four anoxic sites in the vari-ous deep basins (LL19, BY15, F80, and LD1) all are indica-tive of the release of Mn to the pore water, either from reduc-tive dissolution of Mn oxides or dissolution of Mn carbonates due to undersaturation (e.g. Heiser et al., 2001; Jilbert and
Figure 6. (a) Integrated amount of Mn oxide and(b) integrated amount of Mn carbonate in the upper cm of the sediment (in mol m−2) for the simulation, withk
redbeing equal to either 0.1, 1, 10, 100 or 1000 yr−1for the first 4 months and equal to 1000 yr−1 for the last 2 months, as described in the text.(c)Depth profiles of Mn oxide (after 4 months, end of the oxic phase), dissolved Mn (af-ter 4 months and 8 h, directly af(af-ter the start of the anoxic phase) and MnCO3(after 6 months) as calculated with the model in the same scenarios as(a)and(b).
sinking of these phases into sulfidic waters leads to subse-quent reductive redissolution.
Due to the seasonal and inflow-related changes in redox conditions in the Baltic Sea, the lack of detailed data sets on dissolved Mn concentrations in the water column, and our very limited number of study sites, we cannot accurately estimate the different reservoirs of Mn and the importance of the present-day source of Mn from sediments overlain by oxic and hypoxic and anoxic bottom waters at the basin scale. Nevertheless, we will attempt to make a rough quantification using the data that are available and will then compare this to estimates from the literature.
Taking an average deep water volume of 2000 km3,
av-erage hypoxic area of 47 000 km2 (Carstensen et al., 2014),
and a deep water concentration of Mn of 8 µM (Löffler et al., 1997 as cited by Heiser et al., 2001), the amount of Mn in the deep water is estimated at 1.6×10¹⁰mol or 0.33 mol m−2. The range of Mn fluxes estimated in this study
(0 to 236 µmol m−2d−1; Table 2) is comparable to benthic
fluxes measured with in situ chambers in other areas of the Baltic Sea (e.g. the Gulf of Finland; Pakhomova et al., 2007) as well as those estimated from pore water profiles acquired in the 1990s (e.g. Heiser et al., 2001). If we assume that a flux of ca. 90 µmol m−2d−1 is representative of the
sed-iments overlain by hypoxic and anoxic bottom waters (Ta-ble 2; based on the fluxes for LL19, F80 and BY15), we calculate a yearly flux of 0.033 mol m−2 from those
sedi-ments, which is equivalent to 10 % of the inventory in the water column. In similar calculations, Heiser et al. (2001) estimated the amount of Mn in the Gotland Deep to be equal to 0.8 mol m−2. With our estimate of the benthic flux, this
would lead to a contribution of the annual benthic flux of less than 5 %. We note, however, that the role of the benthic flux of Mn from hypoxic sediments will vary spatially and may be biased towards high values because of preferential sam-pling of sites with a relatively high sediment accumulation rate in most pore water studies. This may explain the 1 or-der of magnitude lower benthic fluxes of Mn reported for the Gotland Deep area in 1999–2001 of ca. 7–8 µmol m−2d−1
by Neretin et al. (2003) when compared to those in our study (Table 2).
Benthic fluxes of Mn are also expected to be high upon the re-establishment of bottom water anoxia after an inflow and then decline with time (Neretin et al., 2003). The exact impact of inflows on the oxygenation of the bottom waters in the deep basins of the Baltic Sea varies from site to site, as it depends on the volume and oxygen content of the inflowing water, its pathway and the oxygen concentration in the re-ceiving basin (e.g. Carstensen et al., 2014), with the general flow of water in the deep basins going from the Gotland to the Fårö and the Landsort Deep (Holtermann et al., 2012). For example, the bottom water in the Gotland Deep was free of hydrogen sulfide for 4 months following the inflow of 1993– 1994 (Neretin et al., 2003; Yakushev et al., 2011) whereas the Landsort Deep was less affected because the bottom water at the time already contained oxygen (Fig. 7). Using biogeo-chemical modelling of a typical inflow in the Gotland Deep area, Yakushev et al. (2011) showed that dissolved Mn in the water column was oxidized to Mn oxides and settled to the bottom over a time period of months. Dissolved Mn ap-peared in the water column again upon the return of bottom water anoxia and steady-state conditions in the water column were established in the model after ca. 1.5 years.
1960 1970 1980 1990 2000 2010 Year
40 20 0
bottom water H2
S [µM]
0 100 200 300 400
dgf Mn [µmol/g]
0 1 2 3
Mo [µmol/g]
Mn Mo
0 40 80
O2
[µM]
LL19
1960 1970 1980 1990 2000 2010 Year
40 20 0
bottom water H2
S [µM]
0 1000 2000 3000 4000 5000
Mn [µmol/g]
0 1 2 3
Mo [µmol/g]
Mn Mo
0 40 80
O2
[µM]
LD1
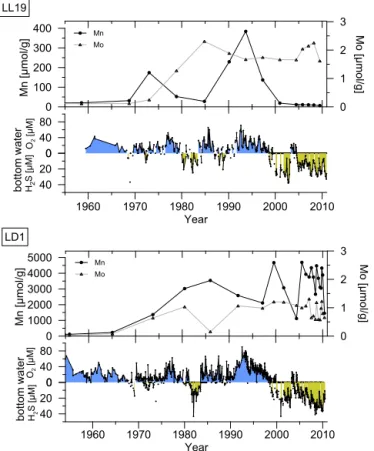
Figure 7. Records of sediment manganese and molybdenum for 1955–2010 for core LL19 and core LD1, and corresponding bottom water oxygen and sulfide concentrations from monitoring data (for LD1 the nearby monitoring station LL23 was used; ICES Dataset on Ocean Hydrography, 2014).
changes in Mn inventory between inflows, there is no clear trend in water column Mn concentrations in the Baltic Sea with time over recent decades (Pohl and Hennings, 2005), and our observation that the burial of Mn has decreased at most sites (Fig. 4), it is likely that the present-day Mn shut-tling from the oxic and hypoxic areas around the deep basins is not as important quantitatively as a source of Mn to the deep basins as it was at the onset of hypoxia early in the 20th century.
Notably, Yakushev et al. (2011) consider Mn(III) besides Mn(II) in their model for biogeochemical dynamics in the water column in the Gotland Deep. Dellwig et al. (2012) found recently that Mn(III) is an important component in the water column Mn cycle in the Landsort Deep but not in the Gotland Deep. Further work is required to elucidate the potential importance of this finding to Mn dynamics in the Baltic Sea, its impact on other biogeochemical cycles (e.g. Pakhomova and Yakushev, 2013), its role in the sediments and impacts on Mn sequestration (e.g. Madison et al., 2011). Field studies of Mn dynamics in the water column and sedi-ment during and directly after an inflow would be of particu-lar value.
4.2 Manganese sequestration in the anoxic basins Formation of Mn-bearing carbonates in the Gotland Basin and Landsort Deep is generally described as being ubiqui-tous after inflows (e.g. Jakobsen and Postma, 1989). We ob-serve such Mn carbonate enrichments in all our deep basin cores, with the magnitude of the enrichment increasing with water depth (Fig. 4). We suggest that this water depth ef-fect between the deep basin sites is due to increased focusing of particulate Mn oxides precipitated during inflow events with water depth, combined with a high alkalinity in the deep basins linked to organic matter degradation by sulfate reduc-tion. Increased focusing of Mn oxides with water depth has been observed in other marine systems (e.g. Slomp et al., 1997) and a high alkalinity in sulfate-bearing organic-rich sediments overlain by an anoxic water column is typically linked to organic matter degradation through sulfate reduc-tion (Berner et al., 1970).
Our microanalysis results show that the Mn carbonate en-richments at site LL19 are highly laminar in character, im-plying rapid precipitation at or near the sediment–water in-terface. Furthermore, these Mn carbonate enrichments occur independently of enrichments in Mo and S. Sedimentary Mo can be used as a proxy for sulfidic conditions close to the sediment–water interface, due to the conversion of seawa-ter oxymolybdate to particle-reactive thiomolybdate in the presence of hydrogen sulfide (Erickson and Helz, 2000). Al-though the ultimate burial phase of Mo in sulfidic sediments is still debated (e.g. Helz et al., 2011), Mo concentrations have successfully been used to reconstruct the redox his-tory of the bottom water in restricted coastal basins (Adel-son et al., 2001; Jilbert and Slomp, 2013a). Sulfur enrich-ments in sedienrich-ments are typically associated with Fe sulfides. These can form as the result of reduction of Fe(III) oxides with sulfide or organic matter (Boesen and Postma, 1988), and thus Fe sulphides can also be indicative of sulfidic con-ditions close to the sediment–water interface. The indepen-dence of these Mn enrichments from those of Mo and S suggests relatively oxic conditions at the time of Mn deposi-tion. Both lines of evidence support the interpretation of Mn carbonate precipitation following inflow events (Sternbeck and Sohlenius, 1997). Our age model suggests that the two pronounced Mn carbonate layers at the base of the surface-sediment resembedded block (Fig. 5) correspond to in-flows in 1993 and 1997 (Matthäus and Schinke, 1999).
geometry makes it an excellent sediment trap. Indeed sedi-ment deposition rates at the Landsort Deep are much higher than in the other deeps (Lepland and Stevens, 1998; Mort et al., 2010), perhaps as much as 6 times higher (Expedition 347 Scientists, 2014). Sediment focusing is also expected to lead to a higher input of organic matter and Mn oxides to this basin. Given that rates of mineral dissolution are expected to depend on the amount of material present, corresponding rates of input and dissolution of Mn oxide minerals in the sediment are likely higher in the Landsort Deep than at other sites. Thus, we suggest that differences in focusing of the sediment may explain the observed differences in pore water chemistry and Mn sequestration. The differences in pore wa-ter chemistry will also likely impact the exact solid phases formed in the sediments of the various deep basins.
The high-resolution analyses for the Landsort Deep site (LD1) also show that, besides Mn carbonate enrichments, there are several distinct layers of Mn sulfide in the surface sediments (Fig. 5). These appear to coincide with enrich-ments in Mo, suggesting formation of Mn sulfides during intervals of more reducing conditions (Mort et al., 2010). Furthermore, we observe simultaneous enrichments of Br (Fig. 5), which suggests higher organic carbon contents (Ziegler et al., 2008). These results could imply that in-creased rates of sulfate reduction linked to elevated inputs of organic material to the sediments drive the formation of Mn sulfide by contributing to an excess of sulfide over Fe. We note that the interval presented in the XRF map covers only a few years of sediment accumulation, possibly suggesting rapid changes in Mn mineralogy in response to seasonal vari-ability of the organic matter flux (Fig. 5). Primary productiv-ity in the Baltic Sea is known to vary seasonally (Bianchi et al., 2002; Fennel, 1995). Further work is required to deter-mine the mechanisms of MnS formation conclusively. While the presence of MnS has been shown for the earlier anoxic time intervals in the Baltic (Böttcher and Huckriede, 1997; Lepland and Stevens, 1998), this is the first time Mn sulfides are reported for such near-surface sediments in the Baltic Sea.
The contrasting controls on Mn mineral formation in the Landsort Deep, compared to the other deep basin sites, are further illustrated by a comparison of the trends in total Mn and Mo concentrations (Fig. 4) with measured bottom wa-ter oxygen concentrations for the period 1955 to 2010 (ICES Dataset on Ocean Hydrography 2014) for sites in the north-ern Gotland Basin (LL19) and the Landsort Deep (LD1) (Fig. 7). At site LL19, Mn enrichments in the sediments co-incide with low values of Mo in the sediment and inflows of oxygenated water. This suggests that Mn burial is enhanced under more oxygenated bottom water conditions. At LD1, in contrast, high Mn contents are observed from 1965 onwards, independent of inflows, with the highest Mn values coincid-ing with periods with the highest sulfide concentrations that occur in particular since the year 2000. This supports our hy-pothesis that the formation of Mn carbonate minerals in the
Landsort Deep is not always related to inflows and that the Mn oxide supply is higher and more continuous when com-pared to the other basins, due to the much stronger sediment focusing related to the peculiar basin geometry.
4.3 Changes in Mn burial linked to expanding hypoxia Strikingly, the more reducing conditions in the Gotland Basin (LL19, BY15) and Fårö Deep sites (F80) over the past decades, as recorded in the Mo profiles (Figs. 4 and 7), are accompanied by a strong reduction in sediment Mn burial. Given the suggested link between Mn burial and inflows, it is important to assess the occurrence of these inflows. Dur-ing the past 2 decades, there were two major (1993, 2003) and several minor inflow events (e.g. 1997) into the Baltic Sea. The event in 1993 was one of the strongest in the last 60 years (Matthäus et al., 2008) and the inflow of 2003 (Feistel et al., 2003) was weaker but still significant enough to reoxy-genate the bottom water of the deep basins (Fig. 7). Never-theless, at LL19, Mn sequestration in the sediment between 2000 and 2010 has been negligible and the inflow in 2003 is not recorded as a Mn carbonate enrichment (Fig. 7), whereas, in the high-resolution geochemical analyses, Mn layers are clearly visible in both the LA-ICP-MS and micro-XRF scans (Fig. 5) and can be linked to the inflows of 1993 and 1997. A similar “missing” Mn carbonate layer was observed by Heiser et al. (2001) in the Gotland Deep and attributed to redissolution of Mn carbonate linked to resuspension events and mixing of the sediment into unsaturated bottom waters, but our cores were clearly laminated and the210Pb profiles also show no evidence for mixing. We therefore conclude that with the increased hypoxia and euxinia in the Baltic Sea, Mn oxides are no longer converted to stable Mn carbonates following inflows.
al., 2014). High phosphate concentrations in the surface sed-iment may potentially negatively affect the rate of Mn car-bonate formation (Mucci, 2004), but there is no evidence for a significant rise in dissolved phosphate in the pore wa-ter of Gotland Basin sediments over the past decades (e.g. Carman and Rahm, 1997; Hille et al., 2005; Jilbert et al., 2011). Alternatively, we hypothesize that the Mn oxides that are formed following modern inflow events might be reduc-tively dissolved faster than previously. As a consequence, the dissolved Mn released from the oxides could then escape to the overlying water instead of being precipitated in the form of Mn carbonate. This hypothesis is consistent with the re-sults of the simple diagenetic model where high rates of Mn oxide reduction lead to less Mn carbonate formation (Fig. 6). There are multiple possible reductants for Mn oxides in marine sediments, including sulfide, Fe(II) (e.g. Canfield and Thamdrup, 2009), NH+
4 (e.g. Luther et al., 1997) and CH4
(Beal et al., 2009), with the role of the latter two reduc-tants in marine sediments still being debated. Given that the dissolved Fe and CH4concentrations in the pore waters of
the surface sediments of the Gotland Basin area are negli-gible, these constituents are unlikely to play an important role as a reductant for Mn oxides in the northern Gotland Basin (LL19), Fårö Deep (F80) and Gotland Deep (BY15) sites. Furthermore, there is no evidence for a major recent change in pore water CH4concentrations in the surface
sed-iments. There is evidence, however, for a recent rise in the bottom water sulfide concentrations in the deep basins of the Baltic Sea (Fig. 7) linked to eutrophication (Carstensen et al., 2014). As shown for the northern Gotland Basin site (LL19), the more persistent presence of high concentrations of bot-tom water sulfide and enrichments in sediment Mo coincide with the decline in Mn in the sediment (Fig. 7).
We hypothesize that Mn oxides that are formed following modern inflow events and that are deposited on the seafloor (Heiser et al., 2001) are no longer being converted to Mn carbonates because of higher pore water sulfide concentra-tions and the rapid onset of sulfidic condiconcentra-tions in the overly-ing waters. These higher sulfide concentrations are likely the direct result of increased sulfate reduction driven by the on-going rise in productivity in the Baltic Sea (Gustafsson et al., 2012, 2014; Carstensen et al, 2014). The observed decline in Fe/Al at our deep basin sites (Fig. 3) suggests more muted shuttling of Fe oxides from shelves to the deeps linked to the expanding hypoxia (e.g. Scholz et al., 2014) which may have reduced the buffer capacity of the sediments for sulfide (e.g. Diaz and Rosenberg, 2008).
The rate of reduction of Mn oxides with sulfides is as-sumed to linearly depend on the concentration of sulfide ac-cording to the following rate law (Wang and Van Cappellen, 1996):
R=kCTSCMnoxides, (6) wherekis a rate constant (with a value<108yr−1) andC
TS
stands for the total sulfide concentration, i.e. the sum of the
concentrations of H2S and HS−(in M). In our modelling
ap-proach, the rate law for this process is assumed equal to
R=kredCMnoxides. (7)
Thus, if sulfide is the reductant,kredcan be assumed to be
equivalent to the product ofkandCTS. Sulfide will be
ab-sent in oxygenated pore waters, i.e. can be below 1 µM in the surface sediment, but also can range up to 1.1 to 2.2 mM as observed at sites F80 and LD1 (Fig. 2; Supplement 2). Corre-spondingkredvalues for surface sediments in the Baltic Sea
would then be expected to range over 3–4 orders of magni-tude and stay below 105yr−1, which is consistent with our
assumptions. Mn carbonate formation is found to critically depend on the value ofkred(Fig. 6). Although we are aware that factors other than the availability of Mn are also criti-cal to Mn carbonate formation, these model results support our suggestion that a recent rise in the pore water and bottom water sulfide concentrations may have made the surface sed-iments more hostile to the preservation of Mn oxide after an inflow and might contribute to their reduction. Consequently, more dissolved Mn could then escape to the overlying water instead of being precipitated in the form of Mn carbonate, explaining the lack of recent Mn enrichments.
4.4 Implications for Mn as a redox proxy
5 Conclusions
We show that the most recent sediments in the Fårö Deep and Gotland Deep contain low concentrations of Mn near the sediment surface. We hypothesize that this is due to the ex-pansion of the area with hypoxic bottom waters and the de-velopment of more continuous bottom water euxinia over the past decades, linked to ongoing eutrophication and possibly due to the reduced input of Fe oxides that can act as a sink for sulfide. The high ambient sulfide concentrations in the sedi-ment and water column after an inflow event are thought to be more conducive to faster dissolution of Mn oxides, leading to more loss of dissolved Mn to the water column and less for-mation of Mn carbonate. Our hypothesis is supported by the results of a simple diagenetic model for Mn. It is also con-sistent with the general interpretation of sediment records of Mn in paleoceanography and the use of Mn as a redox proxy, where the absence of Mn carbonates in sediments is assumed to be indicative of euxinic bottom waters (e.g. Calvert and Pedersen, 1993). In the Landsort Deep, in contrast, Mn sul-fides and carbonates are still being precipitated. This could be due to strong focusing of Mn-rich sediment particles and high rates of sediment accumulation in the Landsort Deep. Our results indicate that sediment Mn carbonates in the other deep basins of the Baltic Sea no longer reliably and consis-tently record inflows of oxygenated North Sea water. This has implications for the use of Mn enrichments as a redox proxy when analysing geological deposits.
The Supplement related to this article is available online at doi:10.5194/bg-12-4875-2015-supplement.
Acknowledgements. This work was funded by grants from the Baltic Sea 2020 foundation, the Netherlands Organisation for Scientific Research (NWO Vidi and Vici), Utrecht University (via UU short stay fellowship 2011), the EU-BONUS project HYPER and the European Research Council under the European Community’s Seventh Framework Programme for ERC Starting Grant #278364. M. Wolthers acknowledges Natural Environment Research Council [fellowship #NE/J018856/1]. We thank the captain and crew of RV Skagerrak (2007), RV Aranda (2009), RV Heincke (2010) and RV Pelagia (2011) and all participants of the cruises for their assistance with the field work. We thank Simon Veldhuijzen for his contribution to the analyses for site F80.
Edited by: K. Fennel
References
Adelson, J. M., Helz, G. R., and Miller, C. V.: Reconstructing the rise of recent coastal anoxia; molybdenum in Chesapeake Bay sediments, Geochim. Cosmochim. Acta, 65, 237–252, 2001.
Ahl, T.: River Discharges of Fe, Mn, Cu, Zn, and Pb into the Baltic Sea from Sweden, Ambio Special Report, 219–228, 1977. Appleby, P. and Oldfield, F.: The assessment of210Pb data from
sites with varying sediment accumulation rates, Hydrobiology, 103, 29–35, 1983.
Beal, E. J., House, C. H., and Orphan, V. J.: Manganese- and Iron-Dependent Marine Methane Oxidation, Science, 325, 184–187, 2009.
Berner, R. A.: Early diagenesis: A theoretical approach, Princeton University Press, 1980.
Berner, R. A., Scott, M. R., and Thomlinson, C.: Carbonate alka-linity in the pore waters of anoxic marine sediments, Limno. Oceanogr., 15, 544–549, 1970.
Bianchi, T. S., Rolff, C., Widbom, B., and Elmgren, R.: Phytoplank-ton Pigments in Baltic Sea SesPhytoplank-ton and Sediments: Seasonal Vari-ability, Fluxes, and Transformations, Estuar. Coast. Shelf Sci., 55, 369–383, 2002.
Boesen, C. and Postma, D.: Pyrite formation in anoxic environ-ments of the Baltic, Am. J. Sci., 288, 575–603, 1988.
Böttcher, M. E. and Huckriede, H.: First occurrence and stable iso-tope composition of authigenicγ-MnS in the central Gotland Deep (Baltic Sea), Mar. Geol., 137, 201–205, 1997.
Boudreau, B. P.: Diagenetic models and their implementation: mod-elling transport and reactions in aquatic sediments, Springer Berlin, 1997.
Cai, W.-J and Reiners, C. E.: The development ofpH andpCO2 mi-croelectrodes for studying the carbonate chemistry of pore waters near the sediment-water interface, Limnol. Oceanogr., 38, 1762– 1773, 1993.
Calvert, S. and Pedersen, T.: Geochemistry of recent oxic and anoxic marine sediments: Implications for the geological record, Mar. Geol., 113, 67–88, 1993.
Calvert, S. and Pedersen, T.: Sedimentary geochemistry of ganese; implications for the environment of formation of man-ganiferous black shales, Econ. Geol., 91, 36–47, 1996.
Canfield, D. E. and Thamdrup, B.: Towards a consistent classifica-tion scheme for geochemical environments, or, why we wish the term “suboxic” would go away, Geobiology, 7, 385–392, 2009. Carman, R. and Rahm, L.: Early diagenesis and chemical
charac-teristics of interstitial water and sediments in the deep deposition bottoms of the Baltic proper, J. Sea Res., 37, 25–47, 1997. Carstensen, J., Andersen, J. H., Gustafsson, B. G., and Conley, D. J.:
Deoxygenation of the Baltic Sea during the last century, PNAS, 111, 5628–5633, 2014.
Conley, D. J., Björck, S., Bonsdorff, E., Carstensen, J., Destouni, G., Gustafsson, B. G., Hietanen, S., Kortekaas, M., Kuosa, H., Meier, H. E., Müller-Karulis, B., Nordberg, K., Norkko, A., Nürnberg, G., Pitkänen, H., Rabalais, N. N., Rosenberg, R., Savchuk, O. P., Slomp, C. P., Voss, M., Wulff, F., and Zillen, L.: Hypoxia-related processes in the Baltic Sea, Environ. Sci. Technol., 43, 3412–3420, 2009.
Dellwig, O., Leipe, T., März, C., Glockzin, M., Pollehne, F., Schnet-ger, B., Yakushev, E. V., Böttcher, M. E., and Brumsack, H.-J.: A new particulate Mn–Fe–P-shuttle at the redoxcline of anoxic basins, Geochim. Cosmochim. Acta, 74, 7100–7115, 2010. Dellwig, O., Schnetger, B., Brumsack, H.-J., Grossart, H.-P., and