ACLY and ACC1 Regulate Hypoxia-Induced
Apoptosis by Modulating ETV4 via
α
-ketoglutarate
Melissa M. Keenan1,2, Beiyu Liu1,2, Xiaohu Tang1,2, Jianli Wu1,2, Derek Cyr3, Robert D. Stevens4,5, Olga Ilkayeva4,5, Zhiqing Huang6, Laura A. Tollini1,2, Susan K. Murphy6, Joseph Lucas3, Deborah M. Muoio4,5, So Young Kim1, Jen-Tsan Chi1,2*
1Department of Molecular Genetics and Microbiology, Duke University Medical Center, Durham, North Carolina, United States of America,2Center for Genomic and Computational Biology, Duke University Medical Center, Durham, North Carolina, United States of America,3Department of Electrical and Computer Engineering, Duke University Medical Center, Durham, North Carolina, United States of America,4Sarah W Stedman Nutrition and Metabolism Center, Duke University Medical Center, Durham, North Carolina, United States of America,5Duke Institute of Molecular Physiology, Duke University Medical Center, Durham, North Carolina, United States of America,6Department of Obstetrics and Gynecology, Division of Gynecologic Oncology, Duke University Medical Center, Durham, North Carolina, United States of America
Abstract
In order to propagate a solid tumor, cancer cells must adapt to and survive under various tumor microenvironment (TME) stresses, such as hypoxia or lactic acidosis. To systemati-cally identify genes that modulate cancer cell survival under stresses, we performed genome-wide shRNA screens under hypoxia or lactic acidosis. We discovered that genetic depletion of acetyl-CoA carboxylase (ACACAorACC1) or ATP citrate lyase (ACLY) pro-tected cancer cells from hypoxia-induced apoptosis. Additionally, the loss of ACLY or ACC1 reduced levels and activities of the oncogenic transcription factor ETV4. Silencing ETV4 also protected cells from hypoxia-induced apoptosis and led to remarkably similar transcrip-tional responses as with silenced ACLY or ACC1, including an anti-apoptotic program. Metabolomic analysis found that whileα-ketoglutarate levels decrease under hypoxia in
control cells,α-ketoglutarate is paradoxically increased under hypoxia when ACC1 or
ACLY are depleted. Supplementation withα-ketoglutarate rescued the hypoxia-induced
apoptosis and recapitulated the decreased expression and activity of ETV4, likely via an epigenetic mechanism. Therefore, ACC1 and ACLY regulate the levels of ETV4 under hyp-oxia via increasedα-ketoglutarate. These results reveal that the ACC1/ACLY-α
-ketogluta-rate-ETV4 axis is a novel means by which metabolic states regulate transcriptional output for life vs. death decisions under hypoxia. Since many lipogenic inhibitors are under investi-gation as cancer therapeutics, our findings suggest that the use of these inhibitors will need to be carefully considered with respect to oncogenic drivers, tumor hypoxia, progression and dormancy. More broadly, our screen provides a framework for studying additional tumor cell stress-adaption mechanisms in the future.
OPEN ACCESS
Citation:Keenan MM, Liu B, Tang X, Wu J, Cyr D, Stevens RD, et al. (2015) ACLY and ACC1 Regulate Hypoxia-Induced Apoptosis by Modulating ETV4 via
α-ketoglutarate. PLoS Genet 11(10): e1005599.
doi:10.1371/journal.pgen.1005599
Editor:Gregory R Steinberg, McMaster University, CANADA
Received:March 9, 2015
Accepted:September 21, 2015
Published:October 9, 2015
Copyright:© 2015 Keenan et al. This is an open access article distributed under the terms of the
Creative Commons Attribution License, which permits unrestricted use, distribution, and reproduction in any medium, provided the original author and source are credited.
Data Availability Statement:All relevant data are within the paper, its Supporting Information files and the microarray data discussed in this publication have been deposited in NCBI's Gene Expression Omnibus (Edgar et al., 2002) and are accessible through GEO Series accession number GSE61286 (http://www. ncbi.nlm.nih.gov/geo/query/acc.cgi?acc=GSE61286).
Author Summary
During the development of most solid tumors, there are characteristic physiological differ-ences in the tumor that result from tumor cells outgrowing their local blood supply. Two of these physiological differences, or“stresses,”that occur in the tumor are low oxygen lev-els (hypoxia) and an accumulation of lactic acidic (lactic acidosis). Cancer cells experienc-ing hypoxia and lactic acidosis tend to be more resistant to chemo- and radio-therapy and metastasize more readily. Therefore, it is important to understand how tumor cells adapt to and survive these stresses. We used a large scale screening experiment in order to find which genes and proteins are involved in tumor cell adaptation and survival under hyp-oxia or lactic acidosis. We found that inhibiting either of two genes involved in lipid syn-thesis allowed tumor cells to survive hypoxia. This occurred because silencing these genes led to an increase in the metaboliteα-ketoglutarate, which repressed a transcription factor
that contributed to cell death under hypoxia. This research specifically advances our understanding of how tumor cells survive hypoxia and lactic acidosis and more broadly enhances our understanding of the cellular biology of solid tumors.
Introduction
Most solid tumors have substantial physiological deviations from normal tissue, which mani-fest as tumor microenvironment (TME) stresses [1,2]. These TME“stresses”include, among others, the limited availability of oxygen (hypoxia), glucose or amino acids, and an accumula-tion of lactic acid (lactic acidosis). In order to grow and propagate a solid tumor, tumor cells must adapt to and survive under these TME stresses. Additionally, tumor cells in regions of LA or hypoxia are more radio- and chemo-resistant and are more likely to metastasize [3]. Since TME stresses are found in most solid tumors, targeting stress-adaptation mechanisms of tumor cells may offer a significant therapeutic window to selectively eradicate tumor cells and improve patient outcomes [4]. Yet, current therapies targeting cells specifically under stress have significant limitations. For example, angiogenesis is a well-established, valuable therapeu-tic target with agents developed to block it at various stages of tumor development. However, many anti-angiogenic therapies fail over time, through acquired or inherited resistance that may involve the presence of tumor hypoxia [5]. Therefore, a number of other strategies are being developed to directly target hypoxic cells, such as blocking lactate transporters [6,7], or pro-drugs that are activated only in the presence of low oxygen [4]. There remains significant room for improvement to target cells under stress, and thus there remains a need to better understand the genes that impact cellular survival under TME stresses.
Tumor cells employ at least two kinds of adaptive strategies to cope with TME stresses, tran-scriptional and metabolic, and these are often interconnected. Trantran-scriptional changes are mediated by stress-activated transcription factors. For example, the most significant factors known to regulate a cell’s hypoxia response are the hypoxia-inducible factors (HIFs), which are stabilized under low oxygen and mediate complex transcriptional programs that increase glu-cose uptake and enhance glycolysis [8,9]. HIF–1αalso regulates glutamine metabolism by
affecting the ubiquitination of its oxidizing enzyme, AKGDH, to promote reductive carboxyla-tion of glutamine under hypoxic condicarboxyla-tions [10–12]. In addition to the HIFs, many other tran-scription factors regulate cellular responses to stresses in the TME. For example, the MondoA: Mlx complex senses and initiates transcriptional changes under both glucose deprivation and lactic acidosis to induce TXNIP and restrict glucose uptake [13–15]. Importantly, multiple co-factors and modulators add to the complexity of stress mediated transcriptional responses
National Institutes of Health/National Institute of Diabetes and Digestive and Kidney Diseases,http:// www.niddk.nih.gov/(1R01DK089312 to DMM). The funders had no role in study design, data collection and analysis, decision to publish, or preparation of the manuscript.
[16]. While these adaptive mechanisms can be successful to sustain cell growth under stress, in multiple contexts hypoxia induces apoptosis [17–19].
Transcriptional responses mediate many metabolic reprogramming events, but, recently, it is also becoming evident that metabolic events can regulate gene expression. For example, the metabolic enzyme ATP citrate lyase (ACLY) generates glucose-derived acetyl-CoA from citrate to alter histone acetylation and, therefore, transcriptional activation [20]. Importantly, the met-abolically sensitive mTOR signaling cascade can activate HIF, even under normoxia [21,22]. Mutations in succinate dehydrogenase and fumarate hydratase both lead to increased levels of their substrates (succinate and fumarate, respectively), causing increased HIF–1αstability and
alterations of genome-wide histone and DNA methylation [23,24]. Metabolites such as NAD+, NOS andα-ketoglutarate (α-KG) can also affect HIF function and histone and DNA
modifica-tions [21,22,25–28]. While cellular metabolism and transcriptional changes can provide flexi-bility for adaptation, cancer cells can also become reliant on, and thus vulnerable to the inhibition of, specific metabolic pathways or gene products [29–31]. Therefore, a better under-standing of the genes necessary for modulating cancer cell survival under TME stresses will improve the development of targeted therapies that selectively eradicate cancer cells under stresses [4,32].
Functional genetic screens provide an unbiased and powerful means of identifying genes responsible for any phenotype that can be measured experimentally. Unbiased RNAi screens have identified genes that influence the survival of organisms and cells under various stresses [33–36]. These studies provide a foundation for using RNAi screens to uncover genes involved in TME-relevant stress responses, but so far have not been applied genome-wide to identify genes that modulate the survival of cancer cells under hypoxia or lactic acidosis. To better understand the genes involved in the adaptations of cancer cells under TME stresses, we per-formed genome-wide pooled shRNA screens of lung cancer cells under hypoxia and lactic aci-dosis. Completing these screens revealed that the inhibition of ACC1 or ACLY, two key enzymes ofde novolipogenesis, protected cancer cells from hypoxia-induced apoptosis. ACC1
or ACLY inhibition protected cells by elevating levels ofα-ketoglutarate under hypoxia to
reduce the activity of the oncogenic transcription factor ETV4. Together, these data provide evidence to support a molecular connection between cellular metabolic and transcriptional hypoxia adaptation via the ACLY-ACC1-ETV4 axis throughα-ketoglutarate.
Results
Genome-wide pooled shRNA screens in hypoxia and lactic acidosis
ratios of differentially labeled PCR products were hybridized on the arrays, we noted distin-guishable differences in the signals, demonstrating the specificity and sensitivity of the array (S1a Fig). Biological triplicates of each condition had highly reproducible signals (S1b Fig). The abundance of each shRNA sequence reflected the effect of its target gene on cell survival under stresses: if the shRNA was depleted in the stress treatment, the gene it targeted had a“synthetic sick/lethal”phenotype; if the shRNA was enriched in the stress treatment, the gene it targeted had a“synthetic survival/protective”phenotype under stress. In order to analyze the effect of each shRNA in stress, we calculated an“R/G”ratio (seeMethods). R/G ratios were distributed on a scale of +/- 4.0 that was highly consistent between replicates and stresses (S1c Fig).
To minimize false positives due to off-target effects of individual shRNAs, we focused only on the genes that had at least two distinct shRNA sequences that were enriched or depleted (S1 andS2Tables, seeMethods). Importantly, this“multiple hairpin analysis”identifiedEPAS1
(hypoxia-inducible factor 2α, HIF–2α) as a synthetic lethal gene under hypoxia. We further
validated this by showing that silencing EPAS1 by shRNA reduced cell survival under hypoxia (Fig 1b and 1c). This result was consistent with the critical role of EPAS1 in cellular adaptation to hypoxia [8]. The“re-discovery”ofEPAS1provided confidence in our screen and analysis
methods. However, no pathways or gene ontology groups were significantly enriched within the different categories of“multiple hairpin hits”. We then performed a RIGER analysis using a
Fig 1. Genome-wide shRNA screen identifies the depletion of ACC1 as protective for cells under hypoxia.(A) The overall design of genome-wide pooled shRNA screen protocol. Each treatment was performed in n = 3. (B) Western blot showing decreased protein level expression of EPAS1 (HIF–2α) by shRNA. (C) Viable cell number counts by trypan blue exclusion after indicated cells in 4 days of hypoxia (n = 9). (D) Analysis of screen data by RIGER with GENE-E program with the probability of a gene being a hit indicated by 1/NES (normalized enrichment score). With the second best hairpin method, ACC1 is 13thbest performing gene overall (indicated by red circle). (E) Venn diagrams showing the overlap of genes in the multiple hairpin analysis (seeMethods)
across both TME stress treatments, separated by shRNA enrichment (top) or depletion (bottom) in the stress condition. (F) GENE-E heat map results of ACC1 hairpins in hypoxia screen (top 3 rows) and lactic acidosis screen (bottom 3 rows). Each row is one biological replicate (n = 3 per treatment). Each column is a different shRNA targeting ACC1. Green box highlights the hypoxia result where the gene is predicted as a“protective”hit.
log-fold change and the second best shRNA for each gene criteria (Fig 1d,S3 Table) [41]. This RIGER analysis revealed an enrichment for genes affecting mRNA regulation and binding, as well as membrane dynamics and nuclear localization [42]. Additionally, there was little overlap between the genes targeted by multiple hairpins, either enriched or depleted, in the two stresses (Fig 1e). This was consistent with past reports of distinct responses and adaptations to hypoxia and lactic acidosis [15,43].
Genome-wide screen identified ACC1 depletion as protective to cells
under a hypoxic stress
Next, we identified high confidence“hits”in both the multiple hairpin and RIGER analyses for further investigation. From these considerations, we choseACC1(acetyl-CoA carboxylase 1 or ACACA) as the top candidate.ACC1encodes the cytosolic isoform of acetyl-CoA carboxylase,
which converts acetyl-CoA to malonyl-CoA in the rate-limiting step ofde novofatty acid
syn-thesis. There was an enrichment of shRNAs targeting ACC1 in the hypoxic versus the control condition, suggesting that ACC1 knockdown allowed for improved survival under hypoxia.
ACC1had 4 hairpins enriched under hypoxia (Fig 1f) and scored as the 13thbest gene in the
RIGER analysis using the second best shRNA metric (Fig 1d). Additionally, the down-regula-tion ofACC1was previously shown to protect cancer cells from glucose deprivation and matrix
detachment stresses [44]. Together, these data prompted us to validate and investigate the role of ACC1 under hypoxia.
To validate the shRNA screen result, we silenced ACC1 expression through lentiviral infec-tion of multiple shRNAs that targeted different sequences from those shRNAs used in the screen (seeMethods). We confirmed the successful reduction of ACC1 protein by these shRNAs (Fig 2a). In the control cells transduced with a scramble shRNA, hypoxia significantly decreased cell viability and induced apoptosis (Fig 2). However, silencing ACC1 by multiple shRNAs inhibited the hypoxia-induced apoptosis as shown by crystal violet staining (Fig 2b), cell counting (Fig 2c), propidium-iodide staining (flow cytometry) (Fig 2d) and PARP cleavage (Fig 2e). This hypoxic protection associated with ACC1 silencing was also reproduced in addi-tional hypoxia-sensitive cell lines, including MDA-MB–231 (breast cancer;S2a and S2b Fig), and PANC–1 (pancreatic cancer;S2e and S2g Fig). Furthermore, chemical inhibition of ACC1 through the AMPK agonist metformin also protected H1975 cells from hypoxia-induced apo-ptosis (S2h and S2i Fig). Collectively, these data successfully validated the screen results and showed that the depletion of ACC1 enhanced cell survival under hypoxia in multiple cancer cells from different tissues of origin.
Inhibition of ACC1 or ACLY inhibits hypoxia-induced apoptosis
We next investigated the specificity of the hypoxia protection by ACC1 depletion. Besides
ACACA(ACC1),ACACB(ACC2) encodes another isoform of acetyl-CoA carboxylase, located
in the outer mitochondrial membrane [45].ACC2was not a hit in our screen and its silencing
by shRNA did not offer a similar hypoxia protection as seen with ACC1 depletion (S2j Fig). Next, we determined whether depletion of ACC1 protected against other TME stresses (lactic acidosis, glutamine deprivation and glucose deprivation). We found that the protective effect of shACC1 was seen only under hypoxia (S2k and S2l Fig). Since the HIFs are the major tran-scriptional responders to hypoxia, we examined how loss of ACC1 affected HIF–1αlevels.
Interestingly, we found decreased levels of HIF–1αunder hypoxia with ACC1 depletion across
isoform of acetyl-CoA carboxylase (encoded byACC1) was essential for apoptosis, specifically
under a hypoxic stress.
When we examined the effect of blocking enzymes up- or downstream of ACC1, we found that silencing ATP citrate lyase (ACLY) also enhanced survival under hypoxia (Fig 2f and 2g).
ACLYencodes the enzyme immediately upstream of ACC1 in lipogenesis, catalyzing the
for-mation of acetyl-CoA and oxaloacetate from citrate. Similar to ACC1, this protection results
Fig 2. Depletion of ACC1 or ACLY protects cells from hypoxia-induced apoptosis.(A) Western blot showing efficiency of 4 independent shRNAs targeting ACC1 in H1975 cells. (B) Crystal violet staining of scramble and ACC1 shRNA cells after 4 days of hypoxia. (C) Viable cell numbers of indicated cells after 4 days of hypoxia as determined by counting nuclei (n = 9). (D) Percent of cells in the sub-G1 phase as determined by PI staining and FACS analysis of indicated cell line after 4 days of hypoxia (n = 9). (E) Western blot showing cleaved PARP levels with scramble and shACC1 cells after hypoxia for 48 hours. (F) Crystal violet staining of scramble and shACLY cell lines after 4 days of hypoxia. (G) Viable cell number determined by trypan blue exclusion after 4 days of hypoxia (n = 3). (H) Western blot showing ACLY protein levels and PARP cleavage in the indicated cells after 48 hours of hypoxia. Data are represented as mean values +/- SEM. Data are from the H1975 cell line.
from the inhibition of hypoxia-induced apoptosis (Fig 2h). The protective effect of ACLY depletion was also reproduced in MDA-MB–231 cells (S2c and S2d Fig) and PANC–1 cells (S2f and S2g Fig). In H1975 and MDA-MB–231 shACLY cells there was also decreased HIF–
1αexpression under hypoxia as was seen in the shACC1 cells (S3d and S3e Fig). These data
showed that blocking lipogenesis at the points of either ACLY or ACC1 inhibited apoptosis and permitted cell survival under hypoxia in cells of multiple tissue types.
Loss of ACC1 or ACLY did not protect cells from hypoxia-induced
apoptosis through NADPH conservation to relieve oxidative stress
Lipogenesis is a highly anabolic process that requires significant amounts of NADPH and ATP. Previously, silencing ACC1 protected cells from death caused by glucose deprivation and matrix detachment by preserving NADPH and ATP to counteract the ensuing oxidative stresses [44,46]. We tested the relevance of these factors in our system. In H1975 cells, silencing ACC1 trended toward increasing the NADP+/NADPH ratio, suggesting a decrease in available NADPH (S4a Fig). We reasoned that if the NADPH were being used to combat elevated reac-tive oxygen species under hypoxia, then supplementation with antioxidants should protect control cells from hypoxia-induced death similar to [44]. However, neither the addition of N-acetyl cysteine nor glutathione antioxidants rescued hypoxia-induced death in control cells (S4b and S4c Fig). While ATP levels were higher with ACC1 silenced, the change in ATP levels from normoxia to hypoxia was consistent in control and knockdown cells and thus could not readily explain the hypoxia protection (S4d Fig). Therefore, in these cells with ACC1 or ACLY depleted, changes in NADPH and ATP levels may not be the primary mechanism for cell sur-vival under hypoxia. Therefore, we sought to identify another mechanistic explanation for this hypoxia protection phenotype.
Depletion of the transcription factor ETV4 led to similar
hypoxia-protection and gene expression phenotypes as with the loss of ACC1 or
ACLY
In our“multiple hairpin analysis”of the hypoxia genome-wide screen, there was an enrich-ment of shRNAs targeting a PEA3 transcription factor family member,ETV4. These results
suggested that silencing ETV4 may be protective under hypoxia. A link between lipogenesis and ETV4 was previously established when levels of malonyl-CoA were associated with ETV4 activity [47]. This prompted us to investigate a potential regulatory relationship between ACLY, ACC1 and ETV4. Real-time PCR analysis showed that hypoxia led to a reduction of ETV4 mRNA in the ACC1-depleted, but not control cells (Fig 3a). Additionally, we noted cor-respondingly reduced ETV4 protein in the shACC1 cells as compared to the scramble cells (Fig 3b). Reduced ETV4 mRNA and protein levels were also noted in the ACLY-depleted cells (S4e and S4f Fig). While ETV4 protein levels were somewhat decreased under normoxia, the down-regulation was stronger under hypoxia. This down-regulation was mostly specific to ETV4; the other PEA3 subfamily members, ETV1 and ETV5, were not consistently altered by ACC1 depletion (S4g Fig). Additionally, neither ETV1 nor ETV5 were identified as“multiple hairpin hits”in the shRNA screen. We validated the hypoxia-protective phenotype of ETV4 loss with two dif-ferent shRNAs targeting ETV4 (Fig 3c and 3d). Similar to ACC1/ACLY depletion, the deple-tion of ETV4 also reduced the percentage of cells in the sub-G1 phase (Fig 3e) and decreased PARP cleavage (Fig 3f) under hypoxia. These data showed that the loss of ETV4 decreased hyp-oxia-induced apoptosis, similar to the phenotype of reduced ACC1 or ACLY.
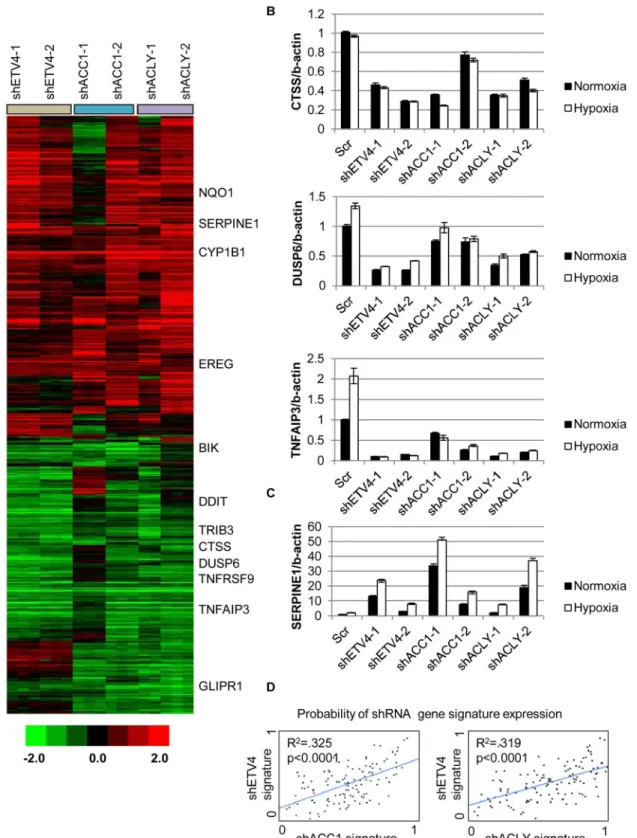
analyze the global transcriptional response to the silencing of each ACC1, ACLY or ETV4 by two independent shRNAs under hypoxia (each shRNA was done in triplicate). The transcrip-tional responses were determined by zero-transformation against the shScramble cells [48]. Next, the data were filtered with a 1.7-fold change in at least six arrays and the selected 641 pro-besets were grouped by hierarchical clustering (Fig 4a). This analysis revealed a remarkable similarity between the transcriptional responses to the depletion of ETV4, ACC1 or ACLY with the induction and repression of common sets of genes (Fig 4a). Using the GATHER [49] algorithm, we noticed an“anti-apoptotic expression program”that included both the induc-tion of negative regulators of apoptosis signaling such as NQO1, CYP1B1 and SERPINE1 [50,51] and the repression of the apoptosis-promoting genes BIK, TNFRSF9, TNFAIP3, GLIPR1, DDIT and TRIB3 (Fig 4a). The induction and repression of multiple genes in the shACC1, shACLY and shETV4 cells were confirmed by real-time qPCR (Fig 4b and 4c). Using GSEA, these gene expression changes were highly overlapping in all pairwise comparisons with both up- and down-regulated genes (S4h and S4i Fig).
Next, we evaluated whether the ACC1-affected genes were transcriptional targets of ETV4 by two different approaches. First, we compared publicly available ETV4 ChIP-seq data (Cis-trome Finder [52]) from PC3 cells [53] with the genes that were changed in our microarray analysis of H1975 cells with loss of ETV4, ACC1 or ACLY (Fig 4a). While performed in a dif-ferent cell (PC3), these analyses still identified at least two potential direct ETV4 target genes, PLEC (S5a Fig) and DUSP6 (S5b Fig). For both genes, there were peaks indicating direct ETV4
Fig 3. Depletion of ETV4 protects cells from hypoxia-induced apoptosis.(A) qPCR analysis of ETV4 mRNA levels in shACC1 cells in normoxia and hypoxia (n = 6). (B) Western blot of ETV4 protein levels in shACC1 cell lines under normoxia and hypoxia. (C) Western blot of ETV4 protein levels in shETV4 cell lines under normoxia and hypoxia. (D) Crystal violet staining of two distinct shETV4 cell lines after 4 days of hypoxia. (E) Percent of cells in the sub-G1 phase as determined by PI staining of indicated cell line after 4 days of hypoxia (n = 6). (F) Western blot of intact and cleaved PARP in shETV4 cell lines under normoxia or hypoxia. Data are represented as mean values +/- SEM. Data are from the H1975 cell line.
Fig 4. Silencing ETV4 triggers similar gene expression changes as loss of ACC1 or ACLY.(A) Heat map of transcriptional responses to the depletion of indicated genes (ETV4, ACC1 or ACLY) by two shRNAs each (n = 3 per shRNA) under hypoxia. Data are log2 values, zero transformed to the scramble shRNA cells. Filtering criteria of at least six occurrences with values greater than 1.7 resulted in 641 probesets. (B,C) qPCR validation of mRNA changes of similarly (B) down-regulated and (C) up-regulated genes with depletion of ETV4, ACLY or ACC1 (n = 6). (D) Binary regressions of shACC1 (left panel) or shACLY (right panel) and shETV4 gene signatures when compared across gene expression patterns of 130 breast cancer tumor samples (see text and Methods).
binding that overlapped with histone H3 lysine 27 acetylation (a mark of actively transcribed gene bodies) and DNase hypersensitive regions of open chromatin (S5a and S5b Fig). DUSP6 has been previously described as an ETS transcription factor family target [54,55]. While PLEC was reported to interact with vimentin, an ETV4 direct target [56], this analysis suggested that PLEC itself may represent a novel ETV4 target. In the second approach, we used qPCR to determine if the ACC1-affected genes could be“rescued”by ETV4 over-expression. We found that CTSS, COL13A1, DUSP6 and SERPINE1 could be reversed by ETV4 re-expression (S6a and S6b Fig). In contrast, the ACC1-altered expression of other genes was either partially or not restored upon ETV4 overexpression (S6c Fig). This analysis suggested that some of the gene expression changes discovered by our microarray analysis may represent direct effects of changed ETV4 transcription, while others likely represent more indirect changes with ETV4 loss. Together, these data indicated that the repression of ETV4 played an important role in a subset of the transcriptional response to ACC1 depletion.
In order to better understand if these changes reflected an in vivo biological regulation between these genes, we developed“gene signatures”associated with the silencing of ETV4, ACC1 or ACLY using the CreateSignature algorithm [57]. These gene expression signatures represent“quantitative phenotypes”that reflect the loss of these genes. Comparing their simi-larity in different expression datasets allowed us to recognize similar quantitative changes in these genes in both in vitro experimental perturbation and human tumors. Similar“gene signa-ture”approaches have been used to define the influences of oncogenic signaling and TME stresses in multiple cancer types [58–60]. Gene expression patterns from human tumor sam-ples [61] were then separated by their similarity to our developed gene signatures associated with loss of ETV4 (shETV4), ACC1 (shACC1) and ACLY (shACLY). Binary regression from this analysis in human tumors showed highly statistically significant correlations between the shACC1 or shACLY and shETV4 signatures (Fig 4d). In other words, patient tumors with gene expression patterns more similar to the ACC1-depletion (shACC1) signature had expression patterns that were also more similar to the ETV4-depletion (shETV4) signature; likewise, patient tumors with gene expression patterns similar to the ACLY-depletion (shACLY) signa-ture also had similar gene expression patterns with the ETV4-depletion (shETV4) signasigna-ture. Importantly, this showed that the regulation between ACC1/ACLY and ETV4 was relevant in tumor expression datasets. Overall, these analyses demonstrated the similarity of the transcrip-tional responses to the depletion of ACC1, ACLY or ETV4 and suggested that ETV4 mediated a portion of the transcriptional effect downstream of ACLY or ACC1 both in vitro and in vivo.
Global metabolomics revealed that hypoxia-induced elevated
α
-ketoglutarate levels protected cells from apoptosis
Considering that ACC1 and ACLY are critical lipogenic enzymes, we performed a metabolo-mics experiment to interrogate the metabolic effects of ACC1 or ACLY depletion under nor-moxia or hypoxia. Five cell lines were evaluated in triplicate: 1 control“hypoxia-sensitive”cell line (shScramble line) and four“hypoxia-survival”cell lines (2 shACC1 lines, 2 shACLY lines). After 36 hours of treatment, cells were lysed on ice and collected to measure the intracellular levels of 15 amino acids and 45 acyl-carnitines by tandem mass spectrometry (MS/MS) and levels of 7 organic acids by gas chromatography and mass spectrometry (GC/MS). All measure-ments were normalized by total protein content per sample.
We observed several expected metabolic changes to validate our approach. Silencing ACC1 depleted basal and hypoxia-induced palmitate levels, reflecting reducedde novolipogenesis in
and lactate in control cells (S7b and S7c Fig). In addition, as previously noticed [62], hypoxia generally reduced the levels of TCA metabolites succinate, fumarate, malate, and citrate in most cells (Fig 5a). These results indicated that our metabolomics assay accurately detected the expected metabolic changes associated with inhibited lipogenesis and hypoxia exposure.
The pattern ofα-ketoglutarate (α-KG) levels in this experiment suggested that it may be an
interesting candidate for offering protection under hypoxia. In the control cells, hypoxia reduced the levels ofα-KG. However, in the hypoxia-resistant cells with depleted ACC1 and
ACLY, hypoxia increased theα-KG levels (Fig 5b), as has been seen before in hypoxia-resistant
cells [62]. We could test the possibility that levels ofα-KG contributed to survival by adding
cell-permeable dimethyl-α-KG to H1975 cells. We determined the level ofα-KG achieved
intra-cellularly after extracellular supplementation to choose a supplementation treatment that would be relevant to the levels ofα-KG seen with ACC1 or ACLY depletion. Mass spectrometry
analy-sis showed increasing amounts of intracellularα-KG after supplementation in a dose-dependent
manner (Fig 5c) and that dimethyl-α-KG supplementation at 1mM achieved levels ofα-KG
comparable to the hypoxia-induced increase found in the ACC1 and ACLY depleted cells under
Fig 5. Loss of ACC1 or ACLY results in elevated levels ofα-KG under hypoxia.(A) Heat map showing percent change under hypoxia of various organic acids in indicated cell lines. Yellow = increase in hypoxia; Blue = decrease in hypoxia. Each shRNA cell line (2 per gene) was done in triplicate (n = 3). (B) Protein-normalized fold change of intracellularα-KG levels in hypoxia in indicated cell lines. Dashed line indicates no change in hypoxia from normoxia (n = 3). (C) Normalized intracellular levels ofα-KG after supplementation with indicated concentration dimethyl-α-KG for 24 hours (n = 3). (D) Western blot of intact and cleaved PARP afterα-KG supplementation in control cells under normoxia or hypoxia for 48 hours. Data are represented as mean values +/- SEM, unless otherwise noted. Data are from the H1975 cell line.
hypoxia (Fig 5b). Supplementation of relevant levelsα-KG also inhibited PARP cleavage under
hypoxia (Fig 5d). These data indicated that the increasedα-KG under hypoxia in the ACC1 and
ACLY depleted cells recapitulated the hypoxia-protective phenotype of these cells.
Hypoxia-induced increased
α
-ketoglutarate levels regulated ETV4,
possibly through 2-oxoglutarate/Fe(II)-dependent dioxygenases
With bothα-KG and ETV4 acting downstream of ACC1 or ACLY, we next determined ifα
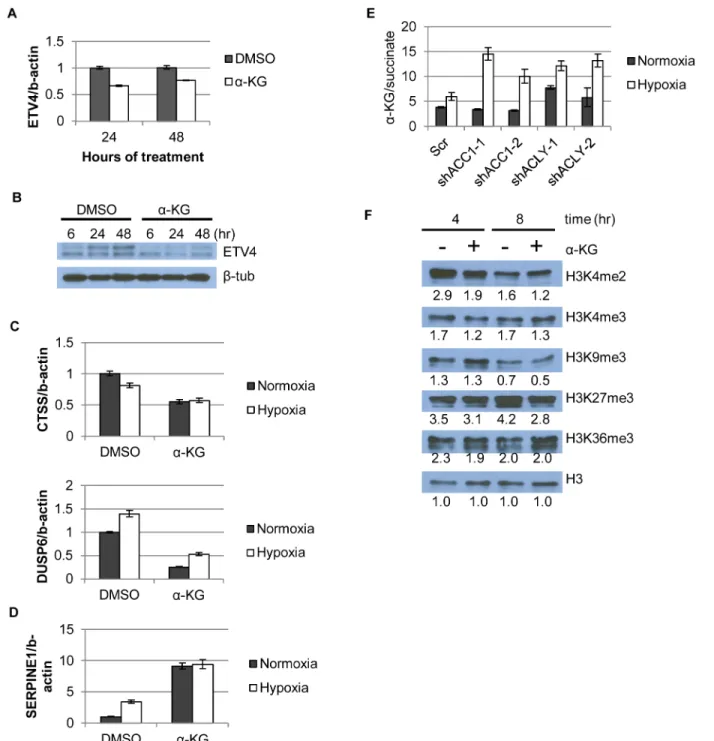
-KG was mediating the effects of ACC1 or ACLY on ETV4 expression.α-KG supplementation
reduced mRNA and protein levels of ETV4 at both lower (Fig 6a and 6b) and higher concentra-tions (S7d and S7e Fig). Additionally,α-KG supplementation in control cells caused similar
changes in repressed and induced genes as was caused by ACC1, ACLY or ETV4 silencing (Fig 6c and 6d), and some of these mRNA effects were dose-dependent withα-KG supplementation
(S7f and S7g Fig). Unexpectedly, diM-α-KG supplementation increased HIF–1αprotein levels
(S7h Fig). Since the regulation of HIF–1αwas different with depletion of ACC1/ACLY orα
-KG supplementation, the changes in HIF–1αprotein did not likely explain the improved
hyp-oxic cell survival of the ACC1/ACLY depleted cells. Combined, these data indicated that, in the ACLY or ACC1 depleted cells, theα-KG increase was a hypoxic trigger that reduced ETV4
lev-els and activity to mediate an anti-apoptotic gene expression response.
In addition to being a TCA cycle intermediate,α-KG is a substrate for the abundant
2-oxo-glutarate/Fe(II)-dependent dioxygenases (2-OGDDs) [26]. 2-OGDDs useα-KG and molecular
oxygen as substrates to perform a number of different protein modification reactions. These enzymes include families of histone demethylases that recognize and remove methylation marks from histones, as well as the TET family of proteins that facilitate DNA demethylation [26]. Thus,α-KG levels can affect gene expression through the activities of these 2-OGDDs
[28]. An elevated ratio ofα-KG/succinate (substrate/product ratio) has been proposed as a
potential indicator of increased 2-OGDD activity [25,28]. We found that theα-KG/succinate
ratio was significantly elevated in all of the shACC1 and shACLY cells under hypoxia (Fig 6e). To better understand if the level ofα-KG or theα-KG/succinate ratio determined our
hypoxia-survival phenotypes, we supplemented ACLY or ACC1 depleted cells with cell-permeable dimethyl-succinate to theoretically drive theα-KG/succinate ratio in the opposite direction
from whenα-KG was added. Succinate supplementation did not affect the survival of either
shACC1 or shACLY cells under hypoxia (S8a and S8b Fig) and also did not affect the regula-tion of ETV4 by ACC1 or ACLY (S8c and S8d Fig). Therefore, in our experimental system, we concluded that the levels ofα-KG, rather than theα-KG/succinate ratio, were driving the
hyp-oxia survival phenotypes.
While the succinate supplementation did not affect our phenotype, the elevatedα-KG in the
ACC1 or ACLY depleted cells under hypoxia still suggested that 2-OGDDs may be relevant in our system. Therefore, we hypothesized thatα-KG affected ETV4 mRNA abundance by altering
the activity of 2-OGDDs and subsequent histone methylations. As a control, we tested the DNA methylation status of the two shore regions and the center region of the ETV4 promoter CpG islands by bisulfite pyro-sequencing and saw no significant change uponα-KG supplementation
(S8e Fig). However,α-KG caused a global reduction in two (H3K4me2 and H3K4me3)“active”
histone methylation marks and also globally reduced two“repressive”marks, H3K27me3 and, to a lesser extent, H3K9me3 (Fig 6f). When we compared the epigenetic changes associated with
α-KG supplementation with Carey et al.[28], we found that H3K27me3 was consistently
reduced with the addition ofα-KG in both studies. However, there were also differences in the
histone methylation changes caused byα-KG across the studies: 1) H4K20me3 was reduced
decrease in the levels of H3K4me3, no changes were seen previously. These differences could be due to different cellular contexts (embryonic stem cells vs. cancer cells) or the presence of gluta-mine deprivation during the previous examination ofα-KG effects [28]. Similar changes were
observed using either water or DMSO as control (S8g Fig). Collectively, the reduced levels of
Fig 6.α-KG regulates ETV4 mRNA levels and activity through epigenetic changes.(A) qPCR showing ETV4 mRNA levels afterα-KG supplementation (1mM) over time (n = 6). (B) Western blot showing ETV4 protein levels afterα-KG supplementation (1mM) over time. (C,D) qPCR of gene expression changes afterα-KG supplementation (3.5mM, 24h) for both (C) down-regulated genes (similar toFig 4b) and (D) up-regulated genes (similar toFig 4b and 4c) (n = 6). (E) Ratio ofα-KG/succinate in normoxia and hypoxia in the indicated cell lines from the metabolomics experiment (n = 3). (F) Western blot showing effect ofα-KG supplementation (1mM) on histone methylation marks after indicated time of treatment. Numbers indicate densitometry analysis by Image J relative to that sample’s loading of total H3. Data are represented as mean values +/- SEM. Data are from the H1975 cell line.
multiple methylation marks were consistent with our hypothesis that predicted more active his-tone demethylases as a result of increased levels ofα-KG.
To extend evidence in support of our model, we also examined various histone methylation modifications associated with the depletion of ACC1 or ACLY. Overall, we saw similar global histone methylation changes in both the shACC1 (Fig 7a) and shACLY (Fig 7b) cells as com-pared toα-KG supplementation. Among all the tested epigenetic markers, the H3K4me3 mark
was the most pronouncedly decreased across both gene depletions and theα-KG treatment.
The H3K4me2 mark was decreased in all three conditions (shACC1, shACLY,α-KG
supple-mentation) to a modest degree. Similarly, H3K9me3 was decreased somewhat with the 8 hour
α-KG treatment and in the shACC1 cells, while it was more strongly decreased in the shACLY
cells. H3K27me3 was lowered by bothα-KG and ACC1 depletion. Levels of H4K20me3 were
unchanged in the shACC1 and shACLY cells while they were increased withα-KG treatment,
and so this suggested that the changes in this methyl mark were likely not due to the changes we explain in our model.
Besides global epigenetic changes, we also determined if histone methylation at the ETV4 locus was changed by chromatin immunoprecipitation of the“active”histone H3 lysine 4 tri-methylation (H3K4me3) mark. This mark was chosen because it showed the most consistent and strongest changes across either genetic depletion or withα-KG supplementation. In
addi-tion, a loss of this“active”mark H3K4me3 would be consistent with decreased ETV4 expres-sion in these conditions. ChIP experiments showed thatα-KG treatment decreased the
abundance of the H3K4me3 modification at the ETV4 locus by ~30% (Fig 7c). Additionally, there was a decreased abundance of H3K4me3 in both ACC1 and ACLY depleted cells under hypoxia as compared to control cells (Fig 7d and 7e). Together, these data showed that elevated levels ofα-KG affected the histone, but not DNA, methylation status of the ETV4 locus and
this pattern was similar to the histone methylation changes seen under hypoxia in the shACC1 and shACLY cells.
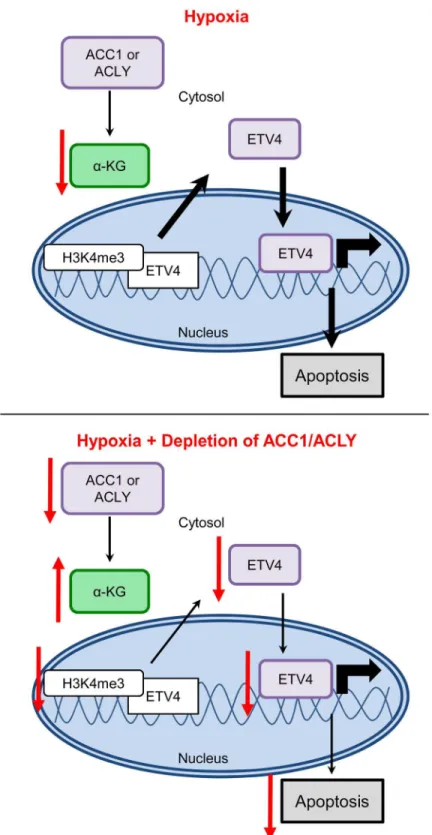
Collectively, our data was consistent with a model in which, under hypoxia, the inhibition of ACC1 or ACLY increases levels ofα-ketoglutarate to block hypoxia-induced apoptosis by
reduc-ing the levels and activity of ETV4, possibly through altered histone methylation patterns (Fig 8). These data offer a novel molecular connection showing that the transcriptional output of altered lipogenic metabolism can modulate the cellular response to and survival under hypoxia.
Discussion
Here we have described a pooled shRNA screen that successfully identified genes that influence cancer cell survival under hypoxia and lactic acidosis. Specifically, we showed that blockingde novolipogenesis through the genetic depletion ofACLYorACC1protected multiple cancer
cells from hypoxia-induced apoptosis through increased levels ofα-ketoglutarate and the
inhi-bition of ETV4 and its transcriptional activities. Therefore, inhiinhi-bition of ACLY or ACC1 affected both metabolism and transcription to protect cells from hypoxia-induced apoptosis. These results also suggest that one important mechanism of hypoxia-induced apoptosis is through the reduction ofα-KG, which potentially elevates the levels and activity of ETV4
through histone modifications to promote oncogenesis and trigger apoptosis.
Inhibitors that target ACLY and ACC1 are proposed cancer therapeutics [63,64]. ACC1 has been targeted as it is the rate-limiting enzyme in lipogenesis, a process critical for cancer cells’
Fig 7. Histone methylation changes in shACC1 and shACLY cells under hypoxia.(A) Western blot showing levels of the indicated histone methylation marks in shACC1 cells under normoxia or hypoxia (24h). (B) Western blot showing levels of the indicated histone methylation marks in shACLY cells under normoxia or hypoxia (8h). (C) ChIP-qPCR analysis of the abundance of the H3K4me3 mark at two locations in the promoter region of ETV4 afterα-KG treatment (n = 6). (D, E) ChIP-qPCR analysis of the abundance of the H3K4me3 mark at two locations in the promoter region of ETV4 after ACC1 or ACLY depletion under normoxia and hypoxia (n = 9). n.s. = not significant;*= p<0.05,**= p<0.01,***= p<0.005,*****= p<0.0001. Data are represented as mean values +/- SEM. Data are from the H1975 cell line.
Fig 8. Model for how loss of ACLY, ACC1, or ETV4 protects cells from hypoxia-induced apoptosis.
while we expect ACLY and ACC1 inhibition to have opposite effects on levels of acetyl-CoA, their effects on gene expression were highly similar. This suggests that levels of acetyl-CoA (and subsequent histone acetylation or changes in epigenetic states) may not readily explain the majority of gene expression responses to the inhibition of ACC1 or ACLY under hypoxia. Instead, the ACC1/ACLY-induced reduction in ETV4 levels and activity seemed to account for a significant portion of the hypoxic transcriptional changes. These results suggest that lipogenic inhibitors that block ACC1 or ACLY may be particularly effective for tumors driven byETV4.
Likewise, this reduction of the oncogenic driver ETV4 may account for portions of the thera-peutic potential of lipogenic inhibitors. However, our data also showed that these treatments may allow for the survival of slowly proliferating cancer cells in regions of hypoxic tumors. Therefore, targeting lipogenesis in cancer may need to be combined with other therapeutic approaches that target hypoxic regions (such as hypoxia-activated pro-drugs), to eliminate the cancer cells that may be dormant and protected in the hypoxia-niche.
Elevatedα-KG levels in the shACLY and shACC1 cells under hypoxia could be due to
increased generation or decreased consumption of this metabolite. A portion ofα-KG is
con-sumed during lipogenesis, which is further promoted under hypoxia by reductive carboxyla-tion [12,65]. Therefore, blocking lipogenesis under hypoxia may lead to a“build-up”of upstream metabolites, includingα-KG. It is well appreciated thatα-KG plays a critical role in
supporting cell survival by replenishing the metabolic intermediates of the TCA cycle. Here, our data indicated than an additional manner by whichα-KG can affect cellular survival under
hypoxia was by regulating ETV4 expression, possibly through epigenetic mechanisms. Transcriptional adaptation to hypoxia is most often orchestrated by the HIFs; however, here we showed that cancer cells’hypoxic survival can be mediated by a different transcription factor, ETV4. ETV4 was proposed as an essential co-activator of HIF–1αand to have a hypoxic
transcriptional program [66]. Our data revealed that ETV4 was critical for hypoxia-induced apoptosis. Interestingly, the levels of ACC1 or ACLY influencedα-KG and ETV4 levels under
hypoxia, thereby providing a link between lipogenesis, a TCA cycle intermediate and transcrip-tion. Therefore, ETV4 mediated the transcriptional output of varying degrees of active lipogen-esis caused by changing ACC1 and ACLY levels. Our gene signature analyses also suggested that this regulation was preserved in human tumors in vivo. While the global and local ETV4 epigenetic changes we describe herein were consistent with decreased activity of ETV4 to pro-tect cells from hypoxia-induced apoptosis, our evidence provides only correlative support with reduced promoter activity and does not provide a causal explanation for the ETV4 repression. Additionally, although this regulation seemed mostly specific to ETV4, we do not fully exclude the possibility that other ETS transcription factor family members contribute to an apoptotic, hypoxic transcriptional program. Overall, our data establishes ETV4 as one critical factor that influences hypoxic cell survival and transcriptional responses downstream from ACC1 and ACLY, and reveals the metaboliteα-ketoglutarate as a molecular link between metabolic and
transcriptional adaptation to hypoxia.
In addition to its importance in the TCA cycle, our experiments showed that elevatedα-KG
could alter histone methylation patterns, likely viaα-ketoglutarate-dependent dioxygenases, to
potentially regulate ETV4. While the causal relationship of several regulatory steps of this hypothesis was not rigorously tested by genetic manipulations here, our data was consistent with such a model. Previous reports suggested thatα-KG/succinate ratios determined the
direction and activities of dioxygenases [28], yet our data indicated that it was increasedα-KG,
not succinate orα-KG/succinate, that drove the epigenetic changes, ETV4 repression and
hyp-oxia survival phenotypes. As a substrate,α-KG levels likely affect the enzymatic activities of of
were changed with depletion of ACC1, ACLY orα-KG treatment suggested that many different
demethylases could be affected byα-KG or the depletion of ACC1/ACLY in these cellular
states. While there are no histone methyltransferases currently known to useα-KG as a
sub-strate, they are regulated by hypoxia [67,68], and so we do not exclude the potential for changes in histone methylation patterns to be due to changes in both methyltransferase and demethy-lase enzyme activities. Additionally, the changes in global histone methylation patterns are very likely affecting a number of other genes’expression patterns, in addition to the changes we see at the ETV4 locus.
Sinceα-ketoglutarate supplementation and loss of ACC1 or ACLY reduced the abundance
of H3K4me3 at the ETV4 promoter, we speculate that the JARID1 (KDM5) family of histone demethylases, which specifically demethylate H3K4me2/3 residues, could be affecting the abundance of this mark at the ETV4 locus [69,70]. These enzymes are known to range in their expression and activity by cell type and are differentially influenced by oxygen levels [71–73]. A full investigation in to the mRNA, protein and activity levels of many of these family mem-bers would be necessary to determine the extent to which each plays a role in regulating ETV4 under hypoxia. Effort has been made to investigate the JARID1 family of H3K4 demethylases as potential cancer drug targets [70,74,75] as the importance of a mis-regulated“histone code”
for tumorigenesis is well recognized. While some reports suggest a tumor suppressive role of these enzymes, more suggest an oncogenic function [69]. This information and the data we presented here suggest that various 2-OGDDs in distinctive contexts differentially affect tumorigenesis and tumor cell survival. It will be important to understand the proper context of treatment if these drugs continue into the clinic.
Multiple previous reports show that the activity of ACLY [64,76,77], ACC1 [78–81] or ETV4 [82–85] is associated with increased tumorigenicity and/or poor patient outcome, or that inhibiting these genes’activities reduces tumorigenicity and improves patient outcome. We show that the inhibition of ACLY, ACC1 or ETV4 paradoxically allows tumor cells to sur-vive better under hypoxia. To address this apparent conundrum, we propose a conceptual model in which there are two cellular states: one of activating oncogenesis and the other of stress survival. This model includes a trade-off between the two states, such that the promotion of one comes at the expense of the other. Stated another way, the activation of oncogenic pro-grams may also render cells susceptible to apoptosis, especially under stress; likewise, reduced oncogenic programs slow cellular proliferation to a“dormant”state that could allow for better stress survival. A similar model has been proposed for several oncogenes. For example, onco-genesis driven by MYC rendered non-transformed cells vulnerable to hypoxia-induced apopto-sis [86,87]; the degradation or cleavage of c-MYC under hypoxia allowed tumor cells to evade hypoxia-induced apoptosis [88,89]. E2F can promote proliferation (oncogenesis) or apoptosis in different contexts, such as with differing PI3K activity [90]. A recent paper also indicated that HIF–1αrepressed the ATF4 stress response pathway to allow for the expansion of fetal
cardiomyocytes [91]. According to this proposed model and our data, cancer cells treated with ACLY or ACC1 inhibitors (including metformin), may die due to blocked lipogenesis, but may also survive in hypoxic regions. As these cells resist death under stress, they may become the
Materials and Methods
shRNA screen and analysis
H1975 cells were spin-infected with the pMSCV-based retroviral genome-wide library, at an MOI of 0.3, divided into six sub-pools, achieving a final library representation of 1000 cells per shRNA after selection with 1 ug/ml puromycin [37]. After three days of puromycin selection, cells were split into control and stress conditions, maintaining 1000-fold representation of each shRNA per triplicate. Cells were serum starved to 0.1% FBS 24 hours after plating. 24 hours after serum starvation, media was changed to treatment media (0.1% FBS, 25mM Hepes); con-trol and hypoxia media pH = 7.4; lactic acidosis treatment had 25mM lactic acid (Sigma cat. no L6402) adjusted to pH = 6.7 and filter sterilized. After 4 days of treatment, cells were harvested, centrifuged, and frozen at -80°C. Genomic DNA was extracted with the QIAamp DNA Blood Maxi kit (QIAGEN, cat.no 51194) then shRNA sequences were PCR amplified. The amplified products from the control and each stress were labeled (Cy3 and Cy5, respectively) and then interrogated by a custom Agilent microarray, which contained probes against the library’s shRNA sequences [37]. We validated the sensitivity and specificity of the array to different ratios of labeled PCR product (S1a Fig). Therefore, relative hybridization of the Cy5/Cy3 labeled shRNA populations determined the abundance of each shRNA under control, hypoxia or LA. The Cy3 and Cy5 signals across the three biological replicates were highly reproducible (S1b Fig). Probes with signal intensities of less than 2-fold above background were discarded. Cy5/Cy3 ratios, also called“R/G”ratios, for remaining probes were calculated, log2 trans-formed and quantile normalized across pools. The R/G ratios ranged from +/- 4.0, although many fell in the“unchanged”range of +/-0.5 (S1c Fig).
For the“multiple hairpin analysis,”genes were considered a hit when they had 1) at least 2 different shRNAs with (absolute value R/G)>0.7 in at least 2 of the three biological replicates
(2) the (stdev/ave) of the biological replicates was<0.5 (S1 Table).
Cell culture, TME stress treatments and generation of stable shRNA cell
lines
H1975 cells were cultured in RPMI media (GIBCO cat. no 11875) supplemented with 10% Fetal bovine serum (heat-inactivated), 1% glucose, 10mM HEPES, 1mM sodium pyruvate, and 1x antibiotics (penicillin, 10,000 UI/ml; streptomycin, 10,000 UI/ml), as directed by the Duke Cell Culture Facility. MDA-MB–231 and PANC–1 cells were cultured in DMEM (GIBCO cat. no. 11995) supplemented with 10% Fetal bovine serum (heat-inactivated) and 1x antibiotics (penicillin, 10,000 UI/ml; streptomycin, 10,000 UI/ml). Cell lines, obtained from and initially validated by the Duke Cell Culture Facility (Durham, NC, USA), were maintained for fewer than 6 months and validated by microscopy every 1 to 2 days.
Lactic acidosis was generated via addition of lactic acid (Sigma-Aldrich, St. Louis, MO, USA, cat. no L6402) and media pH adjustment to pH 6.7 by HCl immediately before use. Hyp-oxia was generated with a cell culture incubator with 93–94% N2, 5% CO and 1–2% O2. For the
α-KG rescue experiments, media was supplemented with 0.875-4mM dimethylα-KG as
indi-cated in figure legends (Sigma, cat. no. 349631). For all stress experiments, cells were serum starved (0.5% FBS) for 24 hours before treated with stress under 0.5% FBS. All survival/viability measurements were made after 4 days of stress treatment.
Stable cell line generation
of pMDG2: pVSVG: pLKO.1 with Lipofectamine 2000 in the evening. Media was changed the following morning and virus collected 48 hours after transfection. Stable cell lines were gener-ated by adding 200ul virus to a 60mm dish of parental cells with polybrene (final concentration 8ug/ml). Complete death in blank infection dishes was used to determine success of infection and puromycin selection. The efficiency of silencing or overexpression was determined by western blots. Concentrations of puromycin needed for selection: H1975 cells = 1ug/ml, MDA-MB–231 cells = 1ug/ml, PANC–1 cells = 2ug/ml. For stable overexpression, concentra-tion of blasticidin used was 2.5ug/ml in H1975 cells.
Crystal violet staining
Cells were fixed either in 4% paraformaldehyde (PFA) overnight at 4°C or at room temperature for 30 min. PFA was removed and crystal violet staining solution (0.2% crystal violet, 25% methanol, 75% water) gently shaken on cells for 30+ minutes at room temperature. Staining solution was removed and plates rinsed with tap water 2–3 times. For quantitation, completely dried stain was dissolved by adding 10% acetic acid and shaking gently at room temperature for 30+ min before reading absorbance at 570 nm.
Determination of cell number
Cell number was evaluated by either direct cell counting (trypan blue exclusion) or high-throughput microscopic counting (HTC) of fixed and stained nuclei. For direct cell counting, at designated time after treatment, media was removed, cells were not rinsed for fear of losing loosely-attached cells, trypsinized, diluted 1:1 with trypan blue and immediate counted on a hemocytometer. For HTC experiments, after designated time period, cells were fixed in 4% PFA either overnight at 4°C or for 30 min at RT. Cells were washed 2x, permeabilized with 0.1% Triton-X in PBS, wash 2x, stained with 50ug/ml Hoescht dye (Sigma cat. no B2261) for 30 min, RT in the dark, then washed 2x and PBST added to each well and scanned by the Cello-mics high-throughput microscope at the Duke RNAi Core Facility.
Flow cytometry
For cell cycle analysis, after 4 days of stress treatment, media was collected, cells trypsinized and pooled with the media. Cells were centrifuged then fixed by resuspension in ice cold 70% ethanol while gently vortexing. Fixed cells were placed at -20°C until prepared for FACS analy-sis. Immediately before FACS analysis, cells were centrifuged for 5 min at room temperature, washed twice in PBS then resuspended in 25ug/ml Propidium iodide (Sigma cat. no P4864) and 10ug/ml RNAse A in PBS. Cells were stained for 30+ min in the dark then 8000 events measured on a Canto II Flow cytometer.
Protein lysate collection and Western blots
EpiQuick Total Histone Extraction Kit (Epigentek, cat.no. OP–0006) and 2ug of protein were resolved on 15% SDS-PAGE gels or nuclear fractions were collected by the REAP fractionation method [92] and 7.5–30 ul of lysate were run in each lane. Please contact for details on anti-body usage.
Quantitative real-time PCR
RNA was extracted using the RNeasy Kit (QIAGEN). A total of 1μg of total RNA was reverse
transcribed by SuperScript II (Invitrogen) for real-time PCR with Power SYBRGreen Mix (Applied Biosystems/Life Technologies (Grand Island, NY, USA)). Primers were designed across exons whenever possible, verified for specificity by regular PCR prior to use in real-time PCR. Please contact for the sequences of primers used.
Microarrays and analysis
Samples were collected on ice and RNA was isolated with QIAGEN’s RNeasy Mini Kit (cat. no 74104) according to manufacturer’s instructions. After quality control assessment with the Agilent BioAnalyzer, cDNA was amplified from 200ng RNA with the Ambion MessageAmp Premier RNA Amplification (Life Technologies, Grand Island NY, USA). The gene expression pattern of the RNA samples were interrogated with Affymetrix U133A genechips and normal-ized by the RMA (Robust Multi-Array) algorithm. cDNA synthesis and microarray interro-gation was performed by the Duke Microarray Core. The influence of the silencing ofACC1or ACLYon gene expression was derived by a zero transformation process, in which we compared
transcript level for each gene in cells with stably integrated shRNAs targeting ACC1 or ACLY to the average transcript levels in control scramble shRNA cell line samples. Data was then fil-tered as described with Cluster 3.0 software and heat maps were generated with TreeView. To generate gene signatures of knockdown of ACLY, ACC1 or ETV4, the CreateSignature module in GenePattern (https://genepattern.uth.tmc.edu/gp/pages/login.jsf) was used with scramble cells expression pattern as the train0 set, knockdown cells’gene expression pattern as train1 set and the Gray dataset [61] used as the test set. Default parameters were used for the analysis similar to [58]. The resulting probabilities of gene signature expression in each patient for each knockdown signature were analyzed by simple linear regression in the JMP Pro 11 software.
Statistical analysis
Data, unless otherwise noted, represent the mean +/- the standard error of the mean and n indicates number of replicates used to generate the SEM. P-values were determined either by a two-tailed Student’s t-test in Excel or by a two-way ANOVA with StatView.
Metabolomics profiling and analysis
condition were placed on ice and washed twice with ice-cold PBS before as much PBS as possi-ble was removed. Cells were lysed in 620ul ml of 0.78% Formic Acid in water and scraped to collect. 30ul were removed for protein quantification. 1x volume of the collected pellet (~800ul) of acetonitrile was added and sample was vortexed vigorously. Aliquots were sepa-rated for mass spectrometry measurements (300 ul for organic acids, 100 ul for amino acids/ acyl-carnitines) and were immediately frozen on dry ice and transferred to -80°C. Analysis: Protein concentration per replicate was determined by the Pierce BCA Kit (ThermoScientific, Waltham, MA, USA) and used to normalize all metabolite levels.
NADP+/NADPH measurements
A ratio of NADP+/NADPH was calculated after measuring each molecule separately with the Amplite Fluorimetric NADP/NADPH Ratio Assay Kit from AAT Bioquest, Inc (Sunnyvale, CA). Protocol was conducted as the manufacturer suggested and all values were normalized to protein content, as measured by the Pierce BCA kit, on similarly plated and treated samples done in parallel.
Chromatin Immunoprecipitation
3 million H1975 cells were plated in 15 cm dishes, after 24 hours they were serum starved to 0.5% FBS, 24 hours later they were treated with either a 4-hour treatment ofα-KG or an 8 hour
treatment of hypoxia before collection for a native ChIP. Protocol was carried out as manufac-turer suggested with the SimpleChIP Plus Enzymatic Chromatin IP Kit (Agarose Beads) (Cell Signaling Tech., cat. no. 9004). Sonication and digestion were performed to obtain chromatin 1–4 nucleosomes in size, which was verified by gel electrophoresis. Each IP used chromatin prepared from 4–5 million cells and was performed overnight.
DNA Methylation
Genomic DNA was extracted with the DNeasy Blood & Tissue Kit according to the protocol provided by the manufacturer (Qiagen). The genomic DNAs (800 ng) were modified by treat-ment with sodium bisulfite using the Zymo EZ DNA Methylation kit (Zymo Research, Irvine, CA). Bisulfite treatment of denatured DNA converts all unmethylated cytosines to uracils, leav-ing methylated cytosines unchanged, allowleav-ing for quantitative measurement of cytosine meth-ylation status. Pyrosequencing was performed using a Pyromark Q96 MD pyrosequencer (Qiagen). The bisulfite pyrosequencing assays were used to quantitatively measure the level of methylation at CpG sites contained. Assays were designed to query CpG islands using the Pyromark Assay Design Software (Qiagen). Pyrosequencing was performed using the sequenc-ing primer. PCR conditions were optimized to produce a ssequenc-ingle, robust amplification product. Defined mixtures of fully methylated and unmethylated control DNAs were used to show a lin-ear increase in detection of methylation values as the level of input DNA methylation increased (Pearson r>0.98 for all regions). Once optimal conditions were defined, each assay was
ana-lyzed using the same amount of input DNA from each specimen (40 ng, assuming complete recovery after bisulfite modification). Percent methylation for each CpG cytosine was deter-mined using Pyro Q-CpG Software (Qiagen).
Supporting Information
of hypoxia and lactic acidosis treated samples for both Cy3 and Cy5 signals. (C) Distribution of R/G ratios by number of shRNAs, separated by treatment (LA = lactic acidosis, H = hypoxia) and replicate (n = 3).
(TIF)
S2 Fig. Depletion of ACLY or ACC1 is protective under hypoxia in different cell types.(A) Western blot of ACC1 protein knockdown by 2 shRNAs in MDA-MB–231 cells. (B) Quanti-fied crystal violet of shACC1 MDA-MB–231 cells after 4 days of hypoxia (n = 3). (C) Western blot of ACLY protein knockdown by 2 shRNAs in MDA-MB–231 cells. (D) Quantified crystal violet of shACLY MDA-MB–231 cells after 4 days of hypoxia (n = 3). (E) Western blot of ACC1 protein knockdown in PANC–1 cells. (F) Western blot of ACLY protein knockdown in PANC–1 cells. (G) Quantified crystal violet staining of indicated shRNA PANC–1 cells after 6 days of hypoxia (n = 3). (H) Crystal violet staining of H1975 cells with simultaneous metformin treatment and hypoxia for 4 days. (I) Western blot of PARP in H1975 cells with hypoxia and metformin treatment. (J) Counts of viable cell number by trypan blue exclusion of shACC2 cells under normoxia or hypoxia for 4 days (n = 9). (K) and (L) Crystal violet of ACC1 and scramble (Scr) cells (boxed in blue rectangles) under indicated stresses (K-hypoxia, L- LA (lac-tic acidosis), no glutamine or no glucose (Glu)) for 4 days. Data are represented as mean values +/- SEM.
(TIF)
S3 Fig. Depletion of ACLY or ACC1 leads to decrease HIF–1αprotein expression in
multi-ple cell types.(A) Western blot of HIF–1αprotein levels with ACC1 knockdown by 2 shRNAs
in H1975 cells. (B) Western blot of HIF–1αprotein levels with ACC1 knockdown by 2 shRNAs
in MDA-MB–231 cells. (C) Western blot of HIF–1αprotein levels with ACC1 knockdown by 2
shRNAs in PANC–1 cells. (D) Western blot of HIF–1αprotein levels with ACLY knockdown
by 2 shRNAs in H1975 cells. (E) Western blot of HIF–1αprotein levels with ACLY knockdown
by 2 shRNAs in MDA-MB–231 cells. (TIF)
S4 Fig. Depletion of ACLY or ACC1 does not protect through NADPH, ATP or other PEA3 family members.(A) NADP+/NADPH ratio under normoxia and hypoxia in shScr or shACC1 H1975 cells (n = 6). (B) Crystal violet staining of shScramble H1975 cells treated with N-acetyl cysteine (2mM) under normoxia or hypoxia for 4 days. (C) Quantified crystal violet staining of shScramble H1975 cells after addition of glutathione under normoxia or hypoxia (n = 3). (D) Protein-normalize ATP levels in indicated shRNA cell line under normoxia or hypoxia (n = 9). (E) qPCR analysis of ETV4 mRNA levels in shACLY cells under normoxia or hypoxia (n = 6). (F) Western blot of ETV4 protein levels with ACLY knockdown under nor-moxia or hypoxia. (G) qPCR results of ETV1 and ETV5 mRNA levels in shACC1 cells under hypoxia or normoxia (n = 6). (H, I) GSEA analysis showing high overlap of genes changed with ETV4 and ACC1 (left panels) or ACLY (right panels) depletion. (H) Enrichment of ETV4-up-regulated genes in shACC1 (left panel) or shACLY (right panel) cells. (I) Depletion of ETV4-down-regulated genes in shACC1 (left panel) or shACLY (right panel) cells. Data are represented as mean values +/- SEM. All data are from the H1975 cell line.
(TIF)
acetylated-Histone H3 lysine 27 (H3K27Ac) at these locations; (v) dark bars to represent DNase hypersensitivity clusters at these genomic locations.
(TIF)
S6 Fig. ACC1-altered genes likely represent both ETV4-dependent and -independent tran-scriptional targets.(A) Western blot showing overexpression of ETV4 in ACC1 depleted cells by 2 shRNAs. (B) qPCR analysis of a set of indicated genes whose ACC1-affected changes can be reversed with ETV4 expression, consistent with a pattern consistent of being downstream targets of ETV4 (n = 6). (C) qPCR analysis of a set of indicated genes whose changes could not be reversed with ETV4 expression, consistent with a pattern of not being downstream targets of ETV4 (n = 6). Data are represented as mean values +/- SEM. All data are from the H1975 cell line.
(TIF)
S7 Fig. Metabolomics assay accurately reflects expected changes and the gene expression effects of different doses ofα-KG.(A) Protein-normalized levels of palmitate measured in the indicated shRNA cell lines under normoxia (n = 3). (B, C) Protein-normalized levels of pyru-vate (B) and lactate (C) in shScramble cells under normoxia and hypoxia (n = 3). (D) qPCR analysis of ETV4 mRNA levels after supplementation ofα-KG at 3.5mM for 24 hours (n = 6).
(E) Western blot of ETV4 protein levels after supplementation ofα-KG at 3.5mM for 24 hours.
(F, G) qPCR analysis of the changes of gene expression in the indicated genes after supplemen-tation of different levels ofα-KG for (F) up-regulated and (G) down-regulated genes (n = 6).
(H) Western blot of HIF–1αprotein levels after supplementation ofα-KG at indicated
doses.= p<0.0001. Data are represented as mean values +/- SEM. All data are from the
H1975 cell line. (TIF)
S8 Fig. The effects of succinate andα-KG levels on the DNA methylation and epigenetic changes of cancer cells.(A) Quantified crystal violet stain of shACC1 and shScr cells supple-mented with indicated dose of dimethyl-succinate under normoxia or hypoxia for 4 days (n = 3). (B) Quantified crystal violet stain of shACLY and shScr cells supplemented with indi-cated dose of dimethyl-succinate under normoxia or hypoxia for 4 days (n = 3). (C) qPCR anal-ysis of the relative change in ETV4 mRNA levels in two shACC1 cells with the addition of DMSO or succinate (4mM). Ratio of 1 (dashed line) indicates no change with treatment (n = 6). (D) qPCR analysis of the relative change in ETV4 mRNA levels in two shACLY cells with the addition of DMSO or succinate (4mM). Ratio of 1 (dashed line) indicates no change with treatment (n = 6). (E) Percent of methylated CpG sites across the two shore regions and center of the ETV4 promoter CpG island as determined by bisulfite sequencing (n = 5). (F) Western blot analysis of indicated histone modification when supplemented with either DMSO orα-KG (1mM) for indicated length of time. (G) Western blot of indicated histone
modifications withα-KG supplementation (3.5mM) for indicated length of time. Data are
rep-resented as mean values +/- SEM. All data are from the H1975 cell line. (TIF)
S1 Table. Multiple Hairpin Analysis of shRNA screens.Number of Multiple Hairpin Hit genes in genome-wide shRNA screens separated by number of short-hairpin RNAs (shRNAs) per gene.
(DOCX)
or“contextual survival”) and by stress (hypoxia or lactic acidosis) (XLSX)
S3 Table. RIGER Analysis of Hypoxia shRNA screen.Top 20 genes from RIGER analysis of log fold change and second best shRNA/gene in hypoxia“synthetic survival”category. (DOCX)
Acknowledgments
We are grateful for the technical assistance of Carole Grenier and critical discussion from members of the Chi lab.
Author Contributions
Conceived and designed the experiments: MMK BL ZH SKM DMM SYK JTC. Performed the experiments: MMK BL XT JW RDS OI ZH LAT SYK. Analyzed the data: MMK BL XT JW DC ZH JL SYK JTC. Wrote the paper: MMK BL XT DMM SYK JTC.
References
1. Gatenby RA, Smallbone K, Maini PK, Rose F, Averill J, et al. (2007) Cellular adaptations to hypoxia and acidosis during somatic evolution of breast cancer. Br J Cancer 97: 646–653. PMID:17687336 2. Gatenby RA, Gillies R.J. (2008) A microenvironmental model of carcinogenesis. Nature Reviews
Can-cer 8: 56–61. PMID:18059462
3. Cardone RA, Casavola V, Reshkin SJ (2005) The role of disturbed pH dynamics and the Na+/H+ exchanger in metastasis. Nat Rev Cancer 5: 786–795. PMID:16175178
4. Wilson WR, Hay MP (2011) Targeting hypoxia in cancer therapy. Nat Rev Cancer 11: 393–410. doi: 10.1038/nrc3064PMID:21606941
5. Abdollahi A, Folkman J (2010) Evading tumor evasion: Current concepts and perspectives of anti-angiogenic cancer therapy. Drug Resistance Updates 13: 16–28. doi:10.1016/j.drup.2009.12.001 PMID:20061178
6. Neri D, Supuran CT (2011) Interfering with pH regulation in tumours as a therapeutic strategy. Nat Rev Drug Discov 10: 767–777. doi:10.1038/nrd3554PMID:21921921
7. Sonveaux P, Vegran F, Schroeder T, Wergin MC, Verrax J, et al. (2008) Targeting lactate-fueled respi-ration selectively kills hypoxic tumor cells in mice. J Clin Invest 118: 3930–3942. doi:10.1172/ JCI36843PMID:19033663
8. Majmundar AJ, Wong WJ, Simon MC (2010) Hypoxia-Inducible Factors and the Response to Hypoxic Stress. Molecular Cell 40: 294–309. doi:10.1016/j.molcel.2010.09.022PMID:20965423
9. Bertout JA, Patel SA, Simon MC (2008) The impact of O2 availability on human cancer. Nat Rev Can-cer 8: 967–975. doi:10.1038/nrc2540PMID:18987634
10. Sun RC, Denko NC (2014) Hypoxic regulation of glutamine metabolism through HIF1 and SIAH2 sup-ports lipid synthesis that is necessary for tumor growth. Cell Metab 19: 285–292. doi:10.1016/j.cmet. 2013.11.022PMID:24506869
11. Metallo CM, Gameiro PA, Bell EL, Mattaini KR, Yang J, et al. (2012) Reductive glutamine metabolism by IDH1 mediates lipogenesis under hypoxia. Nature 481: 380–384.
12. Wise DR, Ward PS, Shay JE, Cross JR, Gruber JJ, et al. (2011) Hypoxia promotes isocitrate dehydro-genase-dependent carboxylation of alpha-ketoglutarate to citrate to support cell growth and viability. Proc Natl Acad Sci U S A 108: 19611–19616. doi:10.1073/pnas.1117773108PMID:22106302 13. Stoltzman CA, Peterson CW, Breen KT, Muoio DM, Billin AN, et al. (2008) Glucose sensing by
Mon-doA:Mlx complexes: A role for hexokinases and direct regulation of thioredoxin-interacting protein expression. Proceedings of the National Academy of Sciences 105: 6912–6917.
14. Peterson CW, Stoltzman CA, Sighinolfi MP, Han K-S, Ayer DE (2010) Glucose Controls Nuclear Accu-mulation, Promoter Binding, and Transcriptional Activity of the MondoA-Mlx Heterodimer. Molecular and Cellular Biology 30: 2887–2895. doi:10.1128/MCB.01613-09PMID:20385767