Appropriate Tealeaf Harvest Timing Determination
Referring Fiber Content in Tealeaf Derived from
Ground based Nir Camera Images
Kohei Arai 1
Graduate School of Science and Engineering Saga University
Saga City, Japan
Yoshihiko Sasaki
2,
2 Sasaki Green Tea Company, Kakegawa city – Japan
Shihomi Kasuya
2,
2 Sasaki Green Tea Company, Kakegawa city – Japan
Hideto Matusura
22 Sasaki Green Tea Company, Kakegawa city – Japan
Abstract—Method for most appropriate tealeaves harvest timing with the reference to the fiber content in tealeaves which can be estimated with ground based Near Infrared (NIR) camera images is proposed. In the proposed method, NIR camera images of tealeaves are used for estimation of nitrogen content and fiber content in tealeaves. The nitrogen content is highly correlated to Theanine (amid acid) content in tealeaves. Theanine rich tealeaves taste good. Meanwhile, the age of tealeaves depend on fiber content. When tealeaves are getting old, then fiber content is increased. Tealeaf shape volume also is increased with increasing of fiber content. Fiber rich tealeaves taste not so good, in general. There is negative correlation between fiber content and NIR reflectance of tealeaves. Therefore, tealeaves quality of nitrogen and fiber contents can be estimated with NIR camera images. Also, the shape volume of tealeaves is highly correlated to NIR reflectance of tealeaf surface. Therefore, not only tealeaf quality but also harvest amount can be estimated with NIR camera images. Experimental results show the proposed method works well for estimation of appropriate tealeaves harvest timing with fiber content in the tealeaves in concern estimated with NIR camera images.
Keywords—Tealeaves; Nitrigen content; Amino accid; Leaf volume; NIR images; Fiber content; Theanine; Amid acid; Regressive analysis
I. INTRODUCTION
There is a strong demand for monitoring of the vitality of crops in agricultural areas automatically with appropriate measuring instruments in order to manage agricultural area in an efficient manner. It is also required to monitor not only quality but also quantity of vegetation in the farmlands. Vegetation monitoring is attempted with red and photographic cameras [1]. Grow rate monitoring is also attempted with spectral observation [2].
Total nitrogen content corresponds to amid acid which is highly correlated to Theanine: 2-Amino-4-(ethylcarbamoyl) butyric acid for tealeaves so that total nitrogen is highly correlated to tea taste. Meanwhile, fiber content in tealeaves
has a negative correlation to tea taste. Near Infrared: NIR camera data shows a good correlation to total nitrogen and fiber contents in tealeaves so that tealeaves quality can be monitored with network NIR cameras. It is also possible to estimate total nitrogen and fiber contents in tealeaves with remote sensing satellite data, in particular, Visible and near infrared: VNIR radiometer data. Moreover, VC, NDVI, BRDF of tealeaves have a good correlation to grow index of tealeaves so that it is possible to monitor expected harvest amount and quality of tealeaves with network cameras together with remote sensing satellite data. BRDF monitoring is well known as a method for vegetation growth [3],[4]. On the other hand, degree of polarization of vegetation is attempted to use for vegetation monitoring [5], in particular, Leaf Area Index: LAI together with new tealeaves growth monitoring with BRDF measurements [6].
Theanine in new tealeaves are changing to Catechin [7],[8],[9] with sunlight. In accordance with increasing of sunlight, also, new tealeaves grow up so that there is a most appropriate time for harvest of tealeaves in order to maximize the amount and the taste of new tealeaves simultaneously.
Optical properties of tealeaves and methods for estimation of tealeaves quality and harvest amount estimation accuracy are well reported [10]-[17].
The method proposed here is to determine tealeaves harvest timing by using NIR camera images through the estimation of fiber content in tealeaves together with meteorological data. This paper, also, deals with automatic monitoring of a quality of tealeaves with earth observation satellite, network cameras together with a method that allows estimation of total nitrogen and fiber contents in tealeaves as an example.
II. PROPOSED METHOD
The proposed method for most appropriate tealeaves harvest timing is based on Near Infrared (NIR) camera images of tealeaves which are acquired in tea farm areas. The most appropriate tealeaves harvest timing is difficult to define. Tea farmers determine the timing empirically. It may be defined as maximizing Theanine in tealeaves and harvest amount as well as softness of tealeaves (less fiber content).
Theanine is highly correlated to the nitrogen content in tealeaves. Nitrogen content in tealeaves is proportional to NIR reflectance of tealeaf surfaces. Meanwhile, harvest amount is proportional to leaf area of tealeaves which depends on NIR reflectance of tealeaf surfaces. Also, tealeaf thickness, length and width can be measured results in shape volume of tealeaves measurements. It is also crossly related to the harvest amount. For time being, tealeaves are getting old and fiber content is also increased accordingly. Such old tealeaves taste not so good. New fresh tealeaves which have less fiber and have much Theanine taste good. Due to the fact that there is relations between NIR reflectance of tealeaves and Theanine (Nitrogen), fiber (age), Theanine and fiber content in tealeaves and harvest amount can be estimated with NIR camera imagery data.
NIR reflectance can be obtained from the acquired NIR camera images if a standard reflectance panel or plaque is acquired simultaneously with tealeaves in concern. Standard panel, for instance Spectralon, is not so cheap. In order to minimize a required cost for acquisition of NIR camera images, typical print sheets are used as standard panel. Therefore, cross comparison of reflectance between Spectralon and the print sheet is needed. Fig.1 shows acquired NIR image of Spectralon and the print sheet. Correction curve for conversion of NIR reflectance with the print sheet to Spectralon based NIR reflectance can be obtained from the acquired reflectance measured for Spectralon and the print sheet.
Fig. 1. Acquired NIR image of Spectralon and the print sheet
Fig.2 shows the ratio of the Spectralon based NIR reflectance and the print sheet based NIR reflectance.
Fig. 2. Ratio of the Spectralon based NIR reflectance and the print sheet based NIR reflectance
III. EXPERIMENTS
A. Intensive Study Test Sites
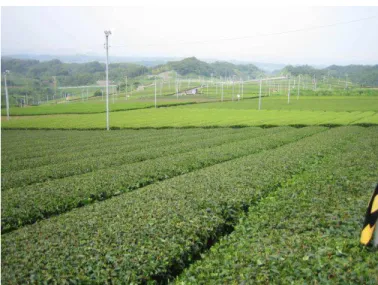
Experiments are conducted at the tea farm areas of Kakegawa in Shizuoka prefecture, Japan in April and May time frame (first harvesting time period a year). Outlook of one of the typical tea farm areas which is called “Pilot farm area” is shown in Fig.3. Longitude and latitude of the Pilot tea farm area is as follows,
34°44’30.7”N 138°01’27.6”E
Fig. 3. Outlook of one of the typical tea farm areas which is called “Pilot farm area”
Other than Pilot tea farm area, there are other test sites, “Front” and “Back” which are situated the following longitude and latitude, respectively.
34°45’44.3”N 138°03’11.3”E(Front) 34°44’40.0”N 138°03’11.9”E(Back)
Usually, tealeaves are harvested three times, (1) begging in May, (2) middle in July, (3) middle in October. Therefore, tealeaves are growing in April and then tealeaves are harvested in the begging of May in general for the first harvesting time period. Fig.4 shows examples of NIR camera image of photos which are acquired before and after the
0 0.2 0.4 0.6 0.8 1 1.2
400 600 800 1000
R
at
io
harvest. Fig.3 (a) and (b) shows an example of NIR camera image of tealeaves which is acquired just before harvest together with the print sheet and of tealeaves which is acquired just after harvest together with the same print sheet, respectively. In the experiments, the center wavelength of NIR camera is 800nm with band width of 100nm.
(a)Before harvest
(b)After harvest
Fig. 4. Examples of NIR camera images which are acquired just before (a) and after (b) harvest of tealeaves together with the print sheet as secondly standard panel
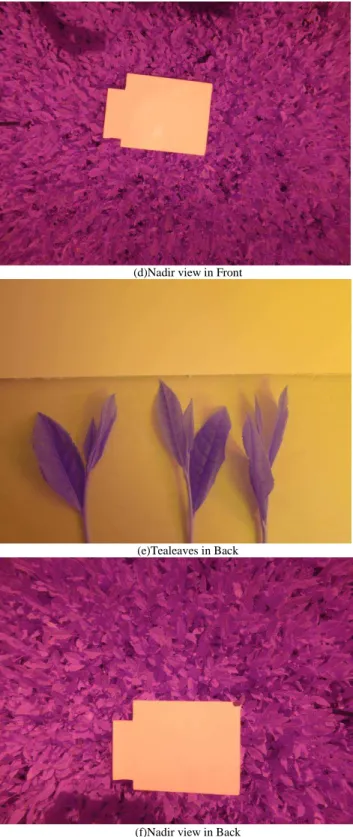
Fig.5 shows examples of tealeaves and nadir view of tea farm areas of the intensive test sites, “Pilot”, “Front” and “Back”.
(a)Tealeaves in Pilot
(b)Nadir view in Pilot
(d)Nadir view in Front
(e)Tealeaves in Back
(f)Nadir view in Back
Fig. 5. Example of the acquired NIR images for the three intensive test sites, Pilot, Front and Back of tea farm areas which are taken just before harvest, April 23, Mar 2 and May 3 in 2015, respectively
B. Relation between NIR Reflectance and TN and Fiber
Through the comparison of NIR reflectance measured in both time frames, it is found that Theanine which is proportional to the measured NIR reflectance is increased for the time being. Also, it is found that the Theanine is decreased for the short term periods (around one month). During the short term periods, tealeaf thickness (T), length (L), and width (W) are increased as shown in Fig.6 (a) and (b) shows the relation between NIR reflectance which is calculated with nadir view camera data and nitrogen and fiber contents in tealeaves. Although R square values are not so large, there are not so bad correlations between NIR reflection and nitrogen and fiber contents. There are positive and negative correlations between NIR reflectance and nitrogen as well as fiber contents, respectively. Trends of nitrogen and fiber contents in April 2015 are shown in Fig.7 (a) and (b), respectively. Fiber content is getting large while nitrogen content is getting small for the time being, obviously. These trends are different from each other tea farm areas.
(a)Nitrogen
(b)Fiber
Fig. 6. Relation between NIR reflect
ance which is calculated with nadir view camera data and nitrogen and fiber contents in tealeaves
y = 3.4725x + 3.6891 R² = 0.3217
5 5.1 5.2 5.3 5.4 5.5 5.6 5.7 5.8 5.9 6
0.4 0.45 0.5 0.55 0.6
T
o
ta
l
N
it
ro
g
en
(
%
)
NIR Reflectance
y = -17.879x + 26.691 R² = 0.3915
15 15.5 16 16.5 17 17.5 18 18.5 19 19.5
0.4 0.45 0.5 0.55 0.6
Fi
b
er
C
o
n
te
n
t
(%
)
(a)Nitrogen
(b)Fiber
Fig. 7. Trends of nitrogen and fiber contents in April 2015
C. Relation between TN and Fiber as well as Meteorological
Data
If the appropriate harvest timing is relating to the meteorological data, it is very convenient to determine the timing with the meteorological data. The harvest dates for the test sites of Pilot, Front and Back are April 23, May 2 and May3, respectively. These are determined by tea farmers in subjective manner. They used to determine the best harvest days through touching the typical top of tealeaves (softness of the tealeaves), and looking the shape of tealeaves, length, width, and thickness.
Fig.8 (a) shows the trends of the maximum air temperature on the ground a day (triangle), the sunshine duration time a day (cross) while Fig.8 (b) shows cumulative maximum air temperature (blue square) and cumulative sunshine duration time a day (brown square) since March 23 2015, respectively. Also, Fig.8 (c) shows the measured irradiance at the three test sites. Due to the fact that the harvest dates for the test sites of Pilot, Front and Back are April 23, May 2 and May3, respectively, these dates are coincident to the dates when the irradiance reaches to 10000 for each test site. These measured irradiances vary by day by day. 10000 arbitrary unit of measured irradiance is the maximum of the measurable irradiance range. In this case, the irradiance is measured when
the tealeaf shape is measured together with the NIR camera data is taken.
(a)Maximum air temperature a day and sunshine duration time a day
(b)Cumulative
(c)Measured irradiance
Fig. 8. Maximum air temperature a day and sunshine duration time a day and cumulative those since March 23 2015
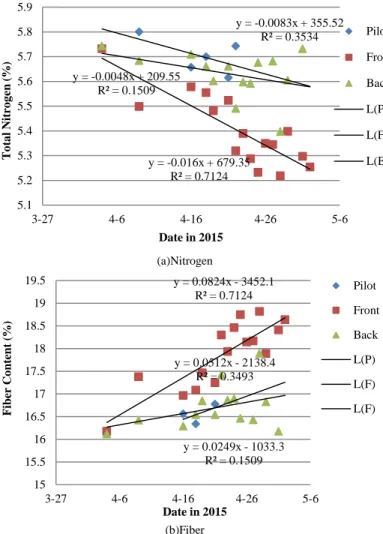
Fig.9 (a) and (b), meanwhile, shows nitrogen and fiber contents in tealeaves at the three test sites, Pilot, Front and Back as a function of cumulative maximum air temperature a day since March 23 2015, respectively. Also, Fig.9 (c) shows fiber content in tealeaves and the shape volume (width by length by thickness) at the test sites, Pilot, Front and Back. Due to the fact that the harvest day at the test site, Pilot is April 23 2015, there is only one data point of the measured shape volume while there are two data points for the test sites, Front and Back.
y = -0.0083x + 355.52 R² = 0.3534
y = -0.016x + 679.35 R² = 0.7124 y = -0.0048x + 209.55
R² = 0.1509
5.1 5.2 5.3 5.4 5.5 5.6 5.7 5.8 5.9
3-27 4-6 4-16 4-26 5-6
T o ta l N it ro g en ( % )
Date in 2015
Pilot Front Back L(P) L(F) L(B)
y = 0.0512x - 2138.4 R² = 0.3493 y = 0.0824x - 3452.1
R² = 0.7124
y = 0.0249x - 1033.3 R² = 0.1509
15 15.5 16 16.5 17 17.5 18 18.5 19 19.5
3-27 4-6 4-16 4-26 5-6
Fi b er C o n te n t (% )
Date in 2015
Pilot Front Back L(P) L(F) L(F) 0 5 10 15 20 25 30
0 10 20 30 40 50
M a x T em . (d eg re e C ) a n d S u n sh in e d u ra ti o n t im e (h )
Days after March 23 in 2015
0 100 200 300 400 500 600 700 800 900
0 10 20 30 40 50
C u m u la ti v e M a x T em . (d eg re e C ) a n d S u n sh in e d u ra ti o n t im e (h )
Days after March 23 in 2015
0 2000 4000 6000 8000 10000 12000
4-6 4-16 4-26 5-6
M e asur e d ir radi ance
Date in 2015
Pilot
Front
(a)Nitrogen
(b)Fiber
(c)Shape Volume
Fig. 9. Nitrogen and fiber contents in tealeaves at the test sites, Pilot, Front, Back tea farm areas
Although the harvest days for the different test sites, Pilot, Front, Back are different, the shape volumes at the harvest days are almost same (greater than 230 cm3). It is not easy to measure the shape volume. Tea farmers used to measure the shape of tealeaves not so frequently because it takes time. On the other hand, it is not so difficult to take a NIR camera image for tea farmers. Also, as is aforementioned, the shape
volume is proportional to fiber content and is negatively proportional to nitrogen content. Therefore, it seems reasonable to determine harvest day with nitrogen and fiber contents in tealeaves. The relations between leaf shape volume and nitrogen and fiber contents in tealeaves are shown in Fig.10. It is quite obvious that sensitivity of fiber content is greater than that of nitrogen content.
Fig. 10.relations between leaf shape volume and nitrogen and fiber contents in tealeaves
A relation between fiber content and cumulative maximum air temperature a day since March 23 2015 is estimated by using this relation of regressive equation. Fig.11 shows the relation between both.
Fig. 11.Relation between fiber content and cumulative maximum air temperature a day since March 23 2015
From this figure, it is found that the harvest day can be determined by using fiber content in tealeaves with the threshold at around 23 (%). If the fiber content is greater than 23 (%), such tealeaves are no longer new fresh tealeaves and are getting down in terms of tealeaf quality (it tastes getting bad).
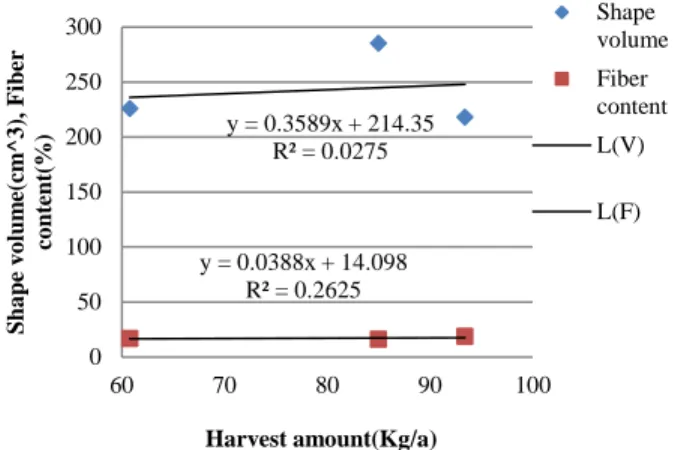
D. Estimation of Harvest Amount
Harvest amounts (Kg/a) of the test sites, Pilot, Front, and Back are 60.79, 93.4, 85.0, respectively. Harvest amount may be estimated with shape volume. Namely, it seems reasonable that large size of tealeaf shape means a great harvest amount. The other factor would be fiber content in tealeaves. Namely, in accordance with tealeaf age, fiber content is increased. This implies that harvest amount is increased with increasing of 5.1 5.2 5.3 5.4 5.5 5.6 5.7 5.8 5.9
0 200 400 600 800 1000
T o ta l N it ro g en ( % )
Cumulative Max. Temp. (degree C) since March 23 in 2015 Pilot Front Back 15.5 16 16.5 17 17.5 18 18.5 19
0 200 400 600 800 1000
Fi b er C o n te n t (% )
Cumulative Max. Temp. since March 23 in 2015 (degree C) Pilot Front Back 9 11 13 15 17 19 21 23 25 27 29
0 200 400 600 800 1000
Fi b er C o n te n t (% ) a n d sh a p e v o lu m e o f te a le a v es / 1 0 ( cm ^3 )
Cumulative Max. Temp. since March 23 in 2015 (degree C) Pilot Front Back Pilot(mass) Front Back
y = 0.0477x + 16.519 R² = 0.1449
y = -0.0093x + 5.6647 R² = 0.1449
5 7 9 11 13 15 17 19
9 14 19 24 29
T o ta l N it ro g en c o n te n t (% ), Fi b er co n te n t (% )
Leaf shape volume (cm^3)
Fiber TN Linear(F) Linear(TN) 15 17 19 21 23 25
0 200 400 600 800
Fi b er C o n te n t (% )
Cumulative Max. Temp. since March 23 in 2015(degree C)
Pilot
Front
fiber content. Fig.12 shows the relations between harvest amount and shape volume as well as fiber content in tealeaves.
Fig. 12.Relations between harvest amount and shape volume as well as fiber content in tealeaves
It is found that the relation between harvest amount and fiber content is greater than that shape volume.
IV. CONCLUSION
Method for most appropriate tealeaves harvest timing with the reference to the fiber content in tealeaves which can be estimated with ground based Near Infrared (NIR) camera images is proposed. In the proposed method, NIR camera images of tealeaves are used for estimation of nitrogen content and fiber content in tealeaves. The nitrogen content is highly correlated to Theanine (amid acid) content in tealeaves. Theanine rich tealeaves taste good. Meanwhile, the age of tealeaves depend on fiber content. When tealeaves are getting old, then fiber content is increased. Tealeaf shape volume also is increased with increasing of fiber content. Fiber rich tealeaves taste not so good, in general. There is negative correlation between fiber content and NIR reflectance of tealeaves. Therefore, tealeaves quality of nitrogen and fiber contents can be estimated with NIR camera images. Also, the shape volume of tealeaves is highly correlated to NIR reflectance of tealeaf surface. Therefore, not only tealeaf quality but also harvest amount can be estimated with NIR camera images.
Experimental results show the proposed method works well for estimation of appropriate tealeaves harvest timing with fiber content in the tealeaves in concern estimated with NIR camera images. It is found that the appropriate tealeaf harvest day can be determined by using fiber content in tealeaves which is estimated with NIR camera data. Also, it is found that harvest amount can be estimated with fiber content in tealeaves which is derived from NIR camera data.
Further study is required for a relation between micro meteorological condition and the best harvest timing. Pilot tea farm area is the best solar illumination condition among three test sites followed by Front and Back. The other conditions, fertilizer amount, water supply, insect damage management, etc. are almost same for each test sites. Therefore, weather condition; in particular, solar illumination condition must be key issues for determination of the best harvest timing.
REFERENCES
[1] J.T.Compton, Red and photographic infrared linear combinations for monitoring vegetation, Journal of Remote Sensing of Environment, 8, 127-150, 1979.
[2] C.Wiegand, M.Shibayama, and Y.Yamagata, Spectral observation for estimating the growth and yield of rice, Journal of Crop Science, 58, 4, 673-683, 1989.
[3] S.Tsuchida, I.Sato, and S.Okada, BRDF measurement system for spatially unstable land surface-The measurement using spectro-radiometer and digital camera- Journal of Remote Sensing, 19, 4, 49-59, 1999.
[4] K.Arai, Lecture Note on Remote Sensing, Morikita-shuppan Co., Ltd., 2000.
[5] K.Arai and Y.Nishimura, Degree of polarization model for leaves and discrimination between pea and rice types of leaves for estimation of leaf area index, Abstract, COSPAR 2008, A3.10010-08#991, 2008. [6] K.Arai and Long Lili, BRDF model for new tealeaves and new tealeaves
monitoring through BRDF monitoring with web cameras, Abstract, COSPAR 2008, A3.10008-08#992, 2008.
[7] Greivenkamp, John E., Field Guide to Geometrical Optics. SPIE Field Guides vol. FG01. SPIE. ISBN 0-8194-5294-7, 2004.
[8] Seto R H. Nakamura, F. Nanjo, Y. Hara, Bioscience, Biotechnology, and Biochemistry, Vol.61 issue9 1434-1439 1997.
[9] Sano M, Suzuki M ,Miyase T, Yoshino K, Maeda-Yamamoto, M.,J.Agric.Food Chem., 47 (5), 1906-1910 1999.
[10] Kohei Arai, Method for estimation of grow index of tealeaves based on Bi-Directional reflectance function: BRDF measurements with ground based network cameras, International Journal of Applied Science, 2, 2, 52-62, 2011.
[11] )Kohei Arai, Wireless sensor network for tea estate monitoring in complementally usage with Earth observation satellite imagery data based on Geographic Information System(GIS), International Journal of Ubiquitous Computing, 1, 2, 12-21, 2011.
[12] Kohei Arai, Method for estimation of total nitrogen and fiber contents in tealeaves with ground based network cameras, International Journal of Applied Science, 2, 2, 21-30, 2011.
[13] Kohei Arai, Monte Carlo ray tracing simulation for bi-directional reflectance distribution function and grow index of tealeaves estimation, International Journal of Research and Reviews on Computer Science, 2, 6, 1313-1318, 2011.
[14] K.Arai, Monte Carlo ray tracing simulation for bi-directional reflectance distribution function and grow index of tealeaves estimations, International Journal of Research and Review on Computer Science, 2, 6, 1313-1318, 2012.
[15] K.Arai, Fractal model based tea tree and tealeaves model for estimation of well opened tealeaf ratio which is useful to determine tealeaf harvesting timing, International Journal of Research and Review on Computer Science, 3, 3, 1628-1632, 2012.
[16] Kohei Arai, Method for tealeaves quality estimation through measurements of degree of polarization, leaf area index, photosynthesis available radiance and normalized difference vegetation index for characterization of tealeaves, International Journal of Advanced Research in Artificial Intelligence, 2, 11, 17-24, 2013.
[17] K.Arai, Optimum band and band combination for retrieving total nitrogen, water, and fiber in tealeaves through remote sensing based on regressive analysis, International Journal of Advanced Research in Artificial Intelligence, 3, 3, 20-24, 2014.
AUTHORS PROFILE
Kohei Aarai He received BS, MS and PhD degrees in 1972, 1974 and 1982, respectively. He was with The Institute for Industrial Science and Technology of the University of Tokyo from April 1974 to December 1978 and also was with National Space Development Agency of Japan from January, 1979 to March, 1990. During from 1985 to 1987, he was with Canada Centre for Remote Sensing as a Post Doctoral Fellow of National Science and Engineering Research Council of Canada. He moved to Saga University as a Professor in Department of Information Science on April 1990. He was a councilor for the Aeronautics and Space related to the Technology Committee of the Ministry of Science and Technology during from 1998 to y = 0.3589x + 214.35
R² = 0.0275
y = 0.0388x + 14.098 R² = 0.2625
0 50 100 150 200 250 300
60 70 80 90 100
S
h
a
p
e
v
o
lu
m
e(
cm
^3
),
Fi
b
er
co
n
te
n
t(
%
)
Harvest amount(Kg/a)
Shape volume
Fiber content
L(V)
2000. He was a councilor of Saga University for 2002 and 2003. He also was an executive councilor for the Remote Sensing Society of Japan for 2003 to 2005. He is an Adjunct Professor of University of Arizona, USA since 1998. He also is Vice Chairman of the Commission-A of ICSU/COSPAR since