Structure in Protein Interaction Networks
Xiao-Fei Zhang, Dao-Qing Dai*, Le Ou-Yang, Meng-Yun Wu
Center for Computer Vision and Department of Mathematics, Sun Yat-Sen University, Guangzhou, China
Abstract
Revealing functional units in protein-protein interaction (PPI) networks are important for understanding cellular functional organization. Current algorithms for identifying functional units mainly focus on cohesive protein complexes which have more internal interactions than external interactions. Most of these approaches do not handle overlaps among complexes since they usually allow a protein to belong to only one complex. Moreover, recent studies have shown that other non-cohesive structural functional units beyond complexes also exist in PPI networks. Thus previous algorithms that just focus on non-overlapping cohesive complexes are not able to present the biological reality fully. Here, we develop a new regularized sparse random graph model (RSRGM) to explore overlapping and various structural functional units in PPI networks. RSRGM is principally dominated by two model parameters. One is used to define the functional units as groups of proteins that have similar patterns of connections to others, which allows RSRGM to detect non-cohesive structural functional units. The other one is used to represent the degree of proteins belonging to the units, which supports a protein belonging to more than one revealed unit. We also propose a regularizer to control the smoothness between the estimators of these two parameters. Experimental results on four S. cerevisiae PPI networks show that the performance of RSRGM on detecting cohesive complexes and overlapping complexes is superior to that of previous competing algorithms. Moreover, RSRGM has the ability to discover biological significant functional units besides complexes.
Citation:Zhang X-F, Dai D-Q, Ou-Yang L, Wu M-Y (2012) Exploring Overlapping Functional Units with Various Structure in Protein Interaction Networks. PLoS ONE 7(8): e43092. doi:10.1371/journal.pone.0043092
Editor:Stefano Boccaletti, Technical University of Madrid, Italy
ReceivedJune 19, 2012;AcceptedJuly 16, 2012;PublishedAugust 20, 2012
Copyright:ß2012 Zhang et al. This is an open-access article distributed under the terms of the Creative Commons Attribution License, which permits unrestricted use, distribution, and reproduction in any medium, provided the original author and source are credited.
Funding:Funding provided by National Science Foundation of China (90920007, 11171354). The funders had no role in study design, data collection and analysis, decision to publish, or preparation of the manuscript.
Competing Interests:The authors have declared that no competing interests exist. * E-mail: [email protected]
Introduction
A key task of postgenomic systems biology is to cluster proteins and their interactions into functional units (groups) within a living cell, which further facilitates unveiling the complex machinery of cells functional organization [1]. The recent developments of high-throughput experimental techniques for delineating protein-protein interactions and modern data warehousing techniques for collecting available data make it possible to reveal functional units in protein-protein interaction (PPI) networks in genomic scale.
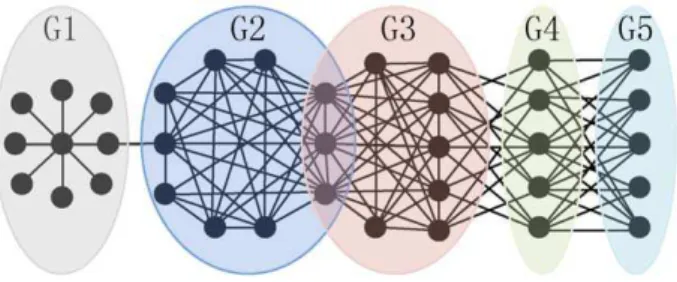
The typical approaches to detect functional units in PPI networks resort to identifying cohesive protein complexes or functional modules [2–4] (Here, we do not distinguish protein complexes from functional modules because the underlying PPI networks that we are using for functional units detection do not provide temporal and spatial information which is important for differentiating these two concepts). Based on the widely accepted definition of protein complex that a complex in the PPI network is a cohesively connected subnetwork which has more interactions within itself and fewer with the rest of the network (e.g., groups G2 and G3 in Figure 1), various computational algorithms have been successfully proposed to mine these cohesive complexes [5–8]. The proteins generally perform different biological functions by interacting with distinct partners [9,10], thus real protein complexes in the PPI network often overlap such that the proteins simultaneously belong to several functional groups (e.g., the
common three proteins shared by groups G2 and G3 in Figure 1). Clearly, the traditional protein complexes revealing algorithms that do not support overlapping complexes are not able to present the biological reality. Hence, much recent attention has been focused on detecting overlapping protein complexes [11–17].
The definition of protein complex corresponds to the concept of modular organization of PPI networks [18], which is a typical principle of biological networks [1,19]. However, Wang and Zhang [20] recently suggest that cohesive modules may originate as an evolutionary byproduct without much biological signifi-cance, thus may be not able to completely depict various functional units in PPI networks. Motivated by this result, two algorithms have been developed to mine other structural functional units besides cohesive functional modules [21,22]. Experimental results of their studies show that besides salient cohesive functional modules, other functional significant non-cohesive structures (e.g., groups G4 and G5 in Figure 1) also exist in the PPI networks. The modularity-based method of Pinkertet al.
[21] has limited application in revealing functional units not only for the reason of resolution limit [23] but also over-split phenomena [22]. Other biological meaningful units (e.g., spoke model [24] in Figure 1) may be neglected by Jiaoet al.s algorithm
Recently, the random graph models have been proposed to model PPI networks in terms of a random process to generate the networks [25,26]. Besides just generating synthetic data, several recent studies have explored the new applications of random graph models in biological network analysis [27–30]. The recent advances in application of random graph models in biological networks motivate us to explore their further application in mining functional units in PPI networks.
Outside of biology, Newman and Leicht [31] describe a mixture model to detect structure in networks by defining a structure as a group of nodes that all have similar patterns of connections to others. Ballet al.[32] recently introduce a random
graph model to detect overlapping cohesive communities in social networks based on the concept of link communities [19]. Motivated by these two prominent works in physics, we present a new regularized sparse random graph model (RSRGM) to explore functional units in PPI networks. By applying our model to four S. cerevisiae PPI networks, we show that RSRGM not only gives competitive results with the state-of-the-art algorithms on detecting cohesive complexes and overlapping complexes, but also is able to discover other non-cohesive structural functional units.
Methods
In this section, we outline the main idea of our algorithm. First we develop a sparse random graph model to describe the generation process of the PPI network, which is mainly determined by two model parameters: one for presenting the propensities of proteins belonging to groups, the other for defining the structure of functional units. We also introduce a regularizer to control the smoothness between estimators of these two parameters. Finally, we develop a new smooth regularized sparse random graph model and use it to explore functional units in PPI networks by estimating the two parameters.
A sparse random graph model for PPI networks
Given a PPI network, we attempt to define its generation process using a random graph model. We first model a PPI network with nproteins as a direct graph with adjacent matrix A~(Aij), whereAij indicates whether there is a (direct) link from proteinito proteinj. Instead of the undirected graph presented in the general approaches, we use the directed graph since it is
somewhat simpler in our model. We specify that proteinsiandj are connected if and only if there are a link from protein i to proteinj and a link from protein j to protein isimultaneously. Hence we setAij~1andAji~1if proteinsiandjare connected, andAij~0andAji~0otherwise. Even though we model the PPI network as directed graph, the adjacent matrixAis symmetric in essence.
Suppose the proteins of the PPI network fall intoKfunctional units. Similar to [32], we introduce hik as the propensity of proteinibelonging to groupk, a higher value ofhikindicates that proteiniis more likely in groupkand a lower value ofhikmeans that proteiniis less likely in groupk. Note that for a proteini, it may obtain high value ofhikon more than one group, thus our model essentially supports overlaps among functional units. Similar to [31], we also introduceykjto represent the propensity that there is a (directed) link from a particular protein in groupk to proteinj. In effectykjrepresents the preferences of proteins in group k about which other proteins they link to. By these preferences, in this study a functional unit is defined as a group of proteins that all have similar patterns of connections to others. Note that, unlike the definitions of cohesive protein complexes [2] and bi-sparse modules [22], besides this rather broad and flexible definition, we do not make strict assumption of the structure of functional units we explore. Thus, the functional units we reveal cover a wide variety of structures including the cohesive complexes as a special case of which the members similarly interact among themselves.
Let h~(hik) be the protein-group membership matrix and y~(ykj) be the group-protein preference matrix. By the definitions ofhikand ykj,hikykj is assumed to be the likelihood that there is a link from proteinito proteinjin terms of groupk and(hy)ij~
PK
k~1hikykjis the total likelihood in terms of all the
K groups. Similar to [30] and [32], we assume the random number of links from proteinito proteinjis independently from Poisson distribution with mean(hy)ij. Note that this means that the network generated by our model is a technically multi-graph with self-links, which is unrealistic for PPI networks. But it greatly simplifies the mathematical developments and is also allowed by Ranolaet al.[30] and Ballet al.[32]
In practice, it is well known that a protein in any particular PPI network usually belongs only to one or several functional units, seldom belongs to all considered units, and proteins in a considered unit usually connect only to a part of proteins in the whole PPI network but seldom connect to all proteins. Thus, we place independent exponential distribution priors over each element of h and y with rate parameter l, which indirectly imposes sparse restriction on the protein-group membership matrix and the group-protein preference matrix. The sparse restriction will lead all elements in some columns ofhand rows of yto be0simultaneously, and hence the corresponding irrelevant groups disappear automatically. Therefore, it not only has good biological interpretation but also presents a method to determine the value of parameterK, the number of functional units in the considered PPI network.
The quantities in our random graph model can be classified into three classes: observed adjacent matrix A of the PPI network, model parametershandy, and hyperparameterl. Given the rate parameter l, our model generates a PPI network with a given numbernof proteins and a given numberKof functional units as follows:
NFor each proteiniand groupk, draw protein-group membership
hik*Exp (l)with the probability:
Figure 1. An example PPI network that includes overlapping and different structural functional groups.Group G1 is a spoke model in which all spoke proteins interact with the hub protein. Groups G2 and G3 are two cohesive groups that have more interactions within themselves and fewer with the rest of the network. And there are three proteins shared by these two groups. Group G4 is a non-cohesive group of which the members similarly interact with proteins in groups G3 and G5, but not among themselves. Group G5 is another non-cohesive group in which the proteins only have interaction with proteins in group G4, but not among each other.
P(hikjl)~lexpð{lhikÞ, hik§0: ð1Þ
NFor each groupkand proteinj, draw group-protein preference
ykj*Exp (l)with the probability:
Pykjjl~lexp{lykj, ykj§0: ð2Þ
N For each pair of proteins i and j, sample the value of their
interactionAij*Pois (hy)ij
with the probability:
P(Aijjh,y)~ hy ð Þij Aij
Aij!
exp{ðhyÞij: ð3Þ
Under the introduced random graph model, the joint proba-bility of a graph with adjacent matrixAand the model parameters fh,ygcan be written as follows:
P(A,h,yjl)~P(Ajh,y)P(hjl)P(yjl)
~ P n
i,j~1P(Aijjh,y) P n
i~1 P K
k~1P(hikjl) P K
k~1P n
j~1P ykjjl
: ð4Þ
For an observed PPI network, we estimate the values ofhandyby maximum the joint probability of Equation (4). By taking Equations (3), (1) and (2) into Equation (4), taking the negative logarithm and dropping constants, we obtain the objective function of the sparse random graph model (SRGM):
minh,y {Pni,j~1Aijlog ðhyÞij
zPni,j~1ðhyÞij
zlPn
i~1 PK
k~1hikzlPKk~1 Pn
j~1ykj
s:t: h§0,y§0:
8 > > > < > > > : ð5Þ
Hereh§0andy§0means each elementhik§0andykj§0.
A smooth regularizer
If there is a link from proteinito proteinj, that isAij~1, we can use hikAij~hik as an estimator of ykj without considering other information besides hik and Aij. This is because we have definedhikas the propensity of proteinibelonging to groupkand ykjas the propensity of having a link from a protein in groupkto protein j. Hence, if protein i obtains a high value of hik and
Aij~1, proteinj will obtain a high value ofykj, and vice versa. Similarly, we can useAijykj~ykj as an estimator ofhik without considering other information besidesykj andAij. Thus, ideally, for two connected proteins i and j, they tend to obtain similar values ofhikandykj.
We introduce the following regularizer to quantify the smoothness between the estimators ofhandyon the PPI network:
R(h,y)~1 2
Xn
i,j~1 Aij
XK
k~1
hik{ykj
2
~1 2 Tr h
TDh
zTr(yDyT){2Tr(yAh) ð6Þ
whereTrð Þ: denotes the trace of a matrix, andD is a diagonal matrix withDii~Pnj~1Aij. We aim to minimizeRwith respect to handyso that if proteinsiandjare connected,hikandykjwill be close to each other fork~1,2,. . .,K.
Regularized sparse random graph model
Objective function of regularized sparse random graph model. By combining the introduced smooth regularizer (6) with the objective function of sparse random graph model (5), we present a new model, named as regularized sparse random graph model (RSRGM), as follows:
minh,y {Pni,j~1Aijlog ðhyÞij
zPni,j~1ðhyÞij
zlPn
i~1 PK
k~1hikzlPKk~1 Pn
i~1ykj
zb 2 Tr h
TDh
zTr yDyT
{2TrðyAhÞ
s:t: h§0,y§0:
8 > > > > > > > < > > > > > > > : ð7Þ
Here b is a balance parameter between objective function of SRGM (5) and smooth regularizer (6).
Solution to regularized sparse random graph model. To optimizehandy, we follow the multiplicative updating rule [33] which is widely used to solve non-negative constrained optimiza-tion problem and involves consecutive updates ofhandyuntil a stopping criterion has been satisfied.
By the multiplicative updating rule, we obtain the following two updating formulas forhandy, respectively:
hik/hik
Pn
j~1Aij ykj hy
ð Þijzb Ay T
ik
Pn
j~1ykjzlzbðDhÞik
ð8Þ
and
ykj/ykj Pn
i~1Aij hik hy ð Þijzb h
TA
kj
Pn
i~1hikzlzb yð DÞkj
: ð9Þ
The updating formulas (8) and (9) are able to guarantee the nonnegativity of estimators of parameters. That is, if we initializeh andywith nonnegative values, the elements ofhandyare always nonnegative during iteration. For the detailed inference of the two updating rules, please refer to Text S1.
h?ik~ 1 ifhik
§t
0 ifhikvt:
ð10Þ
Hereh?~(h?ik)is the protein-group indication matrix of which h?ik~1represents proteini is in discovered groupk and h?ik~0 represents proteiniis not in discovered groupk. Sincehis sparse, all elements of many columns of hare 0, and hence the groups corresponding to these columns disappear. Here, similar to [16], we also filter out the detected groups of which the number of members is less than three, that is we delete the columns ofh?that contain at most two elements of1.
Final algorithm. We summarize the detailed algorithm for discovering various structural functional units in the PPI networks via regularized sparse random graph model (RSRGM) in Figure 2. In this study, we limit a maximum of 150 iterations when updating h and y using Equations (8) and (9) for practical application purpose, although it frequently converges before this point is reached. Since the objective function of (7) is nonconvex, which will lead to a local minimum by the multiplicative updating rule. To guard against the possibility of getting stuck in a local minimum, we repeat the entire calculation 50 times with random initial conditions and choose the result that gives the lowest value of objective function of (7).
Results
In this section, we first compare RSRGM to the previous competitive algorithms for detecting cohesive protein complexes and overlapping complexes. We then test the effect of RSRGM on unveiling other non-cohesive structural functional units. As we know, no common precise definition of cohesive complexes has been agreed upon. For simplicity, we differentiate the cohesive protein complexes and non-cohesive functional units based on density (where the density of a functional unit with nproteins is defined as the total number of its internal interactions, divided by n(n{1)=2). The identified functional units with density above 0.1 are viewed as cohesive complexes, and functional units with density below 0.1 are viewed as non-cohesive functional units in this study.
Datasets
PPI networks. We concentrate our analysis on two experi-mental yeast PPI networks [34,35], a combined computational interaction map [36] and the entire set of physical interactions in yeast from BioGRID [37]. Here we refer to these as Gavin, Krogan, Collins and BioGRID networks. The Gavin, Krogan and Collins networks are extracted from BioGRID database with Pubmed ID 16429126, 16554755 and 17200106, respectively. The BioGRID network is downloaded from version 3.1.88 and contains all physical interactions that involve yeast proteins only. Self-interactions, redundant interactions and interactions involving proteins of which systematic names are not available are filtered out from all the four networks. In this study, for simplicity, we just analyze the largest connected component of each network. Table 1 presents the number of proteins, the number of interactions, the average clustering coefficient, the average number of neighbors and the density of each PPI network.
Gold standard protein complexes. In order to evaluate the performance of our model on detecting cohesive protein complexes, we derive two gold standard complexes from MIPS [38] and SGD [39] databases, respectively (Table S1). We utilize the 220 filtered yeast protein complexes from MIPS which is the
same set used by Brohe´e and Van Helden [40]. Since complexes in MIPS database are incomplete, we also use an additional independent reference set for validation. This set is generated
Figure 2. Summary of RSRGM for discovering protein func-tional units.
doi:10.1371/journal.pone.0043092.g002
Table 1.Topological characteristics of used PPI networks.
Network #proteins #interactions cc avNeighbors density
Gavin 1359 6451 0.4196 9.49 0.0070
Krogan 2559 7031 0.1947 5.50 0.0021
Collins 1004 8319 0.6478 16.57 0.0165
BioGRID 5850 68312 0.2622 23.35 0.0040
Here cc denotes the average clustering coefficient of network, avNeighbors denotes the average number of neighbors of each protein.
from complexes in the SGD database as the procedure described by Nepusz et al.[16]. The SGD annotations and the cellular
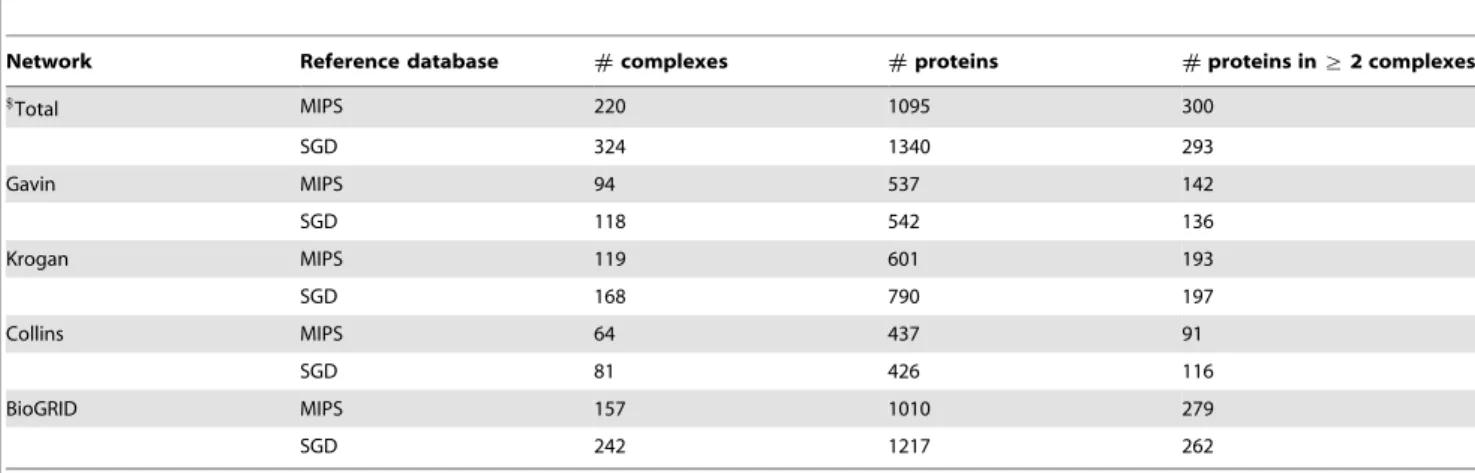
component ontology used to generate the SGD reference complexes are downloaded from Gene Ontology database [41] on 24 April 2012. To avoid selection bias, for both two reference sets we only consider complexes containing at least3and at most 100proteins with respect to each PPI network. Table 2 lists the number of complexes, the number of proteins covered by these complexes and the number of proteins shared by more than one complex for the four PPI networks considered in this study.
GO classification and annotations. We use Gene Ontol-ogy [41], a widely adopted gold standard system, as the data sources of functional classification and annotations to test functional homogeneity of non-cohesive functional units revealed by our approach. The Gene Ontology file including three ontologies (biological process, cellular component, and molecular function) and the GO annotations of S.cerevisiae are obtained from the Gene Ontology database on 24 April 2012.
Evaluation measures
Metrics for evaluating protein complexes detection. We use three independent quantity measures to assess the similarity between a set of predicted protein complexes and a set of reference complexes (Text S2). The first one is accuracy (Acc) which is defined as the geometric average of sensitivity (Sn) and positive predictive value (PPV) [40]. Here note that we use the new definition of PPV introduced by Xie et al. [42] which is more
suitable for evaluating overlapping clusters. The other two measures we use are the Jaccard and PR metrics introduced by Song and Singh [43].
Metrics for evaluating overlapping complexes detection. We use precision, recall and F-score to quantitatively evaluate the performance of different algorithms on detecting proteins shared by multiple protein complexes. LetGbe the set of proteins shared by more than one complex in the gold standard database and C be set of proteins presented in more than one predicted complex. Then precision, recall and F-score are defined as follows:
precision~jG\Cj C
j j , recall~ G\C
j j
G
j j ,
F{score~2|precision|recall precisionzrecall :
Metrics for evaluating non-cohesive functional units detection. We evaluate the unveiled non-cohesive functional units based on functional homogeneity in terms of GO annota-tions. The statistical significance of the occurrence of a non-cohesive functional unit with respect to a given functional annotation is computed by the following hypergeometric distribu-tion:
P{value~1{X k{1
i~0 F j j i
jVj{jFj
jCj{i
jVj jCj
ð11Þ
where a revealed functional unitCcontainskproteins annotated with GO functionF which associates withjFjproteins, and the whole organism contains jVj proteins. Here, we perform GO enrichment analysis by computing the P-value using GO Term Finder [44].
Detecting cohesive protein complexes
Effect of parameters. There are four parameters K, t, l andbin our algorithm.K is the supposed maximum number of possible functional units in the PPI network, and we setK~500 for Gavin, Krogan and Collins networks, and K~1000 for BioGRID network. The parameter t is the threshold used to obtain the resultant functional groups from protein-group membership matrix, and we experimentally find that a value of t~0:3usually gives the reasonable results on the four networks. The parametersland bare two key parameters of our method, and we focus on studying the effect of these two parameters on detecting protein complexes. Particularly, we run RSRGM on the four yeast PPI networks with different combination values of l (l[f2{5,2{4,. . .,25g) and b b[2{5,2{4,:::25
, and evaluate the complexes identified by RSGNM using reference complexes in MIPS and SGD databases in terms of the three measures introduced above (Acc, Jaccard and PR).
Table 2.Statistics of gold standard protein complexes.
Network Reference database #complexes #proteins #proteins in§2 complexes
$Total MIPS 220 1095 300
SGD 324 1340 293
Gavin MIPS 94 537 142
SGD 118 542 136
Krogan MIPS 119 601 193
SGD 168 790 197
Collins MIPS 64 437 91
SGD 81 426 116
BioGRID MIPS 157 1010 279
SGD 242 1217 262
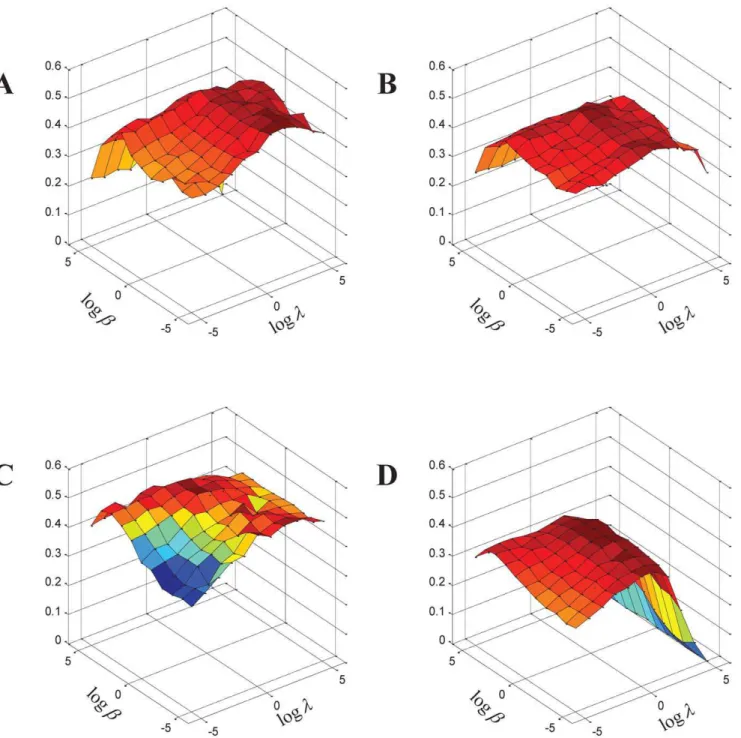
Figure 3 shows the harmonic mean of six scores (three different measure scores (Acc, Jaccard and PR) of the two different gold standard databases (MIPS and SGD)) with respect to various values oflandbon the four PPI networks. In general, for a fixed value of b, the harmonic mean scores increase initially and decreases after obtaining maximum with the increasing of the value ofl. Similarly, for a fixed value ofl, the harmonic mean scores increase initially and decreases after obtaining maximum when the value ofbincreases. This result shows the effectiveness of these two parameters since both of them contribute to improving the performance of RSRGM.
From this figure, we also find maximal value of harmonic mean of the six scores are obtained when l~1 and b~2 for Gavin network,l~2andb~1for Krogan network,l~2andb~1for Collins network, andl~1andb~1for BioGRID network. In the following study, unless otherwise stated, the resulting functional units (both cohesive complexes and non-cohesive functional units) identified by RSRGM are obtained with these optimal values of parameters for the four PPI networks.
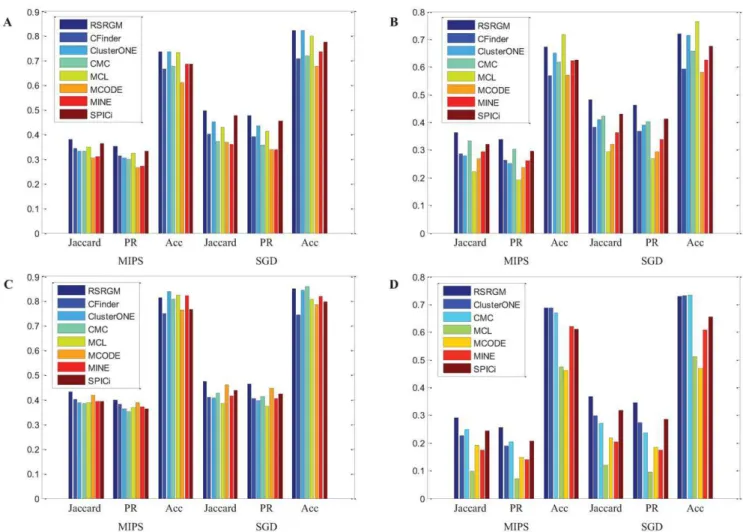
Comparative evaluation on detecting complexes. To test the effectiveness of RSRGM on detecting protein complexes, we compare it to CFinder [11], ClusterOne [16], CMC [13], MCL [5], MCODE [6], MINE [14] and SPICi [8]. The simple description and detailed parameter settings of each algorithm are listed in Text S3. Note that for all considered methods, as RSGNM, we discard complex candidates with size less than three. Figure 4 graphically shows the comparative performance of considered algorithms with the three evaluation measures (Acc, Jaccard and PR) using both MIPS and SGD reference complexes on the four PPI networks. Note that since CFinder can not successfully analyze BioGRID network in 48 hours, we do not present corresponding results in this figure. We observe that the relative performance of these algorithms change depending on the networks under consideration, and none of them clearly dominates the other approaches in terms of all the three measures and both two gold standards. However, RSRGM performs better than other approaches on all the four networks in terms of Jaccard and PR measures. In most cases, RSRGM works as the best two methods with Acc metric. These results show that even though RSRGM is not just devised to detect cohesive protein complexes, it has competitive performance with the state-of-the-art algorithms at this task.
Comparative evaluation on detecting overlapping complexes. Various algorithms based on different principles have been developed to discover overlapping protein complexes. Thus besides comparing theses algorithms using the overlapping gold standard complexes as analyzed above, it is also interesting to directly compare RSRGM to these algorithms on revealing proteins shared by multiple complexes. Here, we focus on the competitive algorithms that are also able to handle overlaps: CFinder [11], ClusterONE [16], CMC [13] and MINE [14]. Note MCODE considered in this study is also able to produce overlapping complexes by executing the fluffing phase, but experimental results show that it performs more better on detecting complexes when fluffing is turned off. Thus we do not take it into account.
In this experiment, we also use MIPS and SGD databases as gold standard reference complexes, and proteins shared by more than one complex in each database is the reference of multi-complex proteins. We present the F-scores in terms of the MIPS and SGD reference complexes in Figure 5; larger scores are better, and the sum of the two scores corresponding to the two difference databases is a composite score. Note that we do not present the corresponding results of CFinder on BioGRID network since it
can not analyze this network in 48 hours. Experimental results on the four PPI networks show that the five approaches have complimentary strength in revealing multi-complex proteins when analyzing networks with different topological characteristics. ClusterONE outperforms the other four algorithms on Krogan network and CMC works as the best one on BioGRID network. We also observe that RSRGM performs better than the other four algorithms on Gavin and Collins networks and obtain the second highest composite scores on the other two networks. Experimental results show that compared to the previous competing algorithms, RSRGM is less sensitive to the change of topological character-istics of the network under consideration and is competitively accurate for revealing proteins shared by more than one complex. For detailed results of precision and recall, see Table S2.
Detecting other non-cohesive structural functional units Besides discovery of cohesive protein complexes, RSRGM is also developed to reveal other non-cohesive functional units of which the members seldom interact with each other but have the similar interactions with the rest of network. In this section, we study whether the non-cohesive functional units widely exist in PPI networks and represent biology. We evaluate the biological significance of the non-cohesive functional units identified by RSRGM in terms of the P-value of hypergeometric distribution calculated with GO Term Finder [44].
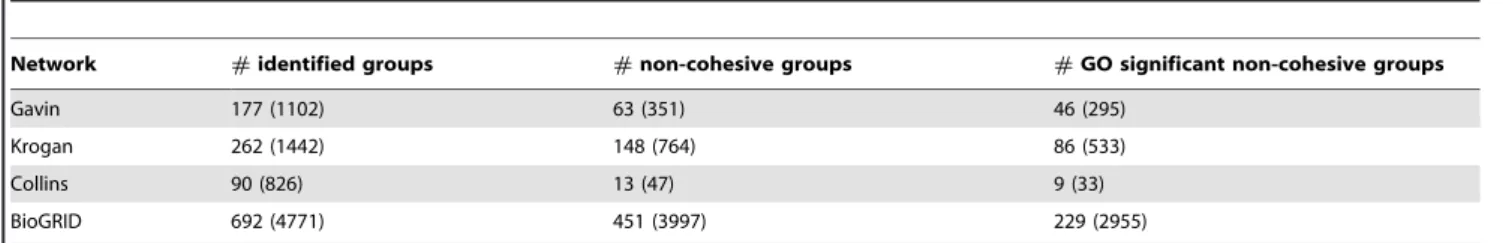
Table 3 presents the total number of identified functional units and the corresponding proteins, the number of non-cohesive units and the proteins they cover, and the number of GO significant non-cohesive units (of which the P-value is lower than0:05for at least one of the three ontologies: biological process, cellular component, and molecular function) and the proteins they involve. We can see that the proportion of non-cohesive functional units changes according to the topological characteristics of the network we consider. For Collins network which has high values of average cluster coefficient, average number of neighbors and network density, we find that among the total90identified units, there are only13non-cohesive units. On the contrary, for Krogan network which has low values of average cluster coefficient, average number of neighbors and network density, there are 148 non-cohesive functional units among the total 262 functional units identified by RSRGM. Furthermore, for each PPI network we find most of these revealed non-cohesive functional units are signifi-cantly enriched by GO functions. The detailed statistic informa-tion of these biological significant non-cohesive units identified by RSRGM for the four PPI networks are presented in Table S3.
proteins in the same group but also interact with proteins in group 42. Thus proteins in these two groups have a little different interaction patterns. Anyhow, a method just focusing on cohesive protein complexes would not reveal the biological significant non-cohesive units 142 and 42.
Figure 7 illustrates a spoke functional unit detected by RSRGM in BioGRID network. These spoke proteins in functional group 431 are connected by the two hub proteins YDR341C and YLL018C. Group 431 is significantly enriched in biological process of translational elongation (p{value~4:73|10{43), cellular component of cytosol (p{value~6:16|10{30) and
molecular function of base pairing with mRNA (p{value~4:11|10{48). The two hub proteins are annotated with biological processes of aspartyl-tRNA aminoacylation and cytoplasmic translation, cellular component of cytoplasm and molecular function of aspartate-tRNA ligase activity. Thus, it may be that these spoke proteins in group 431, the two hub proteins and some other relative proteins cooperate with each other to finish the process of translation. However, this functional significant spoke model may be overlooked by algorithms which are mainly proposed to detect cohesive protein complexes. More examples of non-cohesive functional
Figure 3. Performance of RSRGM on detecting complexes with respect to different values oflandb.The x-axis denotes the value of
logl, the y-axis denotes the value oflogb, and the z-axis denotes the harmonic mean of the three measures scores of both MIPS and SGD reference complexes. (A) Gavin network. (B) Krogan network. (C) Collins network. (D) BioGRID network.
Figure 4. Benchmark results of various protein complexes detection algorithms on the four PPI networks.(A) Gavin network. (B) Krogan network. (C) Collins network. (D) BioGRID network.
doi:10.1371/journal.pone.0043092.g004
Figure 5. Comparative results of different algorithms on revealing proteins shared by multiple complexes.The total height of each bar is the composite value of F-scores on both MIPS and SGD databases for each algorithm.
units detected by RSRGM for the four PPI networks are presented in Text S4.
Discussion
Discovering functional units in PPI networks allows for predicting protein function and further unveiling the complex inner working mechanism of cell. Previous algorithms identifying functional units mostly focus on cohesive protein complexes which
have more internal interactions than external interactions. However, recent studies have shown that besides cohesive complexes, other structural functional units also exist in PPI networks. Furthermore, traditional algorithms detecting complex-es which do not handle overlaps are not always able to prcomplex-esent the biological reality. Thus, in this study, we not only concentrate on detecting cohesive complexes, but also pay attention to reveal overlapping and other non-cohesive structural functional units. Table 3.Statistics of functional units identified by RSRGM and the corresponding proteins they cover.
Network #identified groups #non-cohesive groups #GO significant non-cohesive groups
Gavin 177 (1102) 63 (351) 46 (295)
Krogan 262 (1442) 148 (764) 86 (533)
Collins 90 (826) 13 (47) 9 (33)
BioGRID 692 (4771) 451 (3997) 229 (2955)
The numbers in the parentheses are the numbers of proteins covered by identified functional groups. doi:10.1371/journal.pone.0043092.t003
Figure 6. Interactions among detected functional groups 38, 42, 85, 142 and 146 in Gavin network.Proteins are labeled according to groups to which they belong: group 38 (diamond), group 42 (hexagon), group 85 (triangle), group 142 (circle), group 146 (octagon). Protein YBR247C shared by groups 38 and 85 is labeled with rectangle. This figure is plotted with software Cytoscape [45].
A new sparse random graph model is proposed to reveal overlapping and various structural functional units, which is mainly parameterized by two model parameters. Different from conventional definition of cohesive protein complexes, we use one parameter to define functional units as groups of proteins which have the similar connections to others. Thus functional units with various topological structure can be revealed. Different from traditional hard clustering, we use the other parameter to present the degree of proteins belonging to groups. Thus our model allows a protein to be shared by more than one identified functional unit. The sparse priors given to these two parameters not only have good biological interpretation but also help to determinate the value of possible number of functional units in PPI networks. Experimental results on four yeast PPI networks show that our model performs well not only on detecting cohesive protein complexes and overlapping complexes, but also on revealing other non-cohesive functional units.
In fact, two other algorithms [21,22] have been developed to mine the non-cohesive functional units in PPI networks. We do not compare RSRGM to Pinkert method [21] not only for it mainly focuses on functional units on large scale (here we focus on small scale at protein complex level) but also for there is no public software
available. And we also do not present the comparative results of BTS [22] because it can not analyze the four PPI networks except Collins in 48 hours. Hence, we mainly compare our model to algorithms developed to identify protein complexes and perform functional homogeneity analysis of non-cohesive functional units revealed by RSRGM. Anyhow, our analysis shows that PPI networks are more than sparsely interacting protein complexes. Rather, functional units beyond cohesive complexes also widely exist.
Even though random graph models have been used to capture the properties and evolution mechanism of PPI network, and several recent studies have explored their new applications in analyzing PPI networks, the technique presented in this study is one of the first to use random graph models for the purpose of mining functional units. Different from traditional approaches detecting cohesive protein complexes based on dense subnetwork detection or graph partition, our approach gives new insights about the workability of random graph models in exploring functional structure of PPI networks.
Our method can be extended in the following aspects. First, we use Poisson distribution to generate connections among proteins for its simplicity. Other distributions (e.g., Bernoulli distribution and binomial distribution) can also be tried to find which one is
Figure 7. Interactions among detected functional group 431 and proteins YDR341C and YLL018C in BioGRID network.Proteins in group 431 (circle) which consists of spoke proteins are connected by two hub proteins (diamond) YDR341C and YLL018C. This figure is plotted with software Cytoscape [45].
more appropriate for the task at hand. Second, in this study, we determinate values of the two key parameterslandbby the trick of grid searching, which is more time-consuming. Although we experimentally find that the values of l and b that belong to l[½1,2andb[½1,2usually lead to reasonable results, it also needs to take an effective and efficient measure to determine the values of these two parameters. Third, our random graph model is mainly devised for PPI networks. It is interesting to extend and apply it to explore structure in other biological networks such as gene regulatory and cell signaling networks.
Supporting Information Table S1 (XLS) Table S2 (XLS) Table S3 (XLS)
Text S1 Solution to regularized sparse random graph model.
(PDF)
Text S2 Metrics for evaluating protein complexes detection.
(PDF)
Text S3 Parameter settings of compared algorithms.
(PDF)
Text S4 Examples of non-cohesive functional units detected by RSRGM.
(PDF)
Author Contributions
Conceived and designed the experiments: XFZ DDQ LOY MYW. Performed the experiments: XFZ DQD. Analyzed the data: XFZ DQQ LOY. . Wrote the paper: XFZ DQD LOY MYW.
References
1. Baraba´si AL, Oltvai ZN (2004) Network biology: understanding the cell’s functional organization. Nat Rev Genet 5: 101–113.
2. Spirin V, Mirny L (2003) Protein complexes and functional modules in molecular networks. Proc Natl Acad Sci USA 100: 12123–12128.
3. Sharan R, Ulitsky I, Shamir R (2007) Network-based prediction of protein function. Mol Syst Biol 3: 88.
4. Li X, Wu M, Kwoh CK, Ng SK (2010) Computational approaches for detecting protein complexes from protein interaction networks: a survey. BMC Genomics 11: S3.
5. Enright AJ, Dongen SV, Ouzounis CA (2002) An efficient algorithm for large-scale detection of protein families. Nucleic Acids Res 30: 1575–1584. 6. Bader GD, Hogue CW (2003) An automated method for finding molecular
complexes in large protein interaction networks. BMC Bioinformatics 4: 2. 7. King A, Przˇulj N, Jurisica I (2004) Protein complex prediction via cost-based
clustering. Bioinformatics 20: 3013–3020.
8. Jiang P, Singh M (2010) Spici: a fast clustering algorithm for large biological networks. Bioinformatics 26: 1105 – 1111.
9. Gillis J, Pavlidis P (2011) The impact of multifunctional genes on ‘‘guilt by association’’ analysis. PloS One 6: e17258.
10. Zhang XF, Dai DQ (2012) A framework for incorporating functional inter-relationships into protein function prediction algorithms. IEEE/ACM Trans Comput Biol Bioinform 9: 740–753.
11. Adamcsek B, Palla G, Farkas I, Dere´nyi I, Vicsek T (2006) Cfinder: locating cliques and overlapping modules in biological networks. Bioinformatics 22: 1021–1023.
12. Cho Y, Hwang W, Ramanathan M, Zhang A (2007) Semantic integration to identify overlapping functional modules in protein interaction networks. BMC Bioinformatics 8: 265.
13. Liu G, Wong L, Chua H (2009) Complex discovery from weighted ppi networks. Bioinformatics 25: 1891–1897.
14. Rhrissorrakrai K, Gunsalus KC (2011) Mine: module identification in networks. BMC Bioinformatics 12: 192.
15. Becker E, Robisson B, Chapple C, Gue´noche A, Brun C (2012) Multifunctional proteins revealed by overlapping clustering in protein interaction network. Bioinformatics 28: 84–90.
16. Nepusz T, Yu H, Paccanaro A (2012) Detecting overlapping protein complexes in protein-protein interaction networks. Nat Methods 9: 471–472.
17. Zhang XF, Dai DQ, Li XX (2012) Protein complexes discovery based on protein-protein interaction data via a regularized sparse generative network model. IEEE/ACM Trans Comput Biol Bioinform 9: 857–870.
18. Luo F, Yang Y, Chen CF, Chang R, Zhou J, et al. (2007) Modular organization of protein interaction networks. Bioinformatics 23: 207–214.
19. Ahn Y, Bagrow J, Lehmann S (2010) Link communities reveal multiscale complexity in networks. Nature 466: 761–764.
20. Wang Z, Zhang J (2007) In search of the biological significance of modular structures in protein networks. PLoS Comput Biol 3: e107.
21. Pinkert S, Schultz J, Reichardt J (2010) Protein interaction networks—more than mere modules. PLoS Comput Biol 6: e1000659.
22. Jiao Q, Zhang Y, Li L, Shen H (2011) Bintree seeking: a novel approach to mine both bi-sparse and cohesive modules in protein interaction networks. PLoS One 6: e27646.
23. Fortunato S, Barthelemy M (2007) Resolution limit in community detection. Proc Natl Acad Sci USA 104: 36–41.
24. Qi Y, Balem F, Faloutsos C, Klein-Seetharaman J, Bar-Joseph Z (2008) Protein complex identification by supervised graph local clustering. Bioinformatics 24: i250–i258.
25. Higham D, Rasˇajski M, Przˇulj N (2008) Fitting a geometric graph to a protein– protein interaction network. Bioinformatics 24: 1093–1099.
26. Schweiger R, Linial M, Linial N (2011) Generative probabilistic models for protein–protein interaction networks—the biclique perspective. Bioinformatics 27: i142–i148.
27. Saul Z, Filkov V (2007) Exploring biological network structure using exponential random graph models. Bioinformatics 23: 2604–3611.
28. Clauset A, Moore C, Newman M (2008) Hierarchical structure and the prediction of missing links in networks. Nature 453: 98–101.
29. Kuchaiev O, Rasˇajski M, Higham D, Przˇulj N (2009) Geometric de-noising of protein-protein interaction networks. PLoS Comput Biol 5: e1000454. 30. Ranola J, Ahn S, Sehl M, Smith D, Lange K (2010) A poisson model for random
multigraphs. Bioinformatics 26: 2004–2011.
31. Newman M, Leicht E (2007) Mixture models and exploratory analysis in networks. Proc Natl Acad Sci USA 104: 9564–9569.
32. Ball B, Karrer B, Newman M (2011) Efficient and principled method for detecting communities in networks. Phys Rev E 84: e036103.
33. Lee DD, Seung HS (2001) Algorithms for non-negative matrix factorization. In: Adv Neural Inf Process Syst. volume 13, 556–562.
34. Gavin A, Aloy P, Grandi P, Krause R, Boesche M, et al. (2006) Proteome survey reveals modularity of the yeast cell machinery. Nature 440: 631–636. 35. Krogan N, Cagney G, Yu H, Zhong G, Guo X, et al. (2006) Global landscape of
protein complexes in the yeast Saccharomyces cerevisiae. Nature 440: 637–643. 36. Collins S, Kemmeren P, Zhao X, Greenblatt J, Spencer F, et al. (2007) Toward a comprehensive atlas of the physical interactome of Saccharomyces cerevisiae. Mol Cell Proteomics 6: 439–450.
37. Stark C, Breitkreutz B, Reguly T, Boucher L, Breitkreutz A, et al. (2006) Biogrid: a general repository for interaction datasets. Nucleic Acids Res 34: D535–D539. 38. Mewes H, Amid C, Arnold R, Frishman D, Gueldener U, et al. (2004) Mips: analysis and annotation of proteins from whole genomes. Nucleic Acids Res 32: D41–D44.
39. Cherry J, Adler C, Ball C, Chervitz S, Dwight S, et al. (1998) SGD: Saccharomyces genome database. Nucleic Acids Res 26: 73–79.
40. Brohe´e S, Van Helden J (2006) Evaluation of clustering algorithms for protein-protein interaction networks. BMC Bioinformatics 7: 488.
41. Ashburner M, Ball C, Blake J, Botstein D, Butler H, et al. (2000) Gene ontology: tool for the unification of biology. Nat Genet 25: 25–29.
42. Xie Z, Kwoh C, Li X, Wu M (2011) Construction of co-complex score matrix for protein complex prediction from ap-ms data. Bioinformatics 27: i159–i166. 43. Song J, Singh M (2009) How and when should interactome-derived clusters be used to predict functional modules and protein function? Bioinformatics 25: 3143–3150.
44. Boyle E, Weng S, Gollub J, Jin H, Botstein D, et al. (2004) Termfinder—open source software for accessing gene ontology information and finding significantly enriched gene ontology terms associated with a list of genes. Bioinformatics 20: 3710–3715.