Joana Tavares Macedo
Licenciatura em Bioquímica
Functional and structural studies of a
mini-ferritin protein
Dissertação para obtenção do Grau de Mestre em Bioquímica
Orientador: Prof. Doutor Pedro Tavares,
Professor Auxiliar, FCT-UNL
Co-orientador: Prof. Doutora Alice Pereira,
Professora Auxiliar, FCT-UNL
Co-orientador: Prof. Doutora Susana Andrade,
Professora Auxiliar, Universität Freiburg
Júri:
Presidente: Prof. Doutor José Ricardo Ramos Franco Tavares Arguente: Prof. Doutora Teresa Sacadura Santos Silva
Vogal: Prof. Doutor Pedro António de Brito Tavares
“Copyright”
Functional and structural studies of a
mini-ferritin protein
Joana Tavares Macedo
Faculdade de Ciências e Tecnologia/Universidade Nova de Lisboa
Universidade Nova de Lisboa
Agradecimentos
Porque o conhecimento não se constrói individualmente e a vida não é só feita de
ajudas e pedidos, gostaria de agradecer a todas as pessoas que me acompanharam ao longo
deste percurso e que contribuíram para o seu sucesso!
Em primeiro lugar, gostaria de agradecer à Faculdade de Ciências e Tecnologia da
Universidade Nova de Lisboa que proporcionou o espaço e as condições para que a minha
aprendizagem fosse possível, bem como a todos os Professores que contribuíram para a
mesma.
Quero agradecer aos meus orientadores, Doutor Professor Pedro Tavares, Doutora
Professora Alice Pereira e Doutora Professora Susana Andrade pela excelente oportunidade
que me deram. Obrigada por me terem recebido nos vossos laboratórios, pela partilha de
conhecimento e por me terem proporcionado uma nova experiência que sem dúvida mudou a
minha vida.
Um agradecimento muito especial ao Doutor Filipe Folgosa! Obrigada por tudo o que
fizeste por mim, tanto em Portugal como na Alemanha. Obrigada por todos os conselhos, todas
as gargalhadas e todas as chamadas de atenção. Sem dúvida que tinhas razão!
Um agradecimento muito especial também ao Tobias Pflüger em múltiplos aspectos
Obrigada por todo o apoio dentro e fora do laboratório. Obrigada por todas as extraordinárias
horas de ajuda e todos os conselhos. Mais do que tudo, obrigada por teres estado sempre
presente quando precisei, pelos bons momentos e por teres contribuído para o meu gosto pela
Alemanha.
Agradeço à Daniela Silva bem como à Nídia Almeida por todo a ajuda e disponibilidade
demonstradas, tal como também pelos bons momentos passados no laboratório. Também
quero agradecer à Doutora Cristina Cordas e a Doutora Cristina Timóteo por todos os
conselhos e pelos convívios e boa disposição
Quero ainda agradecer ao Professor Doutor Oliver Einsle bem como ao seu grupo e ao
grupo da Professora Doutora Susana Andrade, por me terem recebido tão bem nos seus
laboratórios e por se mostrarem sempre disponíveis. Sem dúvida que tornaram esta
experiência ainda mais gratificante! Julian Seidel e Anton Brausemann obrigada pela ajuda
com o Coot e o Pymol. Tobias Wacker obrigada por toda a partilha de conhecimentos,
conselhos e boa disposição. Professor Doutor Thorsten Friedrich obrigada pela a
disponibilidade para a utilização da câmara de luvas. Dankeschön!
Um enorme agradecimento a todos os meus amigos que sempre me apoiaram e
incentivaram quando foi necessário. Obrigada por estarem lá nos bons e nos maus momentos,
obrigada pelos conselhos, pela paciência e por todas as alegrias. A nossa amizade não acaba
aqui!
meu lado e terem acredito em mim. Sem vocês nada disto teria sido possível, obrigada por
tudo! E por mais que esteja geograficamente longe, nunca me vou esquecer de vocês nem do
Abstract
DNA-binding protein from starved cells (Dps) are mini-ferritins mainly expressed in
bacteria during severe environmental stress. These proteins with a highly conserved structure
provide wide protection to cells and function as iron-storage proteins. Some Dps can also bind
DNA and the N-terminus has been suggested to be involved in this interaction, due to its
positively charged residues.
This thesis focused on the functional and structural features of recombinant Dps protein
from Pseudomonas nautica 617 (P. nautica).
To investigate the iron incorporation mechanism, iron uptake assays using H2O2 and O2
as co-substrate for iron oxidation were performed with Dps WT and F46G variant, using
UV-Visible spectroscopy. The results showed that Phe46, located close to the ferroxidase center
(FOC), does not influence the amount of iron stored. Nevertheless, this residue affectes the iron
core formation when O2 was used as co-substrate.
Structural characterization of the incorporation of Fe(II) and Cu(II) was performed with
X-ray crystallography. High resolution crystal structures of Apo-Dps, Dps incubated with 12
Fe(II)/Dps (12Fe-Dps) and Dps incubated with 12 Cu(II)/Dps (12Cu-Dps) were obtained. It was
possible to observe the binding of the metals to the FOCs with different coordination geometry
as well as geometrically different FOCs. Additionally Fe(II) and Cu(II) atoms were assigned in a
position where hydrophilic pores can be created and serve as entry routes for the metals.
For the characterization of the Dps-DNA interaction, electrophoretic mobility shift
assays (EMSAs) were carried out with Dps WT and Q14E variant. The results showed that this
protein can bind DNA, but the affinity for DNA significantly decreases in the presence of the
negative charge in the N-terminus. In this sense, mutations in the N-terminus that may increase
the affinity for DNA binding were produced by site-directed mutagenesis.
Keywords: Dps, X-ray crystallography, iron storage, DNA binding, ferroxidase center, copper
Resumo
DNA-binding protein from starved cells (Dps) são mini-ferritinas maioritamente expressas em bactérias sob extremas condições de stress. Estas proteínas com uma estrutura
altamente conservada, fornecem protecção às células e têm a capacidade de armazenar ferro.
Algumas Dps podem ainda ligar DNA, sendo que foi sugerido que o N-terminal se encontra
envolvido nesta interação, devido a resíduos positivamente carregados.
Esta tese focou-se assim nas características funcionais e estruturais da Dps
recombinante de Pseudomonas nautica 617 (P. nautica).
De forma a investigar o mecanismo de incorporação de ferro recorreu-se à
espectroscopia de UV-Visível. Ensaios de incorporação de ferro foram efectuados com Dps WT
e F46G, usando H2O2 e O2 como co-substratos para a oxidação de ferro. Os resultados
adquiridos mostraram que a fenilalanina 46, situada próximo do centro ferroxidático (FOC), não
influencia a quantidade de ferro armazenado. No entanto, este resíduo afecta a formação do
núcleo de ferro quando O2 é usado como co-substrato.
Por outro lado, a cristalografia de raios-X foi utilizada para a caracterização estrutural
da incorporação de Fe(II) e Cu(II). Estruturas cristalográficas da Apo-Dps, Dps incubada com
12 Fe(II)/Dps e Dps incubada com 12 Cu(II)/Dps foram obtidas com elevada resolução. Com
estas estruturas foi possível observar, a ligação dos metais aos FOCs com diferentes
geometrias de coordenação, bem como, FOCs geometricamente diferentes. Para além disso,
adicionais átomos de Fe(II) e Cu(II) foram identificados numa posição onde poros hidrofílicos
podem ser criados e servir como canais de entrada para os iões metálicos.
Por último, para a caracterização da interação Dps-DNA, ensaios de mobilidade
eletroforética foram realizados com Dps WT e Q14E, demonstrando que esta proteína tem a
capacidade de ligar DNA, mas a afinidade de ligação é significativemente reduzida com a
presença de uma carga negativa no N-terminal. Assim sendo, foram produzidas mutações no
N-terminal que podem aumentar a afinidade de ligação do DNA, através de mutagénese
dirigida.
Palavras-chave: Dps, Cristalografia de Raios-X, armazenamento de ferro, ligação de DNA,
Table of Contents
Agradecimentos V
Abstract VII
Resumo IX
Table of Contents XI
Figures Index XIII
Tables Index XVII
Abbreviations, Symbols and Constants XIX
1 Introduction 1
1.1 Iron – an essential element 1
1.2 Ferritin family 2
1.3 Dps protein 4
1.3.1 Ferroxidase activity 6
1.3.2 DNA binding ability 9
1.3.3 Applications 12
2 Objectives 13
3 Materials and Methods 15
3.1 Materials 15
3.1.1 Chemicals 15
3.1.2 Bacterial strains 15
3.1.3 Plasmids 15
3.1.4 Growth media 17
3.1.5 Kits and Molecular Weight Markers 18
3.1.6 Chromatography 19
3.2 Methods 19
3.2.1 Transformation of competent cells 19
3.2.2 Protein expression 19
3.2.3 Protein purification 21
3.2.4 Protein concentration determination 21
3.2.5 Electrophoresis 22
3.2.6 Iron uptake assays 22
3.2.7 DNA binding assays 26
3.2.8 Site-directed mutagenesis 27
3.2.9 Protein crystallography 29
4 Results 37
4.1 Protein expression and purification 37
4.1.2 Dps F46G expression tests 41
4.1.3 Dps F46G expression and purification 43
4.2 Iron uptake assays 46
4.2.1 Iron uptake assays using H2O2 as co-substrate 47
4.2.2 Kinetics of Fe(II) oxidation with O2 50
4.3 DNA binding assays 51
4.4 Site-directed mutagenesis 54
4.5 Protein crystallography 56
4.5.1 Protein crystallization 56
4.5.2 Data collection and structure determination 58
4.5.3 Protein structures 61
4.5.3.1 Apo-Dps structure 61
4.5.3.2 12Fe-Dps structure 68
4.5.3.3 12Cu-Dps structure 71
5 Discussion 85
6 Outlook 91
7 References 93
8 Appendices 101
8.1 General instrumentation 101
8.2 SDS-PAGE 102
8.3 Oligonucleotides primers data sheets 103
8.4 Crystal systems 106
Figures Index
1 Introduction
Figure 1.1 Structures of the proteins cage from ferritin family. 3
Figure 1.2 Sizes and ribbon diagrams of exterior surface and interior cavity of a maxi
and a mini-ferritin proteins.
3
Figure 1.3 Overall structure of the Streptococcus suis (S. suis) Dpr complexed with
iron atoms.
7
Figure 1.4 FOCs of maxi and mini-ferritins proteins. 8
Figure 1.5 Electrostatic surface potential of the E.coli Dps dodecamer. 10
Figure 1.6 Representations of the proposed DNA binding models. 11
3 Materials and Methods
Figure 3.1 Map of pET-21a-d(+) plasmid (Novagen). Overview of the restriction sites
of the vector showed as a circle map.
16
Figure 3.2 Map of pUC19 plasmid with 2686 base pairs and 1772.76 kDa. (GenBank
Accession #: L09137).
17
Figure 3.3 Molecular weight markers used for electrophoresis gel. 18
Figure 3.4 Reaction of Fe(II) with 1,10-phenantroline and the Fe-1,10-phenantroline
complex.
23
Figure 3.5 Calibration curve obtained with the Fe standard solution. 25
Figure 3.6 Protein crystallization. 30
Figure 3.7 Geometric representation of Bragg’s law. 31
Figure 3.8 X-ray diffraction experiment. 32
Figure 3.9 Anomalous scattering factors, f’ and f’’ derived using the theoretical
approximation developed by Cromer and Liberman, predicted for copper,
chloride, calcium and iron atoms.
33
4 Results
Figure 4.1 Dps WT expression in E.coli BL21(DE3) cells was assessed by
SDS-PAGE.
37
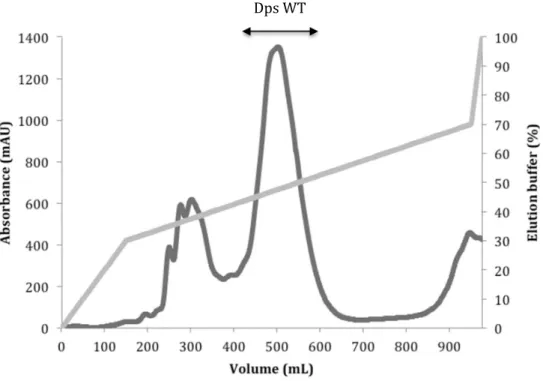
Figure 4.2 Elution profile of DEAE ionic exchange chromatography used in Dps WT
purification.
38
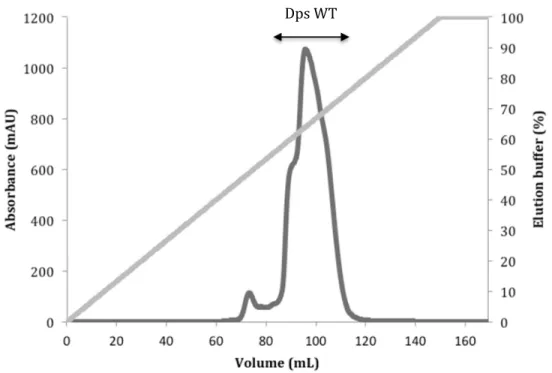
Figure 4.3 Elution profile of Resource Q ionic exchange chromatography used in Dps
WT purification.
Figure 4.4 Elution profile of Superdex 200 size exclusion chromatography used in Dps
WT purification.
40
Figure 4.5 SDS-PAGE analysis of the fractions collected from the different purification
steps of Dps WT.
41
Figure 4.6 Dps F46G expression tests in E.coli BL21(DE3) cells was assessed by
SDS-PAGE.
42
Figure 4.7 Dps F46G expression in E.coli BL21(DE3) cells was assessed by
SDS-PAGE.
43
Figure 4.8 Elution profile of DEAE ionic exchange chromatography used in Dps F46G
purification.
44
Figure 4.9 Elution profile of Superdex 200 size exclusion chromatography used in Dps
F46G purification.
45
Figure 4.10 SDS-PAGE analysis of the fractions collected from the different purification
steps of Dps F46G.
45
Figure 4.11 Structure representative of a dimer of Dps protein highlighting the FOC with
iron bound. The side-chains of the protein residues and the waters
coordinating the iron are showed as sticks as well as the phenylalanine 46. 46
Figure 4.12 Dps WT and Dps F46G iron loading experiment in the presence of an
excess of H2O2.
48
Figure 4.13 Effect of Dps WT on the iron oxidation reaction in the presence of an
excess of H2O2.
49
Figure 4.14 Kinetics of Fe(II) oxidation by Dps WT and Dps F46G in the presence of
O2.
50
Figure 4.15 Binding of Dps WT to supercoiled plasmid DNA pUC19 in 50 mM MOPS
pH 7 and 50 mM NaCl tested by EMSA
52
Figure 4.16 Binding of Dps Q14E to supercoiled plasmid DNA pUC19 in 50 mM MOPS
pH 7 and 50 mM NaCl tested by EMSA.
53
Figure 4.17 Plot of Dps Q14E and Dps WT binding to supercoiled plasmid DNA pUC19
resulting from three analyzes to the EMSA gels.
54
Figure 4.18 Multiple sequence alignment of Dps WT from P. nautica with Dps mutants
obtained by site-directed mutagenesis, Dps Q14K, Dps D9K, Dps D11K
and Dps D9K/D11K.
55
Figure 4.23 Crystal structure of Apo-Dps WT from P. nautica. 62
Figure 4.24 Multiple sequence alignment of Dps WT from P. nautica with Dps-like
proteins from different organisms, using Geneious Aligner.
63
Figure 4.25 Structural comparison of a Dps monomer from P. nautica with monomers
from Dps-like proteins.
64
Figure 4.26 Detailed view of FOCs located between two symmetry-related monomers of
Apo-Dps structure.
66
Figure 4.27 Crystal structure of P. nautica 12Fe-Dps. 69
Figure 4.28 Detailed view of the FOC in a dimer of 12Fe-Dps. 70
Figure 4.29 Crystal structure of P. nautica 12Cu-Dps. 72
Figure 4.30 Detailed view of the FOC in a dimer of 12Cu-Dps. 73
Figure 4.31 Hydrophilic pores formed at the interception of three 12Cu-Dps monomers. 75
Figure 4.32 Detailed view of the junction of three monomers forming a hydrophilic pore
with copper atoms bound.
79
Figure 4.33 Overall view of thecrystal packing of 12Cu-Dps (space group: P22121)
along the different cell axes a, b and c.
78
Figure 4.34 Crystal contacts of 12Cu-Dps (space group: P22121). 79
Figure 4.35 Detailed view of a crystal contact established between two
symmetry-related Dps molecules. One calcium atom is involved in the crystal contact. 80
Figure 4.36 Detailed view of a crystal contact established between two
symmetry-related Dps molecules. Two calcium atoms are involved in the crystal
contacts.
81
Figure 4.37 Overall view of the crystal packing of 12Cu-Dps (space group: P6). 82
Figure 4.38 Overall view of crystal contacts of 12Cu-Dps (space group: P6). 83
8 Appendices
Figure 8.1 Data sheet provided by STABvida of the primers containing the point
mutation to produce the Dps D9K.
104
Figure 8.2 Data sheet provided by STABvida of the primers containing the point
mutation to produce the Dps D11K.
104
Figure 8.3 Data sheet provided by STABvida of the primers containing the point
mutation to produce the Dps Q14K.
105
Figure 8.4 Data sheet provided by STABvida of the primers containing the point
mutation to produce the Dps D9K/D11K.
105
Tables Index
3 Materials and Methods
Table 3.1 Growth media used and their composition and concentration (g/L). 18
Table 3.2 Chromatographic columns used for protein purification as well as their
characteristics and the respective manufacturer.
19
Table 3.3 Composition and experimental procedure applied do the standards
solutions and used to obtain the calibration curve.
24
Table 3.4 Composition and experimental procedure applied to the iron samples used
for the iron quantification.
24
Table 3.5 Iron quantification using the calibration curve. 25
Table 3.6 Sequences of the primers used to obtain the mutations in Dps. 28
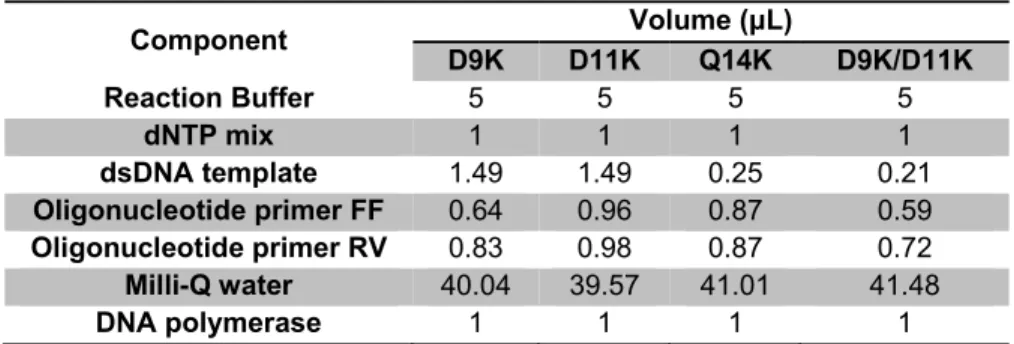
Table 3.7 Composition of the PCR mixtures (50μL) used to produce each Dps variant. 28
Table 3.8 PCR conditions used to produce each Dps variant. 29
4 Results
Table 4.1 Data collection and refinement statistics for Apo-Dps, 12Fe-Dps and
12Cu-Dps.
59
Table 4.2 Root-mean-square deviations (Å) between Dps from P. nautica and
Dps-like proteins with known structure.
65
Table 4.3 Residues and distances of calcium coordination (Å) and B-factor values
(Å2) of FOC with calcium bound in the structure of Apo-Dps.
67
Table 4.4 Residues of the FOC without metals bound and B-factor values (Å2
) in the
structure of Apo-Dps.
67
Table 4.5 Coordination residues and distances of iron binding(Å) and B-factor values
(Å2) of one FOC from the structural model of 12Fe-Dps.
71
Table 4.6 Coordination residues and distances of copper binding (Å) and B-factor
values (Å2) of one FOC from the structural model of 12Cu-Dps.
74
8 Appendices
Table 8.1 Composition used for a 12.5 % acrylamide SGS-PAGE. 102
Abbreviations, Symbols and Constants
Apo-Dps Apoprotein Dps
APS Ammonium persulfate
A. tumefaciens Agrobacterium tumefaciens
a.u. Asymmetric unit
bp Base pairs
BSA Bovine serum albumine
Bfr Bacterioferritin
B. anthracis Bacillus anthracis B. brevis Bacillus brevis
CCP4 Collaborative Computational Project Number 4
CC1/2 Correlation coefficient between random half datasets
DIC Differential Interference Contrast
DNA Deoxyribonucleic acid
DMSO Dimethyl sulfoxide
dNTPs deoxyribonucleotides
Dps DNA-binding protein from starved cells
D. radiodurans Deinococcus radiodurans E. coli Escherichia coli
EMSA Electrophoretic Mobility Shift Assay
EPR Electron Paramagnetic Resonance
ESRF European Synchrotron Radiation Facility
EXAF Extended X-ray Absorption Fine Structure
FF Forward
FOC Ferroxidase center
Ftn Ferritin
HEPES 4-(2-hydroxyethyl)-1-piperazineethanesulfonic acid
HPLC High Performance Liquid Chromatography
H. pylori Helicobacter pylori
ICP-AES Inductively Coupled Plasma Atomic Emission Spectroscopy
IPTG Isopropyl-β-D-thiogalactopyranosid
ITC Isothermal Titration Calorimetry
I/σ(I) Signal-to-noise ratio
LB Luria broth
LB/Agar Luria broth containing Agar
LMW Low molecular weight
MES 4-Morpholineethanesulfonic acid
MID Multiple isomorphous replacement
MOPS 3-(N-Morpholino)propanesulfonic acid
MR Molecular replacement
MWCO Molecular weight cut-off
M. arborescens Microbacterium arborescens M. smegmatis Mycobacterium smegmatis
N Image Number
NCS Non-crystallographic symmetry
NPs Nanoparticles
PEG Polyethylene glycol
PCR Polymerase chain reaction
PDB Protein data bank
P. nautica Pseudomonas nautica 617 OD600 Optical density at 600 nm
RFQ Rapid Freeze-Quench
rmsd Root-mean-square deviation
ROS Reactive oxygen species
RV Reverse
SAD Single-wavelength anomalous dispersion
SID Single isomorphous replacement
SDS Sodium dodecyl sulfate
SDS-PAGE Sodium dodecyl sulfate polyacrylamide gel electrophoresis
SF Stopped-Flow
SLS Swiss Light Source
S. suis Streptococcus suis UV Ultraviolet
UV-Vis Ultraviolet-Visible
Tris Tris(hydroxymethyl)methylamine
TEMED N, N, N’, N’-tetramethylenediamine
WT Wild-type
12Fe-Dps Dps incubated with 12 Fe(II)/Dps
1 Introduction
1.1 Iron – an essential element
Iron, the fourth most abundant element on Earth, is an essential and versatile transition
metal for living organisms. 1,2
At physiological conditions, free iron exists primarily in one of two readily inter-convertible
oxidation states, the relatively soluble ferrous state, Fe(II), and the very insoluble ferric state,
Fe(III). 3 This important nutrient for growth and development of most organisms can also adopt
different spin states and redox potentials in both redox forms, depending on its ligand
environment. 4
Considering its chemical versatility and its abundance, iron is present in the active sites of
many enzymes and oxygen carrier proteins, playing a crucial role in diverse cellular processes
such as oxygen transport, nitrogen fixation, electron transfer reactions, respiration, DNA
synthesis and gene regulation. 1,5
Although the abundance of iron in the environment is high, under physiological, aerobic
conditions and in the absence of anions to increase its solubility, the most stable oxidation state
of iron is Fe(III), which mainly exists as an insoluble iron hydroxide. 6–8
Consequently, iron bioavailability is extremely poor and often a limiting factor for bacterial
growth. 9 Further, under aerobic conditions free iron is potentially toxic for cells due to its ability
to catalyze the formation of reactive oxygen species (ROS). 10
The reaction of Fe(II) ions with molecular oxygen (O2) triggers the formation of reactive
oxygen species, such as superoxide radical (O2-) or hydrogen peroxide (H2O2) according to the
reactions (1.1) and (1.2). 3,5,7
Fe II O → Fe III O ∙ (1.1)
2O ∙ 2H → H O O 1.2)
On the other hand, Fe(III) can be reduced back to Fe(II)by cytoplasmic reductants (1.3)
resulting in a destructive catalytic cycle known as Haber-Weiss reaction. The presence of the
free ferrous ions in cells can lead to the generation of toxic hydroxyl radicals via Fenton (1.4)
and Haber-Weiss (1.5) reactions. 6,7,11
Fe III O ∙ → Fe II O (1.3)
H O O ∙ → OH OH∙ O (1.5)
The deleterious hydroxyl radicals, one of the most reactive species encountered in
biological systems, are capable of damaging several cellular components, such as proteins,
nucleic acids and membrane lipids, leading to abnormal function or inactivation. 5,7
To overcome the poor availability and toxicity of iron and protect cells, organisms have
developed mechanisms to both acquire and maintain iron in a non-toxic and soluble form, which
is mainly achieved by a ubiquitous family of iron-storage proteins, the ferritins. 2,10
1.2 Ferritin
family
Ferritins, a family of iron storage proteins, is widely distributed across all three domains
of life and have a critical role in the maintenance of iron homeostasis in most living organisms
throughout evolution. 12,13
Although DNA and amino acids sequences vary considerable (up to 80 %), the
structural architecture of ferritin proteins is highly conserved. Ferritins are thus examples of
proteins that possess an overall three-dimensional shape that is essential to their function. 13,14
The ferritin superfamily is organized in evolutionary distinct subfamilies that have many
structural and functional similarities: the classical ferritins (Ftn), the bacterioferritins (Bfr) and the
DNA-binding proteins from starved cells (Dps). These subfamilies share the same characteristic
four α-helix bundle fold, though the number of subunits that comprises them is different,
originating two groups, maxi-ferritins (Ftn and Bfr proteins) and mini-ferritins (Dps). 4,13
These protein cages composed by similar subunits folded into a four α-helix bundle
have a three-dimensional structure similar to spherical shells, which provides the capacity to
accommodate large amounts of iron in a non-toxic, soluble and bioavailable form. Nevertheless,
the existence of structural differences leads to a mechanistic diversity. 11,15,16
Protein cage assembly occurs spontaneously from 12 or 24 monomers, which build up
a central hollow cavity that accounts for 30 % of the volume of ferritins. 17
The maxi-ferritins consist of 24 subunits assembled into a protein cage with octahedral
(432) symmetry, while the mini-ferritins are composed by 12 subunits with tetrahedral (32)
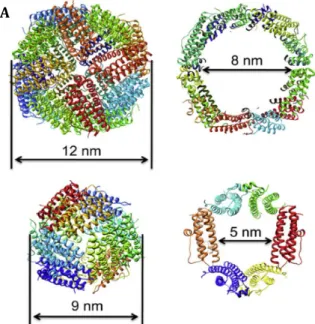
Figure 1.1 - Structures of the proteins cage from ferritin family. The four α-helix bundle monomers are showed as ribbons and a monomer is colored according to its secondary structure. A) Structure of a maxi-ferritin (PDB code: 1BFR). B) Structure of a mini-maxi-ferritin (PDB code: 1DPS). Adapted from 14
These proteins, that form a hollow shell with an outside diameter of 12 or 9 nm and an
inner diameter of 8 or 5 nm for maxi- and mini-ferritins, respectively, possess the dual function
of iron detoxification and iron cellular reserve (Figure 1.2). 18,19
Through a ferroxidation step catalyzed in the ferroxidase center (FOC) located within
the protein shell (Figure 1.4), ferritins have the ability to store up to ~ 4500 or ~ 500 Fe atoms
(maxi- and mini-ferritins, respectively). Iron stored in the form of a hydrous ferric oxide mineral
core can have a variable amount of phosphate, which is related to variations in cytoplasmic
phosphate (ratios of Fe:P~1:1 in plants and bacteria and ratios of Fe:P~1:8 in animals). 12,17
Figure 1.2 - Sizes andribbon diagrams of exterior surface (left) and interior cavity (right) of a maxi and a mini-ferritin proteins. A) Maxi-ferritin (Human heavy-chain ferritin). B) Mini-ferritin (Listeria innocua Dps).19
A B
Thus, the variability of the iron core crystallinity is influenced by the local concentration
of phosphate during mineral formation. The high phosphate content leads to amorphous iron
minerals in ferritin, whereas the ferritin mineral disorder is related to a low phosphate amount.
Nevertheless, the iron core does not affect the electrophoretic or chromatographic properties of
the ferritin. 13,17,20
The ferritin protein cages without mineral are commonly defined as apoferritin and they
can be isolated from recombinant growth or after reducing the mineral and chelating the iron
under physiological conditions. The apoferritin shell is extremely stable due to the large
numbers of intra- and inter-subunit salt bridges and hydrogen bonds. 12,18
The classical ferritins are the archetypical members of the Ferritin family and are found
in all three kingdoms of life. 16
Contrary to ferritins from other organisms, Animal Ftns structures are constituted by
tissue-specific combinations of different H (heavy, predominant in heart) and L (light,
predominant in liver) subunits. Although these two types of subunits are closely related in terms
of primary sequence and structure, their function is very different. The H-type is associated with
the presence of FOCs, which catalyze the oxidation of Fe(II) ions, while L-type is thought to be
involved in the nucleation of the iron core. 7,16
Ftn and Bfr proteins exhibit many similarities and have the same biological purpose, the
iron storage. However, Bfr proteins are restricted to bacterial and archaeal domains of life and
contain twelve haems groups per molecule, non-covalently bound at the interface between
two-fold related subunits. The role of the haem group (in most cases of the b-type) within the protein
shell remains unclear. However, Weeratunga S. K., et al. demonstrated that it may be involved in Fe(III) mineral reduction and its release from the storage cavity. 4,6,13,21
Despite both types of maxi-ferritins have the ability to sequester and incorporate ferrous
iron, the function and regulation of these proteins is substantially variable depending on the
different bacterial species. 22 For example, whereas the Ftn from Escherichia coli (E. coli) and
the Bfr from Salmonella enterica sv. Typhimurium act as the principal iron storage proteins, the Ftn from Helicobacter pylori (H. pylori) is essential for host colonization and the Bfr from Desulfovibrio vulgaris has a Dps-like function. In some cases these proteins can also have dual roles as in Bacteroides fragillis and Campylobacter jejuni, where they are involved in both iron storage and redox stress response. 6,11
On the other hand, Dps proteins, predominantly expressed in bacteria, are more distinct
been identified and approximately 97 % were found in bacteria, while the remaining 3 % were
found in archaea. 24,25
Typically bacterial genomes encode for only one Dps protein, while others encode for
two or for three of these proteins (e.g.: Bacillus anthracis (B. anthracis) and Streptomyces coelicolor, respectively). 25,26
The first Dps protein was discovered in E. coli in 1992 by Almirón et al. as a result of the analysis of proteins synthesized in 3-day-old cultures of E. coli. This protein described as a starvation-inducible DNA-binding protein with regulatory and protective roles in E. coli was found to protect cells from hydrogen peroxide and to bind DNA without apparent sequence
specificity. 27
Thus, the fundamental difference between Dps proteins and the maxi-ferritins (Ftn and
Bfr proteins) is their ability to bind DNA and provide protection to cells during exposing to severe
types of environmental assaults, such as nutritional deprivation and oxidative stress. 23,28
The DNA binding ability is not shared by all members of Dps family (e.g. Dps from
Listeria innocua (L. innocua)), though all of Dps proteins have the capacity to protect DNA from oxidative damage by sequestering iron and preventing the Fenton reaction. 24,29
Regulation of Dps expression in E. coli cells is complex and partly dependent on the physiological state of the cell. It was found that ~ 6000 Dps molecules are present per cell in the
exponential growth phase, reaching a maximum of ~180000 Dps molecules per cell at the late
stationary phase, where Dps is the most abundant cellular protein. 23,30
Furthermore, it has been proposed that Dps plays a role in gene regulation during
starvation periods, since cells lacking Dps alter their protein expression pattern during starvation
and fail to develop starvation-induced resistance to H2O2, an agent that cause oxidative damage
to DNA. The synthesis of this protein increases dramatically in the stationary phase and
continues after several days of starvation, depending on σs, a transcription factor that controls
the expression of many starvation-induced genes. Therefore, this protein has the ability to make
cells more resistant to cytotoxic assaults by controlling the expression of genes necessary for
(or deleterious) to stress resistance. 23,27
During stationary phase, Dps protects the cell not only against oxidative stress, but also
from high pressure, UV and gamma radiation, acid and base shock iron and copper toxicity and
thermal stress. 28
The ability of Dps protein to provide wide protection against the stresses is based on its
four intrinsic properties: DNA binding, metal binding and sequestration, ferroxidase activity and
ability to affect gene regulation. 23,28
The Dps fold and assembly were primarily described for E. coli by Grant et al. who demonstrated the similar structural features with those from ferritins. 31
Despite the fold conservation, Dps-like proteins exhibit a variety of regulatory
mechanisms and functions in addition to protection from oxidative stress and DNA-binding.
protection against multiple stresses and can be useful in applications in bio and
nanotechnology. 24
Dps monomers with a molecular weight of ~18 kDa and four helix-bundle fold, differ
from ferritins because they have a loop located between two helices that form a short helix
exposed on the outside of the protein cage. 14,27
These proteins are characterized by a central core that contains several conserved
amino acids near to FOC and by N- and C-terminal regions with variable length and number of
positive charges. 25
Once assembled, Dps structure is very compact and stable with a highly flexible
N-terminus that usually protrudes out of the dodecamer. The N-terminal region has been
suggested to be important for the DNA-binding ability of Dps proteins and to stabilize the
formation of the dodecamer. Further, the C-terminal has been proposed to be involved in the
interaction with DNA as well. 31–33
The surface as well as the internal cavity of the Dps dodecamers are mainly negatively
charged, providing an ideal microenvironment for iron mineralization. 24,31,34
The 23 symmetry of the Dps dodecamers creates pores at the junction of the threefold
symmetry related subunits that connect the exterior of the dodecamer to the internal cavity. One
pore is created by the N-terminus ends of the subunits and was named “ferritin-like” since it is
lined by negatively charged residues similar to the pores formed at the 3-fold symmetry axes in
ferritins. This pore is highly hydrophilic and it has a negative electrostatic potential created by
the negatively charged residues lining the pores, which may attract iron entry into the protein
and guide it toward the FOC. The other type of pore is formed by the C-terminal ends of the
subunits and is unique to Dps proteins. This pore called “Dps-type” is mainly hydrophobic and
its function is still unknown, possibly because it displays more sequence variability among Dps
proteins than the N-terminal pores. 25,29,35,36
1.3.1 Ferroxidase
activity
Despite the structural conservation within the Ferritin family, the FOC represents the
most distinct structural feature of the Dps proteins relative to maxi-ferritins. 37
Within the Dps dodecamer, twelve FOCs exist and they are located at the interface
between 2-fold symmetry-related monomers rather than within the four-helix bundle of a single
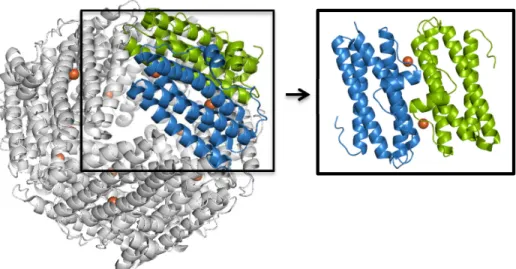
Figure 1.3 - Overall structure of the Streptococcus suis (S. suis) Dpr complexed with iron atoms. Two monomers are highlighted in a different color and consist of two subunits symmetry-related with two FOCs where the iron is bound. Iron atoms are showed as orange spheres. The subunit–subunit interface is evidenced in the black box. (PDB code: 2CF7) Adapted from38
Despite the high conservation of the metal coordinating residues, the occupancy of the
metal binding sites with iron varies significantly in the known crystal structures. 25
FOCs catalyze the reaction that converts soluble Fe(II) ions to a Fe(III)-ferrihydrite
mineral core, where iron remains tightly bound until its release becomes necessary for
biological processes. 22,23
Typically FOCs of Ferritin family located within each monomer are bimetallic, with two
iron atoms located at a maximum distance of 3 Å and connected by an oxo-bridge. The so
called A with high affinity site uses a histidine and carboxylate residues as iron coordinating
ligands, whereas the so called B site with low affinity used only carboxylate residues for the iron
coordination. However, for most of the Dps proteins studied so far a mono-iron ferroxidase site
was observed instead of a di-iron site (Figure 1.4). 25,39
For some Dps-like proteins a conserved water molecule was modeled instead of iron in
the B site, which is the case of L. innocua Dps, where the FOC contains one iron atom and one water molecule with a distance of about 3 Å. On the other hand, the FOC of Dps from H. pylori, Deinococcus radiodurans (D. radiodurans) and Agrobacterium tumefaciens (A. tumefaciens) contains only one iron atom bound at the A site, whereas the FOC of E. coli Dps is occupied by two water molecules. 29,31,34,35,40
Thus, this variability in iron occupancy indicates that the residues forming the second
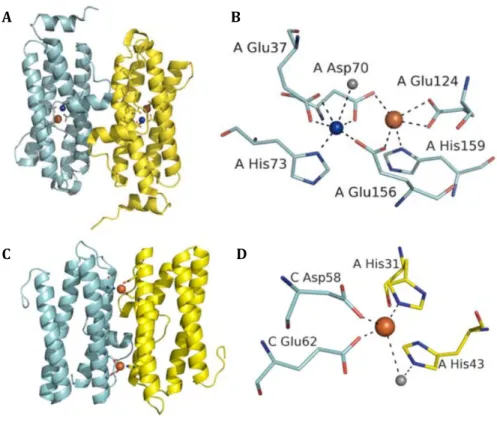
Figure 1.4 - FOCs of maxi and mini-ferritins proteins. A) The dimer interface of bacterioferritin-like protein from S. solfataricus showing one FOC per monomer. B) The FOC of bacterioferritins-like proteins, contains a mixture of metals at both the A- and B-sites. C) The dimer interface of Dps-like protein from L. innocua Dps showing two FOCs between two monomers. D) The FOC of Dps-like proteins. Adapted from24
Despite the overall conservation of the Ferritin family, the ferroxidase activity of Dps
proteins has distinctive features and the iron coordinating residues located in the FOCs are
different. 25,41
In contrast to maxi-ferritins that generally use O2 as iron oxidant, Dps proteins utilize
preferentially H2O2. For Dps proteins, iron oxidation with hydrogen peroxide occurs at much
higher rate and is about 100-fold more efficient than with O2. This disparity may be due to the
difference of the amino acids that constitute the FOCs of maxi- and mini-ferritins. 28,36,42
Considering the binding of two ferrous ions to each FOC of Dps proteins, two ferrous
ions are oxidized for every molecule of H2O2 and the ferric iron is mineralized at the core of the
dodecamer as insoluble hydrous ferric oxide (FeOOH), according to the following reaction (1.6).
A B
Dioxygen can also be used in the ferroxidase reaction, though it is less efficient than
hydrogen peroxide. In this case, the following reaction (1.7) takes place during iron oxidation
and mineralization. 24,28
4Fe II O 6H O → 4FeOOH P 8H (1.7)
The iron oxidized and mineralized is stored within the protein cavity until being released
for intracellular use. So far, very little is known about how the dissolution of the Fe core occurs
in vivo. Even though, in vitro experiments showed that Fe mobilization can occur in the presence of Fe(III) chelators or reductants, it is not clear if the chelators and reductants have
the capacity to penetrate the protein shell and reduce the iron core. 22,43
1.3.2 DNA binding ability
The DNA-binding ability of Dps protein was discovered for E. coli Dps when Dps-DNA complexes were formed, in vitro, by the addition of purified Dps to supercoiled plasmid and linear DNA. 27
Binding assays in vitro evidenced the formation of extremely stable Dps-DNA complexes that do not dissociate even after treatment with detergents or solvents and when incubated up
to 100°C. An additional property observed is that DNA bound to Dps does not reveal a clear
footprint after DNase I digestion. 27 This binding property is similar to other histone-like proteins,
such as the heterodimeric protein HU associated with the E. coli nucleoid and the heat-stable nucleoid-structuring protein H-NS, despite Dps does not share amino acid sequence of
structural similarities with these proteins. 23,44
Therefore, this binding characteristic of E. coli Dps demonstrates its ability to bind DNA without apparent sequence specificity. 27
However, DNA is unable to bind directly to the surface of Dps protein because the
surface of Dps does not display DNA-binding motifs and is mainly negatively charged (Figure
Figure 1.5 - Electrostatic surface potential of the E.coli Dps dodecamer. The positive charges of the molecular surface are colored in blue, whereas the negative charges are colored in red. 31
Based on the X-ray crystal structure of E. coli Dps and its electrostatic surface potential, it has been suggested that DNA binding involves interactions with three positively charged
residues (lysines) of the N-terminus. This highly mobile region that protrudes out from the
surface of the dodecamer was disordered and thus it was not observed in the electron density
maps of the structure. 31
On the other hand, it has been recently proposed that the interaction is mediated by Mg2+
ions that form multiple ion bridges between Dps and DNA. These ion bridges can only be
formed upon a specific concentration of Mg2+, because otherwise the surfaces of both
molecules become similarly charged and consequently repel each other. 45
The inhibition of DNA binding by Lactococcus lactis Dps in the presence of EDTA supports the suggestion that divalent cations are required for the formation of the Dps-DNA
complexes. 33
Even though the lysine residues of N-terminal region as well as the divalent cations have
been found to be important for DNA binding, the exact binding mechanism is still not completely
understood. 24
The binding of Dps proteins to DNA results in the formation of Dps-DNA biocrystals.
Despite the crystalline state is considered to be incompatible with life, co-crystallization of DNA
and Dps in cells in living systems may provide an efficient means of protection against severe
environmental assaults. 23,24
Electron microscopy studies of Dps and Dps-DNA complexes, conducted on E. coli cells showed that Dps form a layered crystalline structure characterized by a pseudo-hexagonal
packing. Moreover, the addition of DNA accelerates this crystallization process and the
interaction between purified Dps and DNA results in the formation of an extremely stable crystal
crystalline structure and by the fact that members of the Dps family without a positively charged
N-terminus (Dps from L. innocua, B. anthracis and H. pylori) do not appear to bind DNA. 26,29,46
Therefore, based on the crystal structures of Dps proteins and on electron microscopy
studies for E. coli Dps, two hypothetical models for DNA binding have been proposed (Figure 1.7).
The first model proposed from the crystal structure of E. coli Dps by Grant, R. A. et al, suggests that the DNA helices could be inserted and bind DNA in the holes created between
three adjacent dodecamers (Figure 1.6, A). These holes are occupied by disordered N-terminus
residues that are not present in the model, so the positively charged lysine residues could
interact with DNA molecules. If Dps dodecamers could adjust their position, all of the
interactions between adjacent dodecamers would be identical and a perfect hexagonal
two-dimensional lattice would be created in which all the holes would be similar and sufficiently large
to accommodate DNA molecules. 24,31
On the other hand, the second model (Figure 1.6, B) is more recent and proposes that
the addition of DNA to Dps does not disturb the hexagonal packing and DNA molecules could
be packed between the layers of Dps dodecamers in the structure. This model was further
supported by the X-ray crystal structure of Bacillus brevis (B. brevis)Dps, which showed that the multi-layered structure of Dps forms grooves that lead to channels. These could
accommodate DNA molecules alternatively displayed in spaces between the multi-layers of Dps
dodecamers. 47
Figure 1.6 – Representations of the proposed DNA binding models. A) Model for DNA binding where the DNA molecules could be inserted in apertures between neighboring dodecamers. The Dps dodecamer is colored in purple and the N-terminal stretches are showed in blue. The DNA helices presented were modeled in green with phosphates colored in red. The outline of the unit cell is showed in black. 31 B) Model for DNA binding where the DNA molecules could be accommodate in the spaces between alternated layers of Dps dodecamers. 47
Hence, Dps can provide a bimodal protection to chromosomal DNA within the cells
during starvation conditions. This can be achieved directly through physical sequestration of
DNA molecules and indirectly with the oxidation of ferrous atoms by hydrogen peroxide that
reduces the production of toxic hydroxyl radicals via Fenton reaction. 23,24
1.3.3 Applications
Several applications in the field of biotechnology and nanotechnology have been
exploited using Dps proteins.24 The protein assembly provides a size and shape constrained
reaction environment for the synthesis of nanomaterials, such as magnetic nanoparticles (NPs)
and catalytic materials with different compositions, sizes and properties. The chemical nature of
these proteins cages can be altered, which significantly changes their synthetic utility.49,50
Iron oxide NPs synthesized within the Dps protein cage can be used to catalyze the
formation of carbon nanotubes with a narrow diameter distribution. 51 Besides that, these
proteins can also be loaded with cobalt, producing cobalt oxide NPs, as an alternative catalyst
source for the production of carbon nanotubes. The benefit of using protein cages as
nanocontainer is that the cores can be selectively loaded to control the size of the particles. 52,53
2 Objectives
In the past years, maxi-ferritins have been extensively studied and are now very well
characterized. Even though maxi-ferritins are structurally similar to mini-ferritins, the knowledge
about mini-ferritins is still limited.
So far, it is known that Dps proteins are able to capture and store iron in its inner cavity.
Besides, it has been demonstrated that some of these proteins also have the ability to bind and
protect DNA. However, the mechanism of iron incorporation and release is not fully clear and
very little is known about the interaction of the DNA with Dps. A lysine-rich N-terminal region of
the protein has been suggested to be required the DNA binding, but the exact mechanism of
binding is still not completely understood.
Based on what was stated above, the focus of this thesis was the study of the functional
and structural features of a recombinant Dps from Pseudomonas nautica 617 (P. nautica), where the main goals are described below.
The first goal consisted on the investigation of the mechanisms of iron incorporation by
Dps protein. Previous work has demonstrated the ferroxidase activity of Dps wild-type (WT), but
the exact molecular mechanism is still under debate. Therefore, a Dps variant where a
phenylalanine, suggested to be important for the iron incorporation, is replaced by a glycine was
studied, aiming to elucidate about the role of this amino acid in the iron incorporation or iron
oxidation in the FOC.
The second goal was the structural characterization of the metals incorporation into the
protein, such as iron and copper, using X-ray crystallography. As described in the literature, Dps
proteins can be used to produce metallic NPs with a narrow size. Previous studies showed the
ability of this protein to bind copper as well as the formation of heterometallic cores. However, it
is still not clear if the FOC is mononuclear or binuclear and is unknown where the copper
binding takes place in this Dps protein and how the core formation is accomplished. Cu(II) is a
stable metal and a good paramagnetic probe. Therefore, Dps could be used to metabolize
copper and increase the resistance of cells to the copper toxicity as well as a structural probe
for the mechanism of iron binding and for the production of metallic NPs.
The third goal was the characterization of the Dps-DNA interaction. Previous studies
have shown the DNA binding ability of this Dps and the involvement of the N-terminus in the
interaction. Thus, Dps variants were studied to obtain more insights about how such interaction
is established. Electrophoretic mobility shift assays (EMSAs) were performed with a Dps variant
where a glutamine is replaced by a glutamate. Further, point mutations were done in the
N-terminal region of this protein to increase the strength of the interaction, which could help in the
3 Material and Methods
3.1 Materials
3.1.1 Chemicals
The chemicals and reagents used to prepare buffers and solutions were of analytical
purity grade (p.a.) and obtained from the following companies: Sigma-Aldrich, Panreac,
Fluka, Merck, AppliChem, NZYTech, VWR Prolabo and LabChem.
3.1.2 Bacterial
strains
E. coli strain NZY5α (NZYTech) was used for plasmid amplification and DNA isolation, whereas E. coli strain NZYStar (NZYTech) was utilized for amplification and isolation of the plasmid originated in the site-directed mutagenesis protocol. For gene expression the E. coli strain BL21(DE3) (NYZTech) was used.
3.1.3 Plasmids
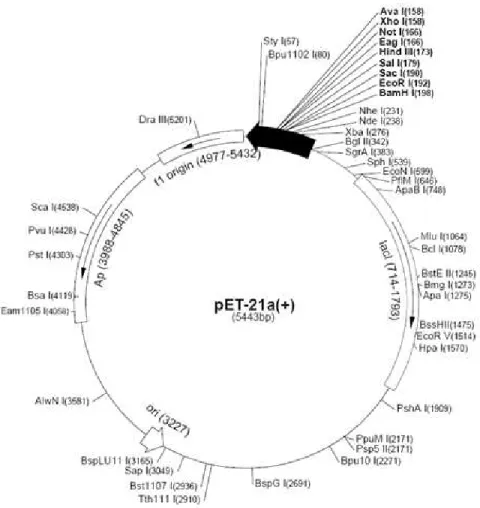
The pET-21c(+) plasmid (Novagen), showed in Figure 3.1, was used as expression
vector for the recombinant Dps WT and variant proteins in E. coli. This ampicillin-resistant expression vector pET21c-PnDps containing the coding gene for the Dps WT from P. nautica, was previously prepared by Márcia Guilherme. 55
Figure 3.1 – Map of pET-21a-d(+) plasmid (Novagen). Overview of the restriction sites of the vector showed as a circle map. 56
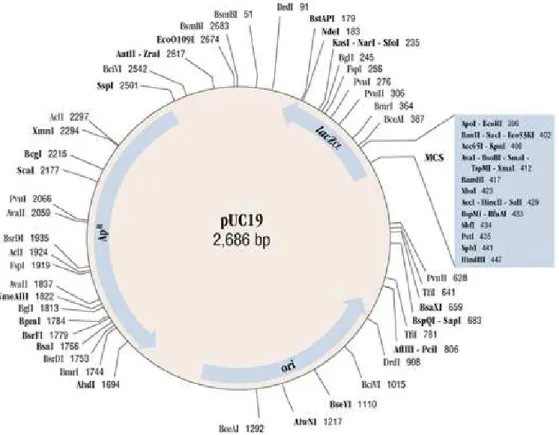
The pUC19 plasmid with 2686 bp and 1772.76 kDa, showed in Figure 3.2, was used for
Figure 3.2 - Map of pUC19 plasmid with 2686 base pairs and 1772.76 kDa (GenBank Accession #: L09137).
3.1.4 Growth
media
The growth media used and their formula are listed in Table 3.1. In contrast to the 2xYT
medium, the LB and LB/Agar media (NZYTech) were already prepared and ready to be used.
The growth media (25 g for LB and 35 g for LB/Agar) were always dissolved in 1 L of distilled
water and autoclaved at 121 °C for 20 min. The solutions were allowed to cool-down before
adding antibiotics (Ampicillin 100 mg/mL). The LB/Agar medium was then distributed in sterile
Table 3.1 - Growth media used and their composition and concentration (g/L).
Medium Composition Concentration (g/L)
LB Tryptone NaCl Yeast extract 10 10 5 LB/Agar Tryptone NaCl Yeast extract Agar 10 10 5 12 2xYT Tryptone NaCl Yeast extract 20 20 10
3.1.5 Kits and Molecular Weight Markers
The kits used for DNA mutagenesis and DNA isolation (Miniprep and Midiprep) as well as
the molecular weight marker (Low molecular weight) used for Sodium dodecyl sulfate
polyacrylamide gel electrophoresis (SDS-PAGE) and agarose gel electrophoresis (NZYLadder
II and NZYLadder III) were purchased from NZYTech and used according to the respective
manuals. The electrophoretic profiles of the molecular weight markers are presented in Figure
3.3.
6000 60 10000 100
5000 50 4000 40 3000 30 2500 25 7500 75
2000 20
1400 14 1000 100 800 80
400 40
200 20 600 60
A B C
3.1.6 Chromatography
For Dps purification the an ÄKTA Prime chromatography system (GE Healthcare)
controlled by the PrimeView software were used. The chromatographic columns used as well as
their characteristics are listed in Table 3.2. The columns were used according to the
manufacturer’s instructions and stored in 20 % EtOH.
Table 3.2 – Chromatographic columns used for protein purification as well as their characteristics and the respective manufacturer.
Column Characteristics Manufacturer
DEAE Sepharose Fast Flow
Weak anion exchanger Volume 160 mL Pressure Max. 0.3 MPa
Amersham Biosciences
Resource Q
Strong anion exchanger Volume 6 mL Pressure Max. 0.6 MPa
GE Healthcare
Superdex 200
Size exclusion 10-600 kDa Volume 82 mL Pressure Max. 1.5 MPa
GE Healthcare
3.2 Methods
3.2.1 Transformation of competent cells
Transformation of competent E. coli BL21 (DE3) cells was performed according to the manufacture’s protocol. Cells were transformed with the expression vector pET21c-PnDps. The
plasmid DNA was added to the cells and the transformations were incubated on ice for 30 min,
followed by heat-shock at 42 °C for 40 s. Further 2 min of incubation on ice were performed,
900 μL of LB medium were added and the cells were incubated at 37 °C for 1 hour at 220 rpm.
After transformation, cells were plated in sterile Petri dishes containing LB/Agar medium
with Ampicillin (100 mg/mL) and incubated overnight at 37 °C.
3.2.2 Protein
expression
order to find the best expression conditions by varying the culture media (LB and 2xYT), the
induction agent (isopropyl-β-D-thiogalactopyranosid, IPTG 0.1, 0.5 and 1 mM), the optical
density at 600 nm (0.5 or 2) and incubation time after induction (3 or 16 hours).
The bacterial growth was carried out at 37 °C and 200 rpm. Aliquots were taken every
hour until 16 h after induction.
Samples were normalized considering OD600 and protein expression profile of each of
them was evaluated by SDS-PAGE electrophoresis.
Protein expression and cell harvesting
For Dps WT expression, a single colony was picked and inoculated in 5 mL of LB
medium containing Ampicillin (100 mg/mL) at 37 °C and 200 rpm for 8 h.
Then, 1 mL of pre-culture was inoculated in 100 mL LB medium containing Ampicillin
(100 mg/mL) and incubated at 37 °C and 220 rpm for 16 h.
Expression cultures of 1 L were grown at 37 °C and 200 rpm in LB medium with
Ampicillin (100 mg/mL). Induction was done with 0.5 mM IPTG at and OD600 of 0.5.
After 3 h of induction, the expression cultures were harvested by centrifugation for 10
min at 10,000 x g and 8 °C (Z 36 HK, HERMLE LaborTechnik). The cell pellets were collected
and the wet cell mass was determined. Before storage at -80 °C, the pellets were resuspended
in 10 mM Tris-HCl,pH 7.6.
For Dps F46G expression, the procedure used for was similar to the described for the
WT. However, in this case, the medium used was 2xYT and the cells were induced by addition
of 0.1 mM IPTG.
Cell disruption
The soluble cellular content was isolated from the remaining cellular components,
before proceeding with the purification.
Cells were disrupted in two steps. In a first step cell disruption was performed by
freeze-thaw cycles. The second step consisted in using an ultrasonic homogenizer equipped
with a 7 mm diameter probe (LABSONIC M, Sartorius). Cells were disrupted through 3 or 7
cycles for Dps WT and Dps F46G, respectively, and each cycle consisted of 3 min of continue
protein (soluble extract), was dialyzed overnight against 10 mM Tris-HCl, pH 7.8. SDS-PAGE
gel electrophoresis was performed with all the cellular fractions mentioned above.
3.2.3 Protein purification
For the purification of Dps protein, the dialyzed cellular extract was centrifuged at 10000
x g and 8 °C for 10 min and filtered with a 0.45 μm membrane filter.
After each purification step, Dps fraction purity was assessed by SDS-PAGE
electrophoresis (12.5 % acrylamide).
Dps protein fractions were tested for catalase contamination.
Ionic exchange chromatography
As a first purification step, a DEAE Sepharose Fast Flow column was used. The
dialyzed cellular extract was loaded onto the column and washed with equilibration buffer (10
mM Tris-HCl buffer pH 7.6). Dps protein was then eluted with a discontinuous gradient of buffer
10 mM Tris-HCl buffer pH 7.6 and 500 mM NaCl. A flow rate of 5 mL/min was used and 12 mL
fractions were collected.
For Dps WT, a second step of ion exchange step was done using a Resource Q
column. The dialyzed protein was loaded onto the column with a flow rate of 4mL/min and
washed with the equilibration buffer (10 mM Tris-HCl buffer pH 7.6). Dps protein was eluted
with a continuous linear gradient of elution buffer 10 mM Tris-HCl buffer pH 7.6 and 500 mM
NaCl). A flow rate of 1 mL/min was used and 4 mL fractions were collected.
Size exclusion chromatography
To separate further impurities from the target protein a size exclusion chromatography
step was carried out using a Superdex 200 column. The column was equilibrated with a running
buffer containing 10 mM Tris-HCl buffer, pH 7.6 and 500 mM NaCl and a concentrated protein
sample was loaded onto the column. Protein was eluted with a flow rate of 1.5 mL/min and
collected in 2 mL fractions.
3.2.4 Protein concentration determination
Protein concentration was determined by UV-Visible spectroscopy by measuring three
samples prepared with different dilutions. The molar extinction coefficient of Dps protein at 280
3.2.5 Electrophoresis
SDS-PAGE
SDS-PAGE is a technique widely used for the determination of protein’s molecular
mass and to verify the protein purity.
Gel polymerization was performed according to the protocol described by Laemmli,
using the solutions and volumes showed in Appendix 8.1, Table 8.1. 60
The samples were prepared by adding sample buffer containing β-mercaptoethanol in a
1:1 ratio and heated in boiling water for 5 min. Then, the samples were loaded on a 5 %
stacking gel and the separation was done using a 12.5 % running gel.
The electrophoresis was carried out in the Mini-PROTEAN Tetra System (BIO-RAD)
with a fixed voltage (80 V for the first 30 minutes and 120 V until the end of the run) in 1 x
Tris-Glycine running buffer pH 8.3.
For the visualization of the protein bands, gels were stained with Coomassie Brilliant
Blue R-250 staining solution for 30 min and destained using a methanol/acetic acid solution.
After this gels were photographed with Gel Logic 100TM (Kodak).
The stock solutions for SDS-PAGE were prepared according to the described in
Appendix 8.1, Table 8.2.
Agarose gel electrophoresis
Agarose gel electrophoresis is commonly used in the determination of DNA or RNA
fragment’s molecular weight and to assess the purity. This technique allows the separation of
nucleic acids fragments according to their size by applying an electric field.
The concentration of agarose in each gel range between 0.8 and 1 % (w/v). Samples
were prepared by adding BlueJuiceTM Gel Loading Buffer (Invitrogen) in a 1:1 ratio to the DNA
sample.
Electrophoresis was carried out at 80 V for 1 h 30 min in 1x TAE (v/v) buffer (40 mM
Tris-acetate pH 8 and 0.1 mM EDTA).
After electrophoresis, gels were stained with SYBR Safe (Invitrogen) solution for 20-30
min. Gels were then imaged with Safe ImagerTM (Invitrogen) and photographed with Gel Logic
To analyze the role of phenylalanine 46 in the iron incorporation mechanism, iron
uptake assays were performed using the two co-substrates and two Dps variants, WT and the
Dps F46G mutant.
The assays were monitored by UV-Visible spectroscopy, using an Evolution 300
spectrophotometer (Thermo Scientific) connected to a computer using VISION proTM software.
Quartz cuvettes of 3 mL (Hellma Analytics) were used. The baseline was performed with the
reaction buffer, 200 mM MOPS buffer pH 7 and 200 mM NaCl.
A ferrous iron chloride solution was prepared and quantified using the protocol
described below.
Iron quantification
Iron quantification performed by a colorimetric assay based on the reaction of
1,10-phenanthroline with Fe(II) solution. In this assay, hydroxylamine hydrochloride is used to reduce
the iron to its ferrous state through the following reaction (3.1).
2Fe III 2NH OH 2OH → 2Fe II N 4H O (3.1)
After this, Fe(II) reacts with 1,10-phenantroline and forms an orange-red complex
(Figure 3.4) that can be monitored through UV-Vis absorption spectroscopy at 510 nm, which
has a characteristic molar extinction coefficient of 11.2 mM-1cm-1. The iron content in each
sample is proportional to the formation of the Fe-1,10-phenantroline complex. 61,62
Figure 3.4 - Reaction of Fe(II) with 1,10-phenanthroline with the formation of the Fe-1,10-phenantroline complex. 61
For the iron quantification a calibration curve was performed using a standard Fe(II)
solution (0.01 mg/mL) and following a protocol adapted from Maloney, K. M., et al. 63 The
standard iron solution was prepared using Milli-Q water at pH 3 to prevent the formation of iron
Table 3.3 - Composition and experimental procedure applied do the standards solutions and used to obtain the calibration curve.
Reagent Standard Tube (mL)
Standard Fe solution 0 0.2 0.4 0.8 1.2 1.6
Milli-Q water 2.5 2.3 2.1 1.7 1.3 0.9
Mix (vortex)
10% Hydroxylamine 0.4 0.4 0.4 0.4 0.4 0.4
Mix (vortex)
0.3% Phenantroline 0.4 0.4 0.4 0.4 0.4 0.4
Mix (vortex) and wait 10 min
Milli-Q water 1.7 1.7 1.7 1.7 1.7 1.7
Absorbance measurement at 510 nm
Table 3.4 - Composition and experimental procedure applied to the iron samples used for the iron quantification.
Reagent Sample Tube (mL)
FeCl2 solution 0.3 0.6 0.9
Milli-Q water 2.2 1.9 1.6
Mix (vortex)
10% Hydroxylamine 0.4 0.4 0.4
Mix (vortex)
0.3% Phenantroline 0.4 0.4 0.4
Mix (vortex) and wait 10 min
Milli-Q water 1.7 1.7 1.7
Absorbance measurement at 510 nm
With the absorbance measurements, the calibration curve was calculated and the molar
Figure 3.5 - Calibration curve obtained with the Fe standard solution. Experimental results were best fitted with the following equation: Abs510= 12.038[Fe(II)] ± 0.16 (R2=0.99786).
The iron content in the samples was determined using the calibration curve equation
obtained (Figure 3.5). All the samples were quantified and the iron concentration calculated with
the Lambert-Beer’s Law and taking into account the dilutions performed (Table 3.5).
Table 3.5 - Iron quantification using the calibration curve.
Sample Tube (mL)
Abs510 [Fe] (mM) [Fe] median taking dilutions
into account (mM)
StDev (mM)
0.3 0.134 0.498
1.826 0.005
0.3 0.143 0.498
0.3 0.139 0.498
0.6 0.261 0.581
0.6 0.247 0.581
0.6 0.265 0.581
0.9 0.369 0.665
0.9 0.376 0.665
0.9 0.382 0.665
The iron concentration of the FeCl2 stock solution prepared for the loading assays was
Iron uptake assays using H2O2 as co-substrate
To determine maximum iron load by Dps WT and Dps F46G, consecutive additions of
48 Fe(II)/protein (9.6 μM of FeCl2) followed by an excess of H2O2 (19.2 μM of H2O2, previously
quantified by UV-Vis spectroscopy) were performed under aerobic conditions.
The additions were performed to a cuvette containing 2 mL of 0.2 μM of protein in 200
mM MOPS buffer pH 7 and 200 mM NaCl and measurements at 340 nm were recorded every 2
seconds. The reaction mixture was constantly stirred using a micro stir bar in the bottom of the
cuvette.
The maximum iron storage capacity was determined by plotting the relative absorbance
at 340 nm versus the calculated Fe(II)/protein molar ratio.
Kinetics of Fe(II) oxidation with O2
To analyze the rate of iron oxidation by Dps WT and Dps F46G in the presence of O2,
0.6 μM of protein in 200 mM MOPS buffer pH 7 and 200 mM NaCl was reacted with 192
Fe(II)/protein and O2. Before the beginning of the assay, the sample solution was oxygenated
inside the cuvette was oxygenated by exposing to molecular oxygen for 1 min. UV-Visible
spectra between 250 and 800 nm were recorded every 30 min for 15 hours.
The kinetic data (Absorbance at 340 nm vs. Time) was further analyzed. The theoretical
first order kinetic model proposed for Dps WT was adjusted to the experimental data using the
Solver tool of Microsoft Excel and an apparent kinetic rate constant (k’) was determined.
3.2.7 DNA binding assay
Electrophoretic Mobility Shift Assay
EMSA is a sensitive method for detection of protein-nucleic acid complexes in vitro. For this binding assay, samples of protein and nucleic acid are combined in a suitable buffer and
the binding is allowed to occur. The resulting mixtures are then evaluated by electrophoresis
under native conditions.
Generally, this assay is based on the observation that the electrophoretic mobility of a
protein-nuclei acid complex is less than that of free nucleic acid. Thus, during electrophoresis
Supercoiled DNA pUC19 (15 nM) was incubated for 10 min at room temperature with Dps
Q14E (between 0.21 and 7.5 μM) in 50 mM MOPS buffer (pH 7) and 50 mM NaCl in for a total
volume of 10 μL. As control, samples where Dps Q14E was replaced by BSA (4.4 μM) and free
plasmid DNA were also prepared and analyzed.
EMSA was performed in 1 % agarose gel in 1 x TAE buffer and run at 80 V at room
temperature for 1 h 30 min. The results were visualized using SYBR Safe DNA gel stain,
imaged with Safe ImagerTM (Invitrogen) and photographed in a Gel Logic 100 Imaging System
(Kodak).
Electrophoretic images evaluation
The electrophoretic images obtained were processed and analyzed (free DNA and
DNA-protein complex bands) using ImageJ. 66 To analyze the relative DNA-protein complex
formation, the fractional saturation of the complex formation was plotted as a function of protein
concentration.
3.2.8 Site-directed
mutagenesis
Site-directed mutagenesis is a technique used to modify template DNA by the controlled
exchange of nucleotide(s) and deletion or insertion of DNA fragments(s). Synthetic
oligonucleotide primers for mutagenesis must contain the desired mutation in both strand
directions, forward and reverse, and also complement the desired target sequence on opposite
strands of the plasmid. 67
The desired mutation is usually placed in the middle of the primers with approximately 15
or more bases of correct sequence on both sides. Further, according to the standard conditions
primers should have between 30 and 45 bases pairs with a melting temperature of at least 78
°C. Primers should also have a minimum GC content of 40 % and end with one or more C or G
bases. 68
The Dps variants, D9K, D11K, D9K/D11K and Q14K, were produced by site-directed
mutagenesis using the NZYMutagenesis kit (NZYTech) following the manufacture’s protocol.
This kit is designed to introduce point mutations and delete or insert single or multiple
nucleotides in a template double-stranded DNA sequence.
Oligonucleotides Primers
The oligonucleotide primers used to produce the point mutations were designed and
analyzed for optimization with the software OligoAnalyzer. The primers were then synthesized
and purified by STABVida (data sheets of the primers provided by STABVida in Appendix 8.3,

![Figure 3.5 - Calibration curve obtained with the Fe standard solution. Experimental results were best fitted with the following equation: Abs 510 = 12.038[Fe(II)] ± 0.16 (R 2 =0.99786)](https://thumb-eu.123doks.com/thumbv2/123dok_br/16489694.733099/45.918.176.732.129.518/figure-calibration-obtained-standard-solution-experimental-following-equation.webp)