Performance of an In-House Human
Immunodeficiency Virus Type 1 Genotyping
System for Assessment of Drug Resistance in
Cuba
Yoan Alemán1‡, Lore Vinken2‡, Vivian Kourí1, Lissette Pérez1, Alina Álvarez1,
Yeissel Abrahantes3, Carlos Fonseca3, Jorge Pérez3, Consuelo Correa1, Yudira Soto1,
Yoeri Schrooten2, Anne-Mieke Vandamme2,4, Kristel Van Laethem2 *
1Virology Department, Institute of Tropical Medicine“Pedro Kourí”, Havana City, Cuba,2Rega Institute for Medical Research, Department of Microbiology and Immunology, KU Leuven, Leuven, Belgium,3Hospital at Institute of Tropical Medicine“Pedro Kourí”, Havana City, Cuba,4Centro de Malária e outras Doenças Tropicais and Unidade de Microbiologia, Instituto de Higiene e Medicina Tropical, Universida de Nova de Lisboa, Lisboa, Portugal
‡These authors contributed equally to this work. *[email protected]
Abstract
As commercial human immunodeficiency virus type 1 drug resistance assays are expen-sive, they are not commonly used in resource-limited settings. Hence, a more affordable in-house procedure was set up taking into account the specific epidemiological and economic circumstances of Cuba. The performance characteristics of the in-house assay were evalu-ated using clinical samples with various subtypes and resistance patterns. The lower limit of amplification was determined on dilutions series of 20 clinical isolates and ranged from 84 to 529 RNA copies/mL. For the assessment of trueness, 14 clinical samples were analyzed and the ViroSeq HIV-1 Genotyping System v2.0 was used as the reference standard. The mean nucleotide sequence identity between the two assays was 98.7%±1.0. Additionally, 99.0% of the amino acids at drug resistance positions were identical. The sensitivity and specificity in detecting drug resistance mutations was respectively 94.1% and 99.5%. Only few discordances in drug resistance interpretation patterns were observed. The repeatabili-ty and reproducibilirepeatabili-ty were evaluated using 10 clinical samples with 3 replicates per sample. The in-house test was very precise as nucleotide sequence identity among paired nucleo-tide sequences ranged from 98.7% to 99.9%. The acceptance criteria were met by the in-house test for all performance characteristics, demonstrating a high degree of accuracy. Subsequently, the applicability in routine clinical practice was evaluated on 380 plasma samples. The amplification success rate was 91% and good quality consensus sequences encoding the entire protease and the first 335 codons in reverse transcriptase could be ob-tained for 99% of the successful amplicons. The reagent cost per sample using the in-house procedure was around€80 per genotyping attempt. Overall, the in-house assay
a11111
OPEN ACCESS
Citation:Alemán Y, Vinken L, Kourí V, Pérez L, Álvarez A, Abrahantes Y, et al. (2015) Performance of an In-House Human Immunodeficiency Virus Type 1 Genotyping System for Assessment of Drug Resistance in Cuba. PLoS ONE 10(2): e0117176. doi:10.1371/journal.pone.0117176
Academic Editor:Chandravanu Dash, Meharry Medical College, UNITED STATES
Received:June 3, 2014
Accepted:December 19, 2014
Published:February 11, 2015
Copyright:© 2015 Alemán et al. This is an open access article distributed under the terms of the
Creative Commons Attribution License, which permits unrestricted use, distribution, and reproduction in any medium, provided the original author and source are credited.
Data Availability Statement:All Cuban sequences are available at the Los Alamos HIV Sequence Database (www.hiv.lanl.gov). The Leuven sequences are available from the GenBank database (accession numbers KJ936912, KJ936913, KJ936914, KJ936915, KJ936916, KJ936917, KJ936918, KJ936919, KJ936920, KJ936921, KJ936922, KJ936923, KJ936924, KJ936925).
provided good results, was feasible with equipment and reagents available in Cuba and was half as expensive as commercial assays.
Introduction
Access to antiretroviral therapy (ART) has been scaled up rapidly since 2001 in Cuba and this has markedly reduced human immunodeficiency virus (HIV)/Acquired Immune Deficiency
Syndrome (AIDS) related morbidity and mortality [1]. By the end of 2013, 58.6% of people
liv-ing with HIV-1 were receivliv-ing ART (unpublished data). Due to financial constraints, viral load testing was only implemented in 2003 and frequency of CD4 and viral load testing was lower
than recommended in international guidelines [2]. This creates the potential of on-going viral
replication resulting into emergence and transmission of drug resistance which necessitates
drug resistance testing for surveillance purposes and for individual patient monitoring [3–5].
Therefore, financial support for the implementation of HIV-1 drug resistance testing was re-quested to the Vlaamse Interuniversitaire Raad (VLIR) and granted in 2008.
The aim of this study was to design an accurate and affordable HIV-1 genotyping system enabling the assessment of drug resistance against protease (PR) and reverse transcriptase (RT) inhibitors in the Cuban setting. The Cuban HIV-1 epidemic is characterized with the presence of almost all subtypes and particular circulating recombinant forms (CRFs). In 2003, the high-est prevailing subtype was subtype B (41%), followed by CRF19_cpx (18%), BG recombinants (12%), CRF18_cpx (7%), subtype C (6%), subtype G (4%), subtype H (2%) and other subtypes
and unique recombinant forms (URFs) (10%)[6]. The performance characteristics of the drug
resistance assay and its applicability were also evaluated.
Material and Methods
Clinical samples
A total of 424 clinical plasma samples was used in the validation of the in-house assay. A selection of 20 plasma samples from HIV-1 patients attending the Institute of Tropical
Medicine“Pedro Kourí”(IPK) (Cuba) was used to determine the lower limit of amplification.
The panel included the predominant subtypes in Cuba and comprised subtypes A1 (2 sam-ples), B (4), C (4), CRF18_cpx (4), CRF19_cpx (4), and BG-recombinants (2). Viral loads were determined using Nuclisens Easy Q HIV-1 Kit version 2.0 (Biomérieux, Craponne, France) or COBAS TaqMan HIV-1 Test For Use With The High Pure System (Roche, Mannheim, Germany).
To assess the trueness (including sensitivity and specificity), 14 plasma samples from HIV-1 patients attending the University Hospitals in Leuven (Belgium) were selected based upon se-quences previously obtained at the University Hospitals of Leuven (Belgium) using the ViroSeq HIV-1 genotyping system v2.0 (Celera, Alameda, CA, USA; Abbott Molecular, Wavre, Bel-gium). The panel included samples with subtypes A (2 samples), B (4), C (1), D (1), G (1), H (1), CRF02_AG (1) and URF (3), representing multiple resistance patterns including mixtures and viral loads ranging from 692 to 263,027 RNA copies/mL. Viral loads were determined using the Abbott RealTime HIV-1 assay (Abbott Molecular, Wavre, Belgium).
To evaluate the precision of the assay, repeatability and reproducibility were determined on 2 panels of 5 plasma samples from HIV-1 patients attending the IPK and displaying multiple drug resistance patterns and various subtypes (subtypes B (2), C (2), CRF18_cpx (2), CRF19_cpx (1), CRF20_BG (1), CRF24_BG (2)). The selection of patients was based upon Wetenschappelijk Onderzoek Vlaanderen
(G.0692.14N) and by the AIDS Reference Laboratory of Leuven that receives support from the Belgian Ministry of Social Affairs through a fund within the Health Insurance System. The funders had no role in study design, data collection and analysis, decision to publish, or preparation of the manuscript.
sequences previously obtained at the IPK using the in-house drug resistance test described in this study.
For the evaluation of the applicability of the test in a clinical setting, the genotyping results were evaluated for 380 plasma samples from 352 HIV-1 patients attending the IPK for clinical care between September 2009 and September 2011. This dataset included 92 plasma samples obtained from therapy naïve patients and 220 samples from therapy experienced patients. For the remaining 68 plasma samples, the therapy history of the patients was unknown.
In-house genotyping system
1. RNA extraction
For HIV-1 viral RNA extraction, 1 mL of plasma or serial dilutions of plasma in phosphate
buffered saline (PBS) was ultra-centrifuged at 20,000 x g for 1 h at 4⁰C to pellet the virus. The
supernatant was removed, retaining 140μL to suspend the pellet again. Subsequently, the viral
RNA extraction was performed manually or automatically on the QIAcube (QIAGEN, Hilden, Germany) using the QIAamp Viral RNA Mini Kit (QIAGEN, Hilden, Germany), as described
by the manufacturer’s protocol. Isolated RNA was eluted in 60μL elution buffer and stored at
-80°C until use. 2. Primer design
The PCR and sequencing primers were designed using thegag-polgene alignment of several
HIV-1 group M strains available at the Los Alamos HIV Database (www.hiv.lanl.gov), with the
inclusion of all available strains from CRFs in Cuba (CRF18_cpx, CRF19_cpx, CRF20_BG,
CRF23_BG and CRF24_BG) [6]. The primers were positioned taking into account the HIV-1
genetic variability, the absence of codons associated with drug resistance and the average cover-age length of sequencing segments obtained with the local automatic sequencer (CEQ 8800 Ge-netic Analysis System (Analis, Namen, Belgium)). The primers were evaluated using OLIGO software (Medprobe, Oslo, Norway) and modified when necessary. The primers were
synthe-sized by Life Technologies (Gent, Belgium). The primer sequences are given inTable 1.
3. Amplification
Ten microliters of the extracted RNA was reverse transcribed and amplified in a one-step RT-PCR using the SuperScript III One-Step RT-PCR System with Platinum Taq High Fidelity
kit (Life Technologies, Gent, Belgium). The reaction mixture was composed by: 25μL of 2X
Re-action Mix (containing 0.4 mM of each dNTP and 2.4 mM MgSO4), 0.5μL 20μM primer
AV159 (Table 1), 0.5μL 20μM primer AV192 (Table 1), 8μL 5 mM MgSO4, 1μL SuperScript
III RT/Platinum Taq High Fidelity Enzyme Mix, 0.25μL 40 U/μL Protector RNase inhibitor
(Roche, Mannheim, Germany) and H2O until a final volume of 40μL. Reverse transcription
was performed at 55°C for 30 min. The amplification started with an initial denaturation at 94° C for 2 min, followed by 40 cycles of: denaturation at 94°C for 15 sec, annealing at 50°C for 30 sec and elongation at 68°C for 2 min, with a final elongation at 68°C for 5 min. A 2,060-bp amplicon, encompassing HIV-1 PR and the first part of RT, was thus obtained.
The inner 1,770-bp PCR fragment was generated using the Expand High Fidelity PCR Sys-tem (Roche, Mannheim, Germany). To prevent degradation of primers and Sys-template, the PCR
mixes were prepared in two separate tubes. Thus, a first tube was prepared containing 0.4μL
25 mM of each dNTP, 1.25μL 20μM primer AV190 (Table 1), 1.25μL 20μM primer AV191
(Table 1) and H2O until a final volume of 23μL. The second tube contained 5μL 10X Expand
High Fidelity Buffer, 6μL 25 mM MgCl2, 0.75μL 3.5 U/μL Expand High Fidelity Enzyme Mix
and H2O until a final volume of 25μL. Two microliter of the outer PCR product was added to
the first tube and subsequently 25μL of the second PCR mix was added to each reaction tube,
min; 30 cycles of 95°C for 15 sec, 50°C for 30 sec and 68°C for 2 min; and finally to 68°C for 5 min. All cycling programs were run on a Thermocycler Doppio (VWR, Leuven, Belgium). Am-plification products were separated on a 1% agarose gel and visualized by ethidium bromide staining and UV light. Only positive reactions were subjected to sequencing analysis.
4. Sequencing analysis
The PCR products were purified using the QIAquick PCR Purification Kit (QIAGEN, Hil-den, Germany) following the protocol indicated by the manufacturers. Purified PCR products were subjected to population-based bi-directional sequencing using the Dye Terminator Cycle Sequencing (DTCS) Quick Start Kit (Analis, Namen, Belgium). Separate reactions with 7 dif-ferent primers were performed, in order to enable the coverage of a 1,302-bp fragment that en-codes the 99 amino acids of HIV-1 PR and the first 335 amino acids of HIV-1 RT. Each
mixture consisted of 1μL 5μM primer (KVL162, KVL163, KVL164, KVL165, KVL176,
KVL177 or KVL178) (Table 1), 8μL Quick Start DTCS Master Mix, 5μL purified PCR product
and 6μL H2O to complete the reaction to 20μL. Cycling conditions on a Thermocycler Doppio
were 50 cycles of 96°C for 30 sec, 50°C for 20 sec and 60°C for 4 min. The sequence products were purified according to the protocol described in the DTCS Quick Start Kit. The sequencing fragments were run on a CEQ 8800 Genetic Analysis System (Analis, Namen, Belgium). Final-ly, the electropherograms were displayed and assembled, and sequences were manually edited using Sequencher version 4.10.1 (Gene Codes Corporation, Ann Arbor, USA) and HIV-1 sub-type B strain HXB2 as a reference (GenBank accession number K03455).
ViroSeq HIV-1 Genotyping System
The FDA-cleared and CE-marked ViroSeq HIV-1 Genotyping System version 2.0 (Celera, Ala-meda, CA, USA; Abbott Molecular, Wavre, Belgium) was used as the standard test for the vali-dation of the in-house assay. ViroSeq is designed to detect drug resistance mutations (DRM) in the entire PR (amino acids 1 to 99) and the first part of the RT gene fragment (amino acids 1 to 335) from HIV-1 subtype B plasma samples with a viral load ranging from 2,000 to 750,000 RNA copies/mL (ViroSeq specifications). At a viral load of 2,000 RNA copies/mL and with 40% mutant viruses present, the sensitivity and specificity in detecting HIV-1 DRM was 98.1% and 99.9%, respectively. These values decreased to respectively 92.7% and 99.9% for samples with a viral load of 1,000 RNA copies/mL and 40% mutant viruses (ViroSeq specifications). Table 1. Primers for the amplification and sequencing of the HIV-1 protease and reverse transcriptase.
Primers Sequence 5’-3’ Positiona Direction Description
AV159 GGG GTT AAA TAA AAT AGT AAG 1593–1613 Sense Outer primer for amplification
AV192 AAT TGT TTT ACA TCA TTA GTG TG 3630–3652 Antisense Outer primer for amplification
AV190 GCT ACA CTA GAA GAA ATG ATG AC 1810–1832 Sense Inner primer for amplification
AV191 CTT GAT AAA TTT GAT ATG TCC ATT G 3555–3579 Antisense Inner primer for amplification
KVL162 TTC CCT CAR ATC ACT CTT TGG CA 2250–2272 Sense Sequencing
KVL164 ACC AGT AAA AYT RAA RCC AGG AAT G 2573–2597 Sense Sequencing
KVL163 CAC AGG GAT GGA AAG GRT CAC C 2998–3019 Sense Sequencing
KVL177 AAR GAM AGC TGG ACT GTC AAT GA 3294–3316 Sense Sequencing
KVL165 GTR TTR TAT GGA TTT TCA GGC CCA A 2698–2722 Antisense Sequencing
KVL176 TTG YTC TAT GYT GCC CTA TTT CTA 3127–3150 Antisense Sequencing
KVL178 CTA TTA AGT CTT TTG ATG GGT CAT A 3504–3528 Antisense Sequencing
aPositions according to HXB2 (GenBank accession number K03455).
For clinical samples with a viral load ranging from 1,800 to 10,500 RNA copies/mL, the sensitivity and specificity at a threshold of 40% mutants was 99.65% and 99.95%, respectively
[7]. The repeatability and reproducibility for detecting DRM were95% (ViroSeq
specifications).
In this study, ViroSeq testing was performed at the AIDS Reference Laboratory in Leuven (Belgium), where this system has been used since 2000 for monitoring drug resistance in
HIV-1 infected patients [8]. All steps in the procedure were performed according to manufacturer’s
instructions, except for plasma volume, non-B subtypes and sequencing editing software. In-deed, RNA extraction was performed using 1 mL of plasma to increase the amplification
sensi-tivity and to enable genotyping below 2,000 RNA copies/mL [9]. The sequencing reactions
were run on an ABI3130xl Genetic Analyzer (Life Technologies, Gent, Belgium), and electro-pherograms were assembled and subsequently manually edited using SeqScape version 2.6 (Life Technologies, Gent, Belgium). The AIDS Reference Laboratory yearly participates in an external quality assessment program (ENVA HIV Drug Resistance Typing panels from QCMD (Quality Control for Molecular Diagnostics, Glasgow, UK)) for which excellent results
have been obtained for trueness [10]. Nucleotide (NT) and amino acid (AA) identity scores at
DRM positions were respectively 99.76% and 99.67% when compared to the reference se-quence, which was the consensus sequence derived from the results of all submitting partici-pants within the program.
Performance evaluation
In order to assess the performance of the in-house genotyping assay, the lower limit of amplifi-cation and the accuracy (including trueness and precision) in detecting NT and AA sequences as well as in detecting mutations at DRM positions were evaluated. The general definitions of
these performance characteristics were adopted from Jennings et al. [11]. Acceptance criteria
for some of the characteristics were established prior to analysis (see further).
The lower limit of amplification was defined as the lowest viral load at which samples could be amplified. Briefly, plasma samples were 10-fold serially diluted in PBS until a theoretical viral load below 1,000 RNA copies/mL was achieved. The serial dilutions were extracted and amplified with the in-house test. The procedure was considered successful if the amplicons could be visualized with ethidium bromide staining and UV light on an agarose gel. Subse-quently, the last serial dilution that was considered positive, was subjected to 2-fold serial dilu-tions until a theoretical viral load below 100 RNA copies/mL was achieved, extracted,
amplified and analyzed on an agarose gel. The lower limit of amplification should be1,000
RNA copies/mL as this is the cut-off for which drug resistance testing is recommended [2].
Trueness was assessed using 14 clinical samples and one negative control, and by comparing genotyping results of the in-house assay with the results of the ViroSeq HIV-1 Genotyping Sys-tem version 2.0. The acceptance criterion for trueness was established as the pairwise agreement
of95% at NT level. At AA level, the threshold was defined as99% identity at known DRM
positions if no mixtures are present and>50% if mixtures are present in the reference standard
[5,12–14].
and reproducibility was defined as98% NT identities in90% of the pairwise comparisons [9,12,14,15].
Nucleotide sequence identity scores were defined as the percentage NT identity of a pairwise comparison of NT sequences. Mixed versus unmixed bases were counted as discordant. The NT sequence identity scores were determined using the EMBOSS pairwise alignment tool (http://www.ebi.ac.uk/Tools/psa/emboss_needle/nucleotide.html) with default gap-penalty values. Amino acid sequence identity scores were defined as the percentage AA identity of a pairwise comparison of AA sequences. AA identity scores were also determined at DRM posi-tions and at surveillance drug resistance mutation (SDRM) posiposi-tions only. Calculaposi-tions were performed using SeqScape version 2.6. Mixed versus unmixed AA were counted as discordant. DRM positions were defined as all positions for which AA changes are included in the resis-tance interpretation algorithms Rega v9.1.0, ANRS 2013.09 and/or HIVDB v7.0 (89 DRM
posi-tions). SDRM positions were defined according to Bennett et al. [16] (43 SRDM positions).
Drug resistance interpretations were conducted using the Stanford website and resistance
interpretation algorithms Rega v9.1.0, ANRS 2013.09 and/or HIVDB v7.0 (http://sierra2.
stanford.edu/sierra/servlet/JSierra?action = algSequenceInput).
Subtyping
HIV-1 subtyping was performed using the Rega subtyping tool version 3 [17], and confirmed
by manual phylogenetic analysis using CLUSTAL-X and the neighbor-joining method in
MEGA version 5 (Kimura’s 2-parameter correction, bootstrap 1,000) [18]. The assignment of
recombinant genetic forms was done using Simplot version 2.5 [19]. The reference dataset
in-cluded subtypes A (Genbank accession number AM000055, AM000053), B (AY037269, DQ383746, K03455), C (AY563170, AY727522), D (K03454, M27323), F (DQ189088, AF077336), G (AF084936, AY371121), H (AF190127, AF190128, AF005496), J (EF614151, AF082394, AF082395), K (AJ249235, AJ249239), recombinants containing unclassified regions (AF286236, AF457101), CRF01_AE (AF197340, U51188), CRF02_AG (AY371122,
AY371123), CRF18_cpx (AF377959, AY586541, AY894993, AY586540), CRF19_cpx (AY588971, AY588970, AY894994), CRF20_BG (AY586545, AY586544), CRF23_BG (AY900571, AY900572) and CRF24_BG (AY900574, AY900575).
Quality control
A negative control was included in each run to monitor for cross-contamination. Additionally, to confirm the absence of any sample mix-up and/or cross-contamination, sequence artifacts
were investigated using the Calibrated Population Resistance tool version 6.0 (http://cpr.
stanford.edu/cpr.cgi) and phylogenetic reconstructions were performed on all generated
se-quences. The 2008 subtypes and CRF reference dataset from Los Alamos database (http://
www.hiv.lanl.gov/content/sequence/NEWALIGN/align.html) was included. The sequences were aligned with Muscle in MEGA version 5. Surveillance drug resistance mutation (SDRM)
positions [16] were removed from the alignment to avoid bias from convergent evolution [20].
A maximum likelihood tree was constructed using the RAxML v7.8.1 software [21] with the
GTR+гNT substitution model. The robustness of the tree topology was assessed by a bootstrap
analysis of 1,000 replicates. The tree diagram was plotted using FigTree v1.4.0.
Ethics statement
The study has been approved by the ethical committee of the Institute of Tropical Medicine
“Pedro Kourí”(Havana, Cuba), and complies with the principles laid down in the Declaration
Results
Lower limit of amplification
The lower limit of amplification ranged between 84 and 529 RNA copies/mL, and the median
limit was 275 RNA copies/mL (IQR 225–363) (Table 2). For all subtypes the lower limit of
am-plification was well below the recommended threshold of 1,000 RNA copies/mL.
Trueness
Trueness was assessed in each specimen of a set of 15 samples, by comparing genotyping
re-sults obtained with the reference method ViroSeq and the in-house assay (Table 3). One
nega-tive control was included in the panel and was neganega-tive in the in-house test. The viral loads of the 14 clinical samples ranged from 692 to 236,027 RNA copies/mL. Genotyping was successful for all these samples with both assays. For specimen 3 and 14, the NT sequences generated by ViroSeq were shorter than anticipated (respectively 1,218 and 1,221 NT), so only 88 of 89 pre-defined DRM positions could be evaluated for these samples.
The mean NT sequence identity score between both assays was 98.7% ± SD 1.0 (trueness). Each individual NT sequence identity score was well above the predefined acceptance criterion
of95%. Among the 14 samples, 235 NT differences were observed between both assays and
were in 98% of the instances caused by a difference in the detection of mixtures (230/235). The other discordances (5/235) resulted from scoring a different nucleotide. In total, 486 NT mix-tures were identified by the ViroSeq system and/or the in-house assay. From these mixmix-tures, 256 (53%) were detected by both assays, whereas 150 (31%) were only detected by ViroSeq and 80 (16%) only by the in-house assay.
Table 2. Lower limit of amplification of the in-house HIV-1 genotyping assay.
Subtype Sample HIV-1 RNA copies/mL
Original viral load Lower limit of amplification
A1 1 33,333 84
2 70,000 350
B 3 52,873 529
4 12,000 300
5 3,009,000 301
6 1,000,000 500
C 7 15,000 375
8 15,000 375
9 50,574 253
10 200,000 200
CRF18_cpx 11 11,000 138
12 16,000 160
13 465,507 466
14 80,000 100
CRF19_cpx 15 1,100,000 275
16 11,000 275
17 2,000 250
18 499,989 250
BG-recombinants 19 114,940 287
20 26,000 260
Table 3. Assessment of trueness in each specimen for the in-house HIV-1 genotyping system as compared to the ViroSeq system.
Specimen
ID Subtype Viral load(copies/mL) Mutations at (S)DR pos.
a Sequence
identity score (%)
AA identity score (%)
Assay PR RT NT AA At DR
pos. At SDRpos.
01 A/G 2,455 VS 20I, 35D, 36I, 41K, 69K, 70KR,
77V,82I, 89M
- 98.0 97.9 97.8 100.0
IH 20I, 35D, 36I, 41K, 69K, 70K, 77IV, 82I, 89M
-02 H 28,184 VS 16E, 20R, 36I, 41K, 43KR, 60E,
62V, 63N, 69K, 89I
- 96.7 97.2 98.9 100.0
IH 16E, 20R, 36I, 41K, 43K, 60E, 62V, 63N, 69K, 89I
-03 D/B 2,884 VS 16A, 41N, 69Q, 77I 40D, 189I 98.9 99.1 100.0 100.0
IH 16A, 41N, 69Q, 77I 40D, 189I
04 B 5,129 VS 35D, 63P, 93L - 98.7 99.3 100.0 100.0
IH 35D, 63P, 93L
-05 D 158,489 VS 10V, 16E, 41K, 43K, 60E, 62V,
64IL, 77I,85VI, 89F, 93L
- 96.9 97.0 97.8 100.0
IH 10V, 16E, 41K, 43EK, 60E, 62V, 64IL, 77I,85VI, 89F, 93IL
-06 B 1,660 VS 10IL, 35D, 36IM, 41KR,54IV, 62IV,
63T, 71AV,84IV,90LM
74LV, 98AS,115FY,
184MV, 221HY 98.6 98.4 96.6 100.0 IH 10I, 35D, 36IM, 41R,54IV, 62IV,
63T, 71AV,84IV,90LM
74LV, 98AS,115FY, 184MV, 221H
07 G 42,658 VS 20I, 35Q, 36I, 41K, 63P, 69K,82I,
89M
- 99.2 100.0 100.0 100.0
IH 20I, 35Q, 36I, 41K, 63P, 69K,82I, 89M
-08b - 0 VS - - - - -
-IH -
-09 B 8,318 VS 15V, 35D, 63P - 99.9 99.8 100.0 100.0
IH 15V, 35D, 63P
-10 C 10,965 VS 15V, 36I, 41N, 63LP, 69K, 89LM,
93L
40D 98.8 99.1 100.0 100.0
IH 15V, 36I, 41N, 63LP, 69K, 89LM, 93L
40D
11 B/D 236,027 VS 15V, 20R, 35D, 36I, 41KR,47I,50I, 54IV, 62V, 63P, 69H, 71V,88D
210W,215S 98.6 97.9 96.6 95.3
IH 15V, 20R, 35D, 36I, 41KR,47IM, 50IM,54IV, 62V, 63P, 69HN, 71V, 88D
210W,215S
12 CRF02_AG 1,413 VS 20I, 36I, 41K, 69K, 70R, 89M 67DN,106A 99.4 98.8 98.9 97.7
IH 20I, 36I, 41K, 69K, 70R, 89M 67D,106A
13 A 692 VS 35D, 36I, 41K, 69K, 70R, 89M 40D,103N,179I 100.0 100.0 100.0 100.0
IH 35D, 36I, 41K, 69K, 70R, 89M 40D,103N,179I
14 A 18,621 VS 20KR, 33F, 36I, 41K, 69K, 89M,
93L
67N,69N,179IV,
219Q 98.9 99.3 98.9 100.0
IH 20R, 33F, 36I, 41K, 69K, 89M, 93L 67N,69N,179IV, 219Q
The overall AA identity score at DRM positions was 99.0% (trueness) as 1,231 of the 1,244
evaluated DRM positions were identical for both methods (Table 4). Furthermore, 99.5%
agreement was observed at DRM positions if no mixtures were present (1,210 of 1,216 tions) and 75% concordance at DRM positions where mixtures were present (21 of 28 posi-tions) in the ViroSeq result. At SDRM positions, 599 of the 602 evaluated positions were concordant between the two assays, resulting in an overall trueness of 99.5%. The agreement at SDRM positions was 99.7% if no mixtures were present (590 of 592 positions) and 90% if mix-tures were present (9 of 10 positions) in the ViroSeq result. At both DRM and SDRM positions, the predefined acceptance criteria for trueness were met. The AA differences at DRM and SDRM positions were all caused by mixtures detected by one of the methods, and not by the other. The in-house method detected mixtures at 6 of the 13 discordant DRM positions and at 2 of the 3 discordant SDRM positions, whereas ViroSeq detected mixtures at 7 and 1 positions, respectively. In total, 33 AA mixtures at DRM and 12 AA mixtures at SDRM positions were identified by the ViroSeq system and/or the in-house assay. From these mixtures, 20 (61%) at DRM and 9 (75%) at SDRM positions were detected by both assays, whereas respectively 7 (21%) and 1 (8%) only by ViroSeq and 6 (18%) and 2 (17%) only by the in-house assay.
The specificity and sensitivity of the in-house assay were respectively 99.5% and 94.1% in detecting mutations at DRM positions and 99.7% and 95.5% in detecting mutations at SDRM
positions (Table 4). In addition, the in-house assay demonstrated good positive and negative
Table 3. (Continued)
Specimen
ID Subtype Viral load(copies/mL) Mutations at (S)DR pos.
a Sequence
identity score (%)
AA identity score (%)
Assay PR RT NT AA At DR
pos. At SDRpos.
15 B 66,069 VS 20R, 36ILM, 45KR, 62IV, 63AP,
77I, 93L
41L 99.3 99.5 100.0 100.0
IH 20R, 36ILM, 45KR, 62IV, 63AP, 77I, 93L
41L
ID identity; AA amino acid; NT nucleotide; (S)DR pos. (surveillance) drug resistance positions; VS ViroSeq; IH in-house; PR protease; RT reverse transcriptase.
a
AA changes at DR pos. using HXB2 (GenBank accession number K03455) as a reference sequence. Bold: SDR pos., underlined: discordances between the ViroSeq and in-house assay.
b
Sample 08 was the blinded negative control.
doi:10.1371/journal.pone.0117176.t003
Table 4. Overall assessment of trueness in detecting mutations at (surveillance) drug resistance positions for the in-house HIV-1 genotyping system.
No. of mutations at (S)DR
pos. by ViroSeq %
In-house Positive Negative Sensitivity Specificity Trueness PPV NPV
DR pos. Positive 111 6 94.1 99.5 99.0 94.9 99.4
Negative 7 1,120
SDR pos. Positive 21 2 95.5 99.7 99.5 91.3 99.8
Negative 1 578
ViroSeq was used as the reference standard. (S)DR pos. (surveillance) drug resistance positions; PPV positive predictive value; NPV negative predictive value.
predictive values, respectively 94.9% and 99.4% at DRM positions and 91.3% and 99.8% at SDRM positions.
Only 3 DRM (43R in PR; 67N and 221Y in RT) observed in the ViroSeq results were not de-tected by the in-house assay. The other differences observed at DRM positions were related to amino acid changes that are not included in the drug resistance interpretation rules. By not de-tecting 221Y in RT, drug resistance was missed for rilpivirine according to ANRS and Rega (from respectively resistant and intermediate resistant in the ViroSeq result towards susceptible in the in-house result). By not detecting 67N in RT, intermediate resistance was not detected for zidovudine and stavudine according to HIVDB. The differences for PR mutation 43R did not alter the drug resistance interpretations. In addition, 2 DRM (69N and 77I in PR) were de-tected by the in-house method, but not by ViroSeq. Only PR mutation 69N altered the ANRS drug resistance interpretation for tipranavir/r (intermediate resistance in the in-house result and susceptible in the ViroSeq result). Finally, one SDRM (67N in RT) was detected by Viro-Seq, but missed by the in-house method.
Precision
The in-house assay showed good results for both repeatability (Table 5) and reproducibility
(Table 6). In the assessment of reproducibility for sample 21, only 2 replicates could be generated. For sample 25, the amplification failed three times at the dilution step of 250 copies/ mL.
The NT sequence identity ranged from 98.8% to 99.9% and from 98.7% to 99.7% in the re-peatability and reproducibility assessment, respectively. For both analyses, 100% of the
pair-wise comparisons (15/15 and 20/20) were98% identical on NT level, well above the
predefined threshold of98% nucleotide identities in90% of the pairwise comparisons. At
AA level, similarly high sequence identity scores were reached at all positions, DRM positions
and SDRM positions, as shown in Tables5and6. No differences were observed in the detection
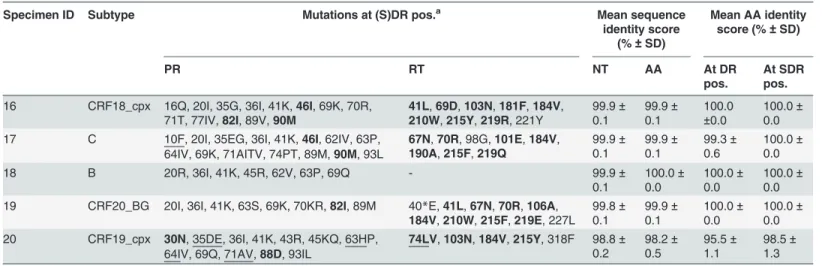
of SDRM between all the replicates of each sample for both repeatability and reproducibility. Table 5. Repeatability of the in-house HIV-1 genotyping system.
Specimen ID Subtype Mutations at (S)DR pos.a Mean sequence
identity score (%±SD)
Mean AA identity score (%±SD)
PR RT NT AA At DR
pos. At SDRpos.
16 CRF18_cpx 16Q, 20I, 35G, 36I, 41K,46I, 69K, 70R,
71T, 77IV,82I, 89V,90M 41L,210W,69D,215Y,103N,219R, 221Y181F,184V, 99.9
± 0.1 99.9± 0.1 100.0 ±0.0 100.0± 0.0 17 C 10F, 20I, 35EG, 36I, 41K,46I, 62IV, 63P,
64IV, 69K, 71AITV, 74PT, 89M,90M, 93L
67N,70R, 98G,101E,184V,
190A,215F,219Q 99.9
± 0.1 99.9± 0.1 99.3± 0.6 100.0± 0.0
18 B 20R, 36I, 41K, 45R, 62V, 63P, 69Q - 99.9±
0.1 100.0± 0.0 100.0± 0.0 100.0± 0.0 19 CRF20_BG 20I, 36I, 41K, 63S, 69K, 70KR,82I, 89M 40*E,41L,67N,70R,106A,
184V,210W,215F,219E, 227L 99.8± 0.1 99.9± 0.1 100.0± 0.0 100.0± 0.0 20 CRF19_cpx 30N, 35DE, 36I, 41K, 43R, 45KQ, 63HP,
64IV, 69Q, 71AV,88D, 93IL
74LV,103N,184V,215Y, 318F 98.8±
0.2 98.2± 0.5 95.5± 1.1 98.5± 1.3
Number of replicates for each sample is 3. ID identity; AA amino acid; NT nucleotide; (S)DR(pos.) (surveillance) drug resistance (positions); SD standard deviation; PR protease; RT reverse transcriptase.
aAA changes at DR pos. using HXB2 (GenBank accession number K03455) as a reference sequence. Bold: SDR pos., underlined: discordant between
the 3 replicates.
Although in 2 samples not all mutations at DRM positions were detected in every replicate during the assessment of repeatability, this had only a minor impact on drug resistance inter-pretation, because the particular amino acid changes were not included in the drug resistance interpretation rules or they did not trigger a change in the interpretation. In total, only 2 DRM were not detected in the 3 replicates. In sample 17, the minor DRM 10F (in PR) was not de-tected in 2 replicates, resulting in an altered REGA and ANRS drug resistance interpretation for atazanavir/r (from resistant in the ViroSeq result towards respectively intermediate resis-tant and susceptible in the in-house result), an altered ANRS interpretation for fosamprenavir/ r (from resistant towards susceptible) and a different ANRS resistance interpretation for sa-quinavir/r (from resistant towards intermediate resistant). In sample 20, the minor DRM 71V (in PR) was missed in 2 replicates, altering the REGA resistance interpretation for saquinavir/r (from intermediate resistant towards susceptible).
In the assessment of reproducibility, only two DRM were not detected in the 3 replicates. 189I in RT was missed in the replicate generated by the second technician for sample 23. For
sample 25–2000, 36V in PR was detected by only one of the replicates. However, the absence of
189I and 36V did not change the drug resistance interpretations for these samples.
Finally, the sequences generated from 25–2000, 25–1000 and 25–500 were compared with
the sequence generated from the original non-diluted plasma sample and the respective mean pairwise NT identity scores were 98.9% ± 0.6, 99.1% ± 0.2 and 99.0% ± 0.3. Mean pairwise AA identity scores were respectively 99.4% ± 0.5, 99.5% ± 0.0 and 99.8% ± 0.3 at all positions, 99.3% ± 1.3, 99.3 ± 1.3 and 100.0% ± 0.0 at DRM positions and 100.0% ± 0.0, 100.0% ± 0.0 and 100.0% ± 0.0 at SDRM positions. Drug resistance interpretations were concordant between all the replicates and the non-diluted plasma sample.
Table 6. Reproducibility of the in-house HIV-1 genotyping system.
Specimen
ID Subtype Mutations at (S)DR pos.
a Mean sequence
identity score (%±SD)
Mean AA identity score (%±SD)
PR RT NT AA At DR
pos. At SDRpos.
21 C 15V, 35D, 36I, 41K, 69K,88NT, 89M 41L,75I, 98S,103N, 132L,
184V,215Y 99.6 99.5 100.0 100.0
22 CRF24_BG 10I, 15V, 20I, 35D, 36I, 41K,54V, 62V, 66F,
69K, 70R, 74K,82I, 89M, 93IV 62V,184V70E,75I, 98S,115F,181C, 99.7
± 0.1 99.5± 0.3 100.0± 0.0 100.0± 0.0 23 CRF18_cpx 16E, 20I, 35D, 36I, 41K, 64M, 69K, 70R, 89M 40D,181C,184V, 189IV, 221Y 99.6±
0.1 99.7± 0.2 99.3± 0.6 100.0± 0.0 24 B 10I, 20IT, 33I, 35D, 36I, 41KR, 43T,54V,
60EQ, 62V, 63P, 64IL, 66F, 71V,73A,82AT, 84V, 89V,90M
41L,67N,69D,70R,74I, 118I, 179I,184V,188L,190A,215F, 219Q 99.7± 0.1 99.9± 0.1 99.3± 0.6 100.0± 0.0
25–2000 CRF24_BG 20I, 35D, 36IV, 38IL, 41K, 69K,82I, 89M 98S 98.8±
0.4 99.4± 0.4 98.5± 1.3 100.0± 0 25–1000 CRF24_BG 20I, 35D, 36I, 41K, 69K, 70KR,82I, 89M 68NS, 98S 99.2±
0.2 99.1± 0.2 98.5± 1.3 100.0± 0
25–500 CRF24_BG 20I, 35D, 36I, 41K, 69K,82I, 89M 98S 98.7±
0.3 99.6± 0.2 100.0± 0 100.0± 0
Number of replicates for each sample is 3, except for specimen 21, for which only 2 replicates could be generated. Specimen identity (ID) 25–2000, 25–1000 and 25–500: serial dilutions of sample 25 until a theoretical viral load of respectively 2,000, 1,000 and 500 RNA copies/mL. AA amino acid; NT nucleotide; (S)DR(pos.) (surveillance) drug resistance (positions); SD standard deviation; PR protease; RT reverse transcriptase.
aAA changes at DR pos. using HXB2 (GenBank accession number K03455) as a reference sequence. Bold: SDR pos., underlined: discordant between
the 3 (or 2) replicates.
Applicability of the test in routine clinical practice
To assess the amplification success rate, results obtained during routine clinical practice for 380 clinical samples from 352 different patients were evaluated. At first, the amplification was successful for 84% of the samples (321/380). For the 59 samples that could not be amplified in the first attempt, a second RNA aliquot from the same extraction was again subjected to the in-house amplification procedure and with this strategy another 19 samples could be amplified. Subsequently, for twenty of the samples that failed again in the amplification procedure and for which enough plasma was still available, a second extraction and amplification round was at-tempted. An additional 5 samples could be amplified, resulting into an overall amplification success rate of 91% (345/380).
Sequencing results covering 1,302 nucleotides (amino acids 1 in PR to 335 in RT), could be obtained for all amplified reactions (345/345). However, 3 sequences were rejected as quality control analysis suggested APOBEC editing, resulting in an overall sequencing success rate of 99% (342/345).
Phylogenetic analysis revealed that the subtype distribution among the 345 obtained se-quences were 34.9% subtype B, 12.8% CRF19_cpx, 10.2% CRF20_BG, 9.0% CRF18_cpx, 9.0% URF, 7.8% subtype C, 7.0% CRF24_BG, 3.2% subtype G, 3.2% CRF23_BG, 0.9% subtype H, 0.6% subtype A, 0.6% subtype F, 0.6% CRF02_AG, 0.3% subtype J and 0.3% CRF31_BC.
An estimate of the cost of reagents and disposables was made. The overall cost per sample
using this procedure was around€80 per single genotyping attempt and increased to€100 per
successful genotype in our local testing scheme after initial amplification failure, which is still only half as expensive as the ViroSeq system. The working time cost and necessary equipment, such as pipettes, centrifuges, thermal cyclers, electrophoresis unit and automatic sequencer were excluded from these calculations.
Sample mix-up or cross-contamination
The negative control added to each run was negative, suggesting the absence of cross-contami-nation and sample mix-up. In addition, none of the generated sequences revealed an unusual high number of mixed bases. Finally, a maximum likelihood tree was inferred using the
se-quences that passed the quality control assessment (S1 Fig.). Sequences generated from the
same sample or from the same patient, consistently clustered together with a high bootstrap support, indicating the absence of sample mix-up or cross-contamination during
sample processing.
Discussion
The objective of this study was to design and validate an in-house system that could be imple-mented in Cuba, a resource limited setting with an HIV-1 epidemic with various subtypes and CRFs. To validate the here designed in-house system, the performance characteristics of the test were evaluated, including the determination of the lower limit of amplification and the as-sessment of accuracy (trueness and precision). Finally, the applicability of the test was evaluat-ed in a clinical setting. Samples for validation experiments were carefully selectevaluat-ed, so that the overall subtype distribution of the panels reflected the diversity in the Cuban epidemic. In addi-tion, samples displaying a broad range of viral loads and complex drug resistance profiles were chosen when possible.
For HIV-1 genotypic drug resistance testing, no gold standard is available. Therefore, true-ness was assessed by comparing the in-house assay with the ViroSeq Genotyping System ver-sion 2.0. The use of this commercial test as a reference standard has been frequently described
ViroSeq has been approved for HIV-1 subtype B strains only, and difficulties with non-B
sub-types have been published earlier [33–35], other studies report that ViroSeq is also applicable
to various HIV-1 subtypes and recombinant strains [29,36–39].
The acceptance criteria defined in advance were met for all the evaluated performance char-acteristics, demonstrating a high degree of accuracy of the in-house assay. The in-house assay was able to amplify samples with low-level viremia, ranging from 84 to 529 RNA copies/mL. Although only a limited number of samples have been included in this analysis, it suggests that the lower limit of amplification is well below the threshold of 1,000 RNA copies/mL for the di-verse strains circulating in Cuba. The in-house assay showed very good agreement with Viro-Seq on NT level (98.7% ± 1.0) and minor differences were mainly caused by base mixtures. ViroSeq detected more base mixtures than the in-house assay, suggesting an increased sensitiv-ity of ViroSeq in detecting NT mixtures, which has previously been reported for another
in-house method by Saravanan et al. [31]. Little AA differences between the two methods were
ob-served at SDRM (3 of 602 or 0.5%) and DRM (13 of 1,244 or 1.0%) positions and were all caused by mixtures. The number of viral mixtures detected by the in-house method (6/13 at DRM and 2/3 at SDRM positions) was comparable with the number of mixtures detected by ViroSeq (7/13 at DRM and 1/3 at SDRM positions). Other published in-house assays show the
tendency of detecting less mixtures then the ViroSeq assay [27,28]. In only 2 of the 14 samples,
the drug resistance patterns for RT inhibitors slightly changed due to 2 DRM (RT 67N and RT 221Y) detected by ViroSeq, but not by the in-house method. For these samples, the viral load was close to the recommended amplification limit (1,413 and 1,660 copies/mL) of 1,000 RNA copies/mL. The ad hoc reviewing of electropherograms revealed that both discordances could be attributed to differences in editing strategies, as mutations were represented by a very small
secondary peak (<10%) [40]. In this analysis, trueness was assessed by comparing the results
of the in-house assay with only one sequence determination by ViroSeq. Therefore, it would be recommendable that the IPK could participate in an external quality assessment program in the future. In these programs, the true value is a consensus sequence that is derived from the re-sults of different labs contributing to the program, which increases the certainty about the pres-ence of a DRM. For this study, discordances between drug resistance patterns from ViroSeq and in-house were negligible, demonstrating the ability of the in-house method to detect clini-cally relevant mutations correctly. As a result, the in-house assay performed well in comparison with the reference standard ViroSeq.
A disadvantage of the in-house assay is that the risk for cross-contamination is higher than with ViroSeq, as it uses a nested PCR and no dUTP/UNG contamination control. This re-quired more attention to avoid cross-contamination and the introduction of stringent precau-tions and quality control, such as the inclusion of a negative control in every run. The negative results of the negative controls in each run, the good quality of the sequences, the high specific-ity of the in-house assay as here assessed, and the phylogenetic results indicate that cross-contamination or sample mix-up had not happened using the implemented laboratory procedures.
Furthermore, the intra- (repeatability) and inter-assay variability (reproducibility) were evaluated by generating different replicates per sample in the same run by the same technician and in different runs by different technicians respectively, both under similar assay conditions. Minimal differences were observed between resistance patterns of replicates of the same sample and NT sequence identities were excellent, even at viral loads below 1,000 RNA copies/mL. The good results for precision can be explained by the strict adherence to good laboratory prac-tices and is an indication for the robustness of the assay.
HIV-1 subtypes, there is still a need for improvement as 16% of the samples could not be ampli-fied in a single attempt. Although general guidelines for the pre-analytical steps and detailed standard operating procedures for the analytical steps do exist, deviations from these rules at some instances could not be excluded and could have contributed to the amplification failures. Furthermore, it is possible that low viral loads impacted the amplification success rate negatively. However, viral load tests are not systematically performed for all patients in Cuba, and if done, mostly not on the same isolation date as for genotyping, so viral load data were not avail-able. Additionally, primers were designed in a way that they bind to the diverse strains, but strain specific mismatches at the primer binding sites could not be investigated for the amplification failures as these patients had not been tested yet with alternative methodologies and no se-quences were yet available. Therefore, in future studies performance should be verified on a broad spectrum of samples with known viral load and quality indicators should be monitored regularly.
Of the samples for which an amplicon could be generated, 99% were sequenced successfully
using the in-house method. Generated sequences covered codons 1–99 of PR and 1–335 of RT,
which is more than the minimal region for which sequence information must be collected
ac-cording to the WHO guidelines [9].
The in-house test provided a more affordable alternative to commercial assays as cost for
re-agents and disposables was less than half that of the ViroSeq HIV-1 Genotyping System [31].
Expensive equipment not yet available at the IPK and necessary for HIV-1 genotyping, was purchased at the end of 2008 with the financial support of VLIR and Global Fund To Fight AIDS, Tuberculosis and Malaria. As these instruments were versatile, the investments did not only enable the implementation of HIV-1 drug resistance testing in Cuba but also contributed to the capacity building of the entire microbiology department. Although the financial burden of drug resistance testing is still substantially, the lower consumables costs of the in-house pro-cedure enabled the implementation of drug resistance testing in this resource-limited setting. After training of the personnel, the in-house assay was implemented gradually in 2009, initially using retrospective samples to corroborate the good functioning of the system. Later in 2009, the assay was introduced in routine clinical practice for HIV-1 patients attending the IPK and for whom a resistance test was required.
In conclusion, this study describes the design, evaluation and implementation of an accurate and affordable HIV-1 drug resistance assay that is applicable to various subtypes and CRFs in Cuba. The assay made the assessment of drug resistance against PR inhibitors and RT inhibi-tors possible for individual patient management as well as in surveillance studies. This is an im-portant weapon against the accumulation of drug resistance in HIV-1 patients failing antiviral therapy and the subsequent spread to newly infected patients.
Supporting Information
S1 Fig. Midpoint rooted maximum likelihood tree (1,000 bootstraps) of the sequences gen-erated for the performance evaluation of the in-house assay.Trueness-IH and-VS sequences generated with respectively the in-house and ViroSeq assay to evaluate trueness (green); PC Positive Control; Reprod-A, -B and -C Replicates generated to evaluate reproducibility (red); Repeat-A, -B and -C Replicates generated to evaluate repeatability (blue); The subtypes and CRF reference dataset (black). Branches whithout taxa represent sequences for the evaluation
of applicability. Only bootstrap values>70 are shown.
Acknowledgments
We acknowledge Pedro Ariel Martínez and Celia M. Limia León, for the revision of the manuscript.
Author Contributions
Conceived and designed the experiments: LV KVL. Performed the experiments: Y. Alemán VK LP AA CC Y. Soto Y. Schrooten. Analyzed the data: LV KVL. Wrote the paper: Y. Alemán LV KVL. Acquisition of data: Y. Alemán VK LP AA Y. Abrahantes CF JP CC Y. Soto. Revision and approval of the manuscript: Y. Alemán LV VK LP AA Y. Abrahantes CF JP CC Y. Soto Y. Schrooten AMV KVL.
References
1. Pérez J, Pérez D, Gonzalez I, Diaz Jidy M, Orta M, et al. (2004) Perspectives and practice in antiretrovi-ral treatment. Approaches to the management of HIV-AIDS in Cuba: case study. Geneva: WHO. Avail-able:http://www.who.int/hiv/pub/prev_care/en/cuba.pdf. Accessed 27 May 2014.
2. HHS Panel on Antiretroviral Guidelines for Adults and Adolescents (2014) Guidelines for the use of an-tiretroviral agents in HIV-1 infected adults and adolescents. Department of Health and Human Services. Available:http://aidsinfo.nih.gov/contentfiles/lvguidelines/adultandadolescentgl.pdf. Accessed 27 May 2014.
3. Bertagnolio S, De Luca A, Vitoria M, Essajee S, Penazzato M, et al. (2012) Determinants of HIV drug resistance and public health implications in low- and middle-income countries. Antivir Ther 17: 941–53. doi:10.3851/IMP2320PMID:22898622
4. Gupta RK, Hill A, Sawyer AW, Cozzi-Lepri A, von Wyl V, et al. (2009). Virological monitoring and resis-tance to first-line highly active antiretroviral therapy in adults infected with HIV-1 treated under WHO guidelines: a systematic review and meta-analysis. Lancet Infect Dis 9: 409–417. doi: 10.1016/S1473-3099(09)70136-7PMID:19555900
5. Vandamme AM, Camacho RJ, Ceccherini-Silberstein F, de Luca A, Palmisano L, et al. (2011) Europe-an recommendations for the clinical use of HIV drug resistEurope-ance testing: 2011 update. AIDS Rev 13: 77–108. PMID:21587341
6. Pérez L, Thomson MM, Bleda MJ, Aragones C, Gonzalez Z, et al. (2006) HIV type 1 molecular epidemi-ology in Cuba: high genetic diversity, frequent mosaicism, and recent expansion of BG intersubtype re-combinant forms. AIDS Res Hum Retroviruses 22: 724–33. PMID:16910827
7. Eshleman SH, Crutcher G, Petrauskene O, Kunstman K, Cunningham SP, et al. (2005) Sensitivity and specificity of the ViroSeq human immunodeficiency virus type 1 (HIV-1) Genotyping System for detec-tion of HIV-1 drug resistance mutadetec-tions by use of an ABI PRISM 3100 Genetic Analyzer. J Clin Micro-biol 43: 813–817. PMID:15695685
8. Maes B, Schrooten Y, Snoeck J, Derdelinckx I, Van Ranst M, et al. (2004) Performance of ViroSeq HIV-1 Genotyping System in routine practice at a Belgian clinical laboratory. J Virol Methods 119: 45–49. PMID:15109820
9. WHO (2010) WHO/HIVResNet HIV Drug Resistance Laboratory Strategy. Available:http://www.who. int/hiv/pub/drugresistance/hiv_reslab_strategy.pdf. Accessed 17 February 2014.
10. Vinken L, Megens S, Schrooten Y, Vandamme AM, Van Laethem K (2013) Evaluation of the automatic editing tool RECall for HIV-1 pol and v3 loop sequences. J Virol Methods 193: 135–139. doi:10.1016/j. jviromet.2013.05.017PMID:23748120
11. Jennings L, Van Deerlin VM, Gulley ML, College of American Pathologists Molecular Pathology Re-source Committee (2009) Recommendend principles and practices for validating clinical molecular pa-thology tests. Ach Pathol Lab Med 133: 743–755. doi:10.1043/1543-2165-133.5.743PMID:19415949 12. Chaturbhuj DN, Nirmalkar AP, Paranjape RS, Tripathy SP (2014) Evaluation of a cost effective
in-house method for HIV-1 drug resistance genotyping using plasma samples. Plos One 9: 1–8. 13. Clinical and Laboratory Standards Institute (CLSI) (2006) Genotyping for infectious diseaeses:
identifi-cation and characterization. Approved Guideline. Wayne (PA): Clinical and Laboratory Standards In-stitute. CLSI document MM10-A.
15. Parkin N, de Mendoza C, Schuurman R, Jennings C, Bremer J, et al. (2012) Evaluation of in-house genotyping assay performance using dried blood spot specimens in the global world health organiza-tion laboratory network. CID 54: S273–S279. doi:10.1093/cid/cir982PMID:22544187
16. Bennett E, Camacho RJ, Otelea D, Kuritzkes DR, Fleury H, et al. (2009) Drug resistance mutations for surveillance of transmitted HIV-1 drug-resistance: 2009 update. Plos One 4: 1–8.
17. Pineda-Peña AC, Faria NR, Imbrechts S, Libin P, Abecasis AB, et al. (2013) Automated subtyping of HIV-1 genetic sequences for clinical and surveillance purposes: performance evaluation of the new REGA version 3 and seven other tools. Infect genet Evol 19: 337–348. doi:10.1016/j.meegid.2013.04. 032PMID:23660484
18. Tamura K, Peterson D, Peterson N, Stecher G, Nei M, et al. (2011) MEGA5: molecular evolutionary ge-netics analysis using maximum likelihood, evolutionary distance, and maximum parsimony methods. Mol Biol Evol 28: 2731–9. doi:10.1093/molbev/msr121PMID:21546353
19. Lole KS, Bollinger RC, Paranjape RS, Gadkari D, Kulkarni SS, et al. (1999) Full-length human immuno-deficiency virus type 1 genomes from subtype C-infected seroconverters in India, with evidence of inter-subtype recombination. J Virol 73: 152–60. PMID:9847317
20. Lemey P, Derdelinckx I, Rambaut A, Van Laethem K, Dumont S, et al. (2005) Molecular footprint of drug-selective pressure in a human immunodeficiency virus transmission chain. J Virol 79: 11981–11989. PMID:16140774
21. Stamatakis A (2006) RAxML-VI-HPC: maximum likelihood-based phylogenetic analyses with thou-sands of taxa and mixed models. Bioinformatics 22: 2688–2690. PMID:16928733
22. Aitken SC, Kliphuis A, Wallis CL, Chu ML, Fillekes Q, et al. (2012) Development and evaluation of an assay for HIV-1 protease and reverse transcriptase drug resistance genotyping of all major group-M subtypes. J Clin Virol 54: 21–25. doi:10.1016/j.jcv.2012.01.010PMID:22306272
23. Aitken SC, Bronze M, Wallis CL, Stuyver L, Steegen K, et al. (2013) A pragmatic approach to HIV-1 drug resistance determination in resource-limited settings by use of a novel genotyping assay targeting the reverse transcriptase-encoding region only. J Clin Microbiol 51: 1757–1761. doi:10.1128/JCM. 00118-13PMID:23536405
24. Chaturbhuj DN, Deshmukh PS, Hingankar NK, Siddhaarth K, Deshpande SN, et al. (2013) Evaluations of an in-house drug resistance method for HIV-1 drug resistance using ViroSeq 2.0 Genotyping System as a gold standard. J Virol Methods 1: 87–92. doi:10.1016/j.jviromet.2013.01.001PMID:23353551 25. Chen JH, Wong KH, Chan K, Lam HY, Lee SS, et al. (2007) Evaluation of an in-house genotyping
resis-tance test for HIV-1 drug resisresis-tance interpretation and genotyping. J Clin Virol 39: 125–131. PMID: 17449318
26. Chen JH, Wong KH, Li PC, Chan KK, Lee MP, et al. (2012) In-house human immunodeficiency virus-1 genotype resistance testing to determine highly active antiretroviral therapy resistance mutations in Hong Kong. Hong Kong Med J 18: 20–24. PMID:22865218
27. Chew KK, Ng KY, Khong WX, Kaur P, Yap JK, et al. (2012) Clinical evaluation of an in-house human immunodeficiency virus genotyping assay for the detection of drug resistance mutations in HIV-1 in-fected patients in Singapore. Ann Acad Med Singapore 41: 553–558. PMID:23303111
28. Fokam J, Salpini R, Santoro MM, Cento V, D’Arrigo R, et al. (2011) Performance evaluation of an in-house human immunodeficiency virus type-1 protease-reverse transcriptase genotyping assay in Cam-eroon. Arch Virol 156: 1235–1243. doi:10.1007/s00705-011-0982-3PMID:21465085
29. Inzaule S, Yang C, Kasembeli A, Nafisa L, Okonji J, et al. (2013) Field evaluation of a broadly sensitive HIV-1 in-house genotyping assay for use with both plasma and dried blood spot specimens in a re-source-limited country. J Clin Microbiol 51: 529–539. doi:10.1128/JCM.02347-12PMID:23224100 30. Monleau M, Aghokeng AF, Eymard-Duvernay S, Dagnra A, Kania D, et al. (2014) Field evaluation of
dried blood spots for routine HIV-1 viral load and drug resistance monitoring in patients receiving antire-troviral therapy in Africa and Asia. J Clin Microbiol 52: 578–586. doi:10.1128/JCM.02860-13PMID: 24478491
31. Saravanan S., Vidya M., Balakrishnan P., Kumarasamy N., Solomon S.S., Solomon S., Kantor R., Kat-zenstein D., Ramratnam B. and Mayer K.H., 2009. Evaluation of two human immunodeficiency virus-1 genotyping systems: ViroSeq 2.0 and an in-house method. J Virol Methods 159: 211–6. doi:10.1016/j. jviromet.2009.03.021PMID:19490976
32. Wallis CL, Papathanasopoulos MA, Lakhi S, Karita E, Kamali A, et al. (2010) Affordable in-house antire-troviral drug resistance assay with good performance in non-subtype B HIV-1. J Virol Methods 163: 505–508. doi:10.1016/j.jviromet.2009.11.011PMID:19917318
34. Beddows S, Galpin S, Kazmi SH, Ashraf A, Johargy A, et al. (2003) Performance of two commercially available sequence-based HIV-1 genotyping systems for the detection of drug resistance against HIV type 1 group M subtypes. J Med Virol 70: 337–342. PMID:12766994
35. Thiam M, Diop-Ndiaye H, Kebe K, Vidal N, Diakhate-Lô R, et al. (2013) Performance of the ViroSeq HIV-1 Genotyping System v2.0 on HIV-1 strains circulating in Senegal. J Virol Methods 188: 97–103. doi:10.1016/j.jviromet.2012.11.044PMID:23266258
36. Bilé EC, Adjé-Touré C, Borget MY, Kalou M, Diomande F, et al. (2005) Performance of drug-resistance genotypic assays among HIV-1 infected patients with predominantly CRF02_AG strains of HIV-1 in Ab-idjan, Côte d’Ivoire. J Clin Virol 32: 60–66. PMID:15572008
37. Eshleman SH, Hackett J Jr, Swanson P, Cunningham SP, Drews B, et al. (2004) Performance of the Celera Diagnostic ViroSeq HIV-1 Genotyping System for sequence-based analysis of diverse human immunodeficiency virus type 1 strains. J Clin Microbiol 42: 2711–2717. PMID:15184457
38. Jagodzinkski LL, Cooley JD, Weber M, Michael N (2003) Performance characteristics of human immu-nodeficiency virus type 1 (HIV-1) genotyping systems in sequence-based analysis of subtypes other than HIV-1 subtype B. J Clin Microbiol 41: 998–1003. PMID:12624021
39. Mracna M, Becker-Pergola G, Dileanis J, Guay LA, Cunningham S, et al. (2001) Performance of Ap-plied Biosystems ViroSeq HIV-1 Genotyping System for sequence-based analysis of non-subtype B human immunodeficiency virus type 1 from Uganda. J Clin Microbiol 39: 4323–4327. PMID:11724839 40. Huang DD, Eshleman SH, Brambilla DJ, Palumbo PE, Bremer JW (2003) Evaluation of the editing