Improving TCP Throughput Using Modified Packet
Reordering Technique (MPRT) Over Manets
Prakash B. Khelage
Asst. Professor, Information Technology, UMIT, SNDT Women’s University,
Mumbai - 400049, India.
Dr. Uttam D. Kolekar
Principal
Smt. Indira Gandhi College of Engineering, Navi Mumbai - 400709, India.
Abstract—at the beginning of development of network technology TCP transport agent were designed assuming that communication is using wired network, but recently there is huge demand and use of wireless networks for communication. Those TCP variants which are successful in wired networks are neither able to detect exact causes of packet losses nor unnecessary transmission delays over wireless networks. The biggest challenge over MANET is design of robust and reliable TCP variant which should give best performance in different network scenarios. Till date more than dozens of TCP variants designed and modified by researcher and scientist communities even though the level of TCP performance have to be optimum in different scenarios, Such as congestion, link failure, signal loss and interferences. Over rod, grid and bulk network model also. As some of TCP-variant performs well in particular network scenarios but degrades in other scenarios. The objective of this research work, to modify packet reordering technique based TCP variant, implement and compare its performance with other variants. Validation of basic and main network model done using network simulator (NS2) and calculated throughput, delay and packet drop by processing trace files. The simulated result shows that, proposed technique performs outstanding almost in all network scenarios with minimum packet losses and minimum delay.
Keywords—TCP; MANET; RTT; RTO; Congestion; Network validation model
I. INTRODUCTION
Instrumental in developing today’s Internet. In particular, TCP has been successful due to its robustness in reacting dynamically to changing network traffic conditions and providing reliability on an end-to-end basis [4]. This Wide acceptance has driven the development of many TCP applications [2] [8], motivating the extension of this protocol to wireless networks. These networks pose some critical challenges to TCP since it was not originally designed to work in such complex Environments, where the level of bit error rate (BER) is not negligible due to the physical medium. High mobility may further degrade the end-to-end performance because TCP reduces its transmission rate whenever it perceives a dropped packet. Mobile ad hoc network is a collection of mobile nodes that offers different opportunities to TCP [6]. Reduction in deployment cost due to absence of fixed infrastructure and elimination of administration cost since it is self-configurable. However, MANET consists of unstable wireless communication links in compare to the wired network [7]. This instability is mainly due to mobility of nodes. Because TCP is originally invented for wired network, it ignores non-congestion loss
which occurs rarely in this environment. Thus, TCP in present form cannot address frequent link breakage in MANET and suffers from performance degradation [4]. TCP is responsible for providing reliability of connection by retransmitting lost packet. Congestion control is the most controversial parts of TCP which degrades performance in front of packet loss. Congestion control as its name appears, assumes all packet loss induced by congestion When link failure lasts greater than RTO (Retransmission timeout) [5].
Retransmission timer expires and TCP interprets packet loss as a congestion loss. Then congestion control executes back-off algorithm to grow RTO exponentially and retransmit packet [3]. After a few successive back-off executions, RTO becomes too long. Hence when route recovered, sender resumes data transmission with long RTO which forces sender remains idle unnecessary in case of probable next losses[10]. Thus, packet loss classification helps TCP to identify link failure loss from congestion loss and consequently triggers appropriate reaction instead of invoking congestion control [4]. Link failure needs TCP to explore how much new route is congested in compare to the broken one. Traffic characteristics can affect queuing delay and processing delay of intermediate nodes that consequently influences Round Trip Time (RTT). If discovered route suffers heavier traffic than old one, retransmission timer must wait more to receive acknowledgment and RTO should be increased [6].
This paper presents the description and implementation of RTT based proposal TCP-MPR variant, Attached as transport agent and validated, calculated performance parameters in different networks model. The rest of the paper is organized as follows. Section 2 gives brief explanations, main concept of MPRT and its implementation. In Section 3 presents in brief about tools, techniques and research methodology. Section 4 and 5 describes different validation network models to be validated for accurate performance measures and finally paper concludes with conclusion and future work in section 6.
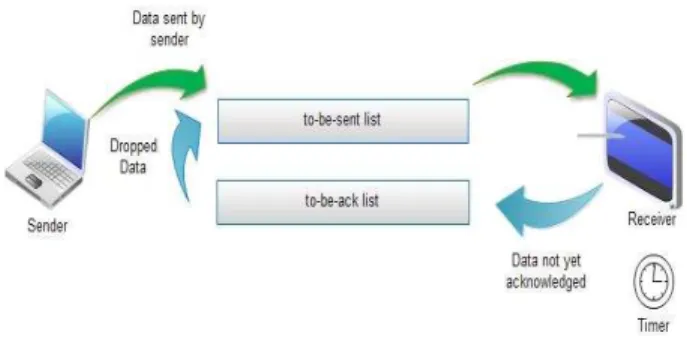
receiver, it is removed from the to-be-ack list (under cumulative ACKs, many packets will be simultaneously removed from to-be-ack). Alternatively, when it is detected that a packet was dropped, it is moved from the ack list back into the to-be-sent list. Drops are always detected through timers. To this effect, whenever a packet is sent to the receiver and placed in the to-be-ack list, a timestamp is saved. When a packet remains in the to-be-ack list more than a certain amount of time it is assumed dropped. In particular, it assumed that a packet was dropped at time when exceeds the packet’s timestamp in the to-be-ack list plus an estimated maximum possible round-trip time mxrtt.
As data packets are sent and ACKs received, the estimate mxrtt of the maximum possible round-trip time is continuously updated.
Fig. 1. Conceptual diagram for modified packet reordering (MPR)
Pseudo code for modified packet reordering (MPR) algorithm Initialization: 1) mode=slow-start 2) cwnd=1 3) memorize=0 4) alpha=0.99 5) beta=3.0 6) mxrtt=0 7) srtt=6.0
8) remove(to-be-ack , n) 9) add(to-be-sent , n)
10)if not is-in(memorize , n) then /*new drop*/ 11)memorize=to-be-ack
12)cwnd = cwnd(n)/2 13)else
14)remove(memorize , n)
New ack received:
15)if (cwnd < ssthresh) 16)/* Slow Start*/ 17)cwnd = cwnd + 1; 18)else
19)/* Congestion Avoidance */ 20)cwnd = cwnd + 1/cwnd
Timeout:
21)/* Multiplicative decrease */ 22)ssthresh = cwnd/2;
23)cwnd = 1;
III. RESEARCH METHODOLOGY
1) NS2 (Network simulator version 2)
NS2 is a discrete event simulator targeted at networking research. Ns provides substantial support for simulation of TCP, routing, and multicast protocols over wired and wireless (local and satellite) networks[12].It is primarily UNIX based. It uses TCL as its scripting language.
Fig. 2. NS2 Implementation
2) GNUPLOT
Gnu plot is a command-line program that can generate two- and three-dimensional plots of functions, data, and data files. It is frequently used for publication-quality graphics as well as education [8]. The program runs on all major computers and operating systems (GNU/Linux, Unix, Microsoft Windows, Mac OS X, and others). gnu plot can produce output directly on screen, or in many formats of graphics files, including Portable Network Graphics (PNG), Encapsulated PostScript (EPS), Scalable Vector Graphics (SVG), JPEG and many others. The program can be used both interactively and in batch mode using scripts. The program is well supported and documented.
3) AWK SCRIPTING LANGUAGE
The AWK utility is an interpreted programming language typically used as a data extraction and reporting tool. It is a standard feature of most Unix-like operating systems.AWK is a language for processing text files. A file is treated as a sequence of records, and by default each line is a record. Each line is broken up into a sequence of fields, so we can think of the first word in a line as the first field, the second word as the second field, and so on. An AWK program is of a sequence of pattern-action statements [8]. AWK reads the input a line at a time. A line is scanned for each pattern in the program, and for each pattern that matches, the associated action is executed.
4) EDRAW MAX
5) SIMULATION PARAMETERS VALUE
The required parameters value from table 1 is used to set up wireless mobile ad-hoc network for simulation and validating results for different TCP variants.
TABLE I.
Parameter Values
Channel Type Wireless channel
Radio Propagation Model Two Ray ground
Queue type Droptail/PriQue
Max. packet(buffer size) 50
Network interface Wirelessphy
MAC Protocol 802.11
Data Rate 1 Mbps
Transmission Radius 250
Interference Radius 550
Packet size 1000 bytes
Routing protocol AODV, DSDV
Simulation Time 150 s
Value x 700
Value y 500
Agent trace ON
Mac trace OFF
Router trace ON
Movement trace ON
IV. BASIC VALIDATION NETWORK MODEL
1) Congestion Network Model
This scenario create a congested node at the middle of a five-node topology by generating three TCP data traffic flows that must pass by this intermediate node to reach the other communicating end [8][9]. One should also note that, different levels of data congestion can be generated by controlling the number of TCP data flows crossing this particular network node at a certain time. Fig. 3 referred as congestion network model to validate and corresponding values noted in table 2.
2) Link failure Network Model
In this model it has been forced to TCP agent to change its communication path by shutting down one intermediate node between the communicating end points. In addition, it is implied routes with different number of hops. Thus, each time TCP changes the communication route, the characteristics of the path between the communicating nodes changes [9]. It is obvious that the choice and the establishment delay of the new route will be dependent on the implemented ad hoc routing protocol. Packet losses and delay changes will also be implied by the link loss and the new chosen route. It is noticed that the effect of such networks nodes’ mobility can be represented by the link failure scenario shown in fig. 4 as it is the most direct consequence of mobility, corresponding obtained parameters values depicted in table 3.
Fig. 3. Congestion Network Model [8]
TABLE II. VALUES OF CONGESTION NETWORK MODEL
Fig. 4. Link failure Network Model [8]
Variant Throughput Delay Drop Packet
TCP 371.54 491.632 600
Reno 371.25 482.392 572
Newreno 370.96 489.4 631
Westwood 371.70 506.764 594
WestwoodNR 371.70 456.783 562
Vegas 192.35 122.535 562
Sack 367.49 451.994 588
Fack 362.81 445.309 555
TABLE III. VALUES OF LINK FAILURE NETWORK MODEL
Variant Throughput Delay Drop
Packet
TCP 374.09 226.1 17
Reno 374.09 226.1 17
Newreno 374.09 226.1 17
Westwood 374.09 226.1 17
WestwoodNR 374.09 226.1 17
Vegas 193.36 39.093 1
Sack 374.09 226.1 17
Fack 374.09 226.1 17
MPR 374.68 62.824 2
3) signal loss Network Model
This scenario illustrates the situation where the wireless signal is not stable. The communicating nodes loose the connection due to signal loss and resume the communication when the signal comes back shown in fig. 5. Signal losses are generated by moving one of the intermediate nodes out of the radio range of its connection neighbors [8]. This scenario created using three nodes end node acts as sender and receiver and intermediate node as router Transmission of ftp traffic source flow through intermediate node. Intermediate node moves away for few second so signal loss occurs between source and destination, after few second intermediate node moves at original place and again retransmission starts. Table 4 contains values of different TCP variants validated in Signal Loss Network Model.
Fig. 5. Signal Loss Network Model [9]
TABLE IV. VALUES OF SIGNAL LOSS NETWORK MODEL
Variant Throughput Delay Drop
Packet
TCP 126.00 242.009 42
Reno 127.52 229.244 42
Newreno 48.99 242.241 27
Westwood 124.90 243.186 45
WestwoodNR 125.61 232.455 41
Vegas 93.94 55.8684 20
Sack 126.20 229.576 43
Fack 146.16 217.699 40
MPR 365.71 65.162 5
4) Interference Network Model
In this scenario, two TCP connections are established parallel indicated in fig. 6. The main TCP connection is disturbed by the interferences generated by the second TCP connection. Indeed, the node acting as forwarder for the main TCP connection is placed within the interference range of the second TCP connection sender. So, this situation creates interference and thus data packet losses.
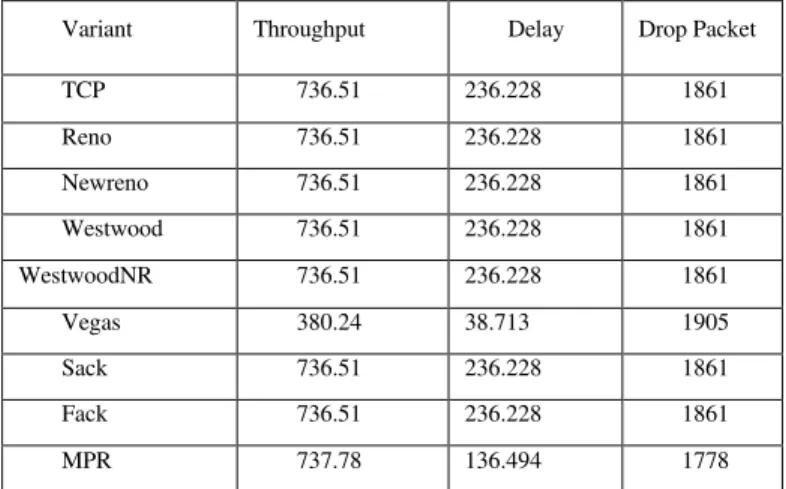
Interference scenario in wireless environment created using two traffic sources Transmission of second traffic source will interfere to the first traffic source [8]. Referring with the obtained values from table 5 it is found that, TCP MRP gives improved throughput, reduced delay and drop packets compared with other TCP- variants.
TABLE V. VALUES OF INTERFERENCE NETWORK MODEL
Variant Throughput Delay Drop Packet
TCP 736.51 236.228 1861
Reno 736.51 236.228 1861
Newreno 736.51 236.228 1861
Westwood 736.51 236.228 1861
WestwoodNR 736.51 236.228 1861
Vegas 380.24 38.713 1905
Sack 736.51 236.228 1861
Fack 736.51 236.228 1861
MPR 737.78 136.494 1778
V. MAIN VALIDATION NETWORK MODEL
1) Chain multi-hop Network Model
There is only one route to travel from one node to another. So communication became faster between two nodes. It is very easy to implement. The network consists of variable length chain of static nodes, placed at a distance of 200m from one another. FTP traffic is transferred between the first and last node of the chain [9][11]. During the simulation we will keep one FTP connection active at a time. Sequential TCP connection are initiated and terminated.
The solid-line circle denotes a node’s valid transmission range. The dotted-line circle denotes a node’s interference range. Node 4’s transmission will interfere with node 1’s transmissions to node 2.In this scenario also TCP-MPR gives maximum throughput with minimum packet loss and delays comparatively. Fig. 8 shows a static grid network as experiment topology with 4X4 nodes. The distance between two adjacent nodes is set to be 200 m, and the transmission and interference radii are set to 250 and 550 m, respectively. In a regular grid topology, each node in the network is connected with two neighbors along one or more dimensions. If the network is one-dimensional, and the chain of nodes is connected to form a circular loop, the resulting topology is known as a ring. Network systems such as FDDI use two counter-rotating token-passing rings to achieve high reliability and performance [8].
Fig. 7. Chain multi-hop Network Model [9]
TABLE VI. VALUES OF CHAIN MULTI-HOP NETWORK MODEL
Variant Throughput Delay Drop Packet
TCP 253.03 333.966 173
Reno 253.03 333.966 243
Newreno 253.03 333.966 243
Westwood 253.03 333.966 243
WestwoodNR 253.03 333.966 243
Vegas 130.86 57.637 149
Sack 253.03 333.966 243
Fack 253.03 333.966 243
MPR 253.60 135.096 173
2) Grid multi-hop Network Model
Fig. 8. Grid multi-hop Network Model [9]
In general, when an n-dimensional grid network is connected circularly in more than one dimension, the resulting network topology is a torus, and the network is called "toroidal". When the number of nodes along each dimension of a toroidal network is 2, the resulting network is called a hypercube [11]. The simulated results noted in table 7.
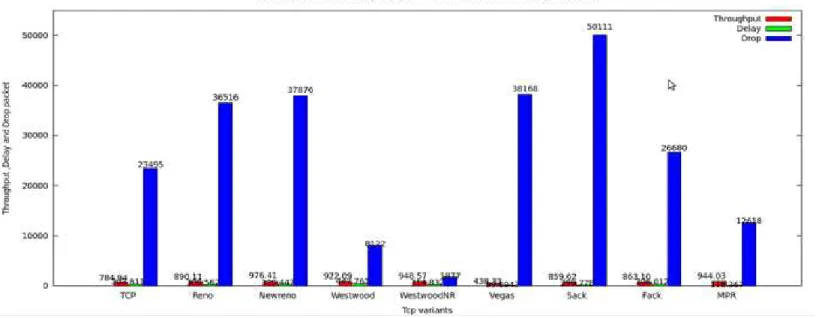
With reference to the graph shown in fig. 9 and corresponding histograms it is observed that, the proposed solution gives improved and optimal performance in all aspects.
TABLE VII. VALUES OF GRID MULTI-HOP NETWORK MODEL
Variant Throughput Delay Drop
Packet
TCP 488.35 1345.12 5 Reno 488.35 1345.12 5 Newreno 488.35 1345.12 5 Westwood 495.59 1339.02 12 WestwoodNR 478.16 1285.47 4
Vegas 222.78 171.355 0 Sack 497.10 1113.29 63 Fack 504.30 1350.66 14 MPR 617.56 588.534 2
Fig. 9. Graph for Grid multi-hop Network
Fig. 10. Histogram Plot for Congestion Network Model
Fig. 12. Histogram Plot for Signal loss Network Model
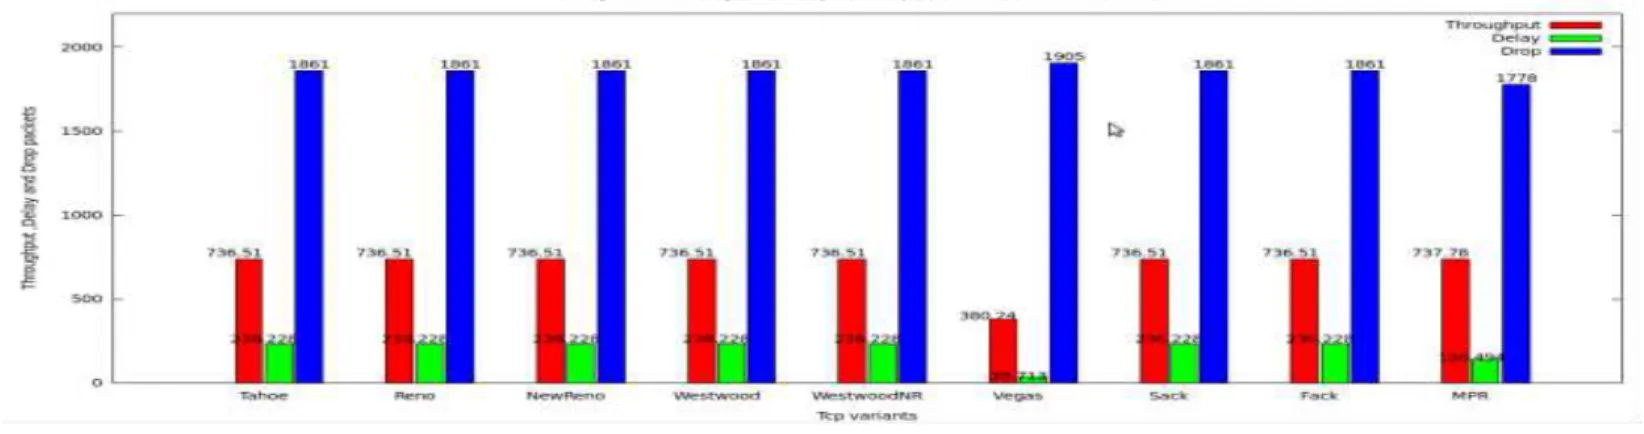
Fig. 13. Histogram Plot for Interference Network Model
Fig. 15. Histogram Plot for Grid multi-hop Network Model
VI. CONCLUSION AND FUTURE WORK
In this paper we successfully implemented our research proposal (TCP-MPRT) using ns2. The proposal tested and validated in different network model scenarios. We also investigate throughput, delay and packet drop using other TCP-variants in same scenario. Based upon processed results and analysis it shows that, TCP-MPR is giving highest throughput, minimum delay and packet drop compared to all variants. In future the proposal has to be tested and validated in bulk and complex networks with different speed of node mobility.
ACKNOWLEDGMENT
I am deeply thankful to my M. Tech. Mentor Dr. Vijay Raisinghani who has boosted moral, confidence and taught how to do research, my Dear Friend Prof. Sanjay Sange for motivation, helps for best quality work, constantly encouragement and support.
REFERENCES
[1] Ka-Cheong Leung, et al., “An Overview of Packet Reordering inTransmission Control Protocol (TCP):Problems, Solutions, and Challenges,” in IEEE transactions on parallel and distributed systems, vol. 18, no. 4, april 2007
[2] Ahmad Al Hanbali et al., ”A survey of TCP over Ad-hoc Networks,” IEEE Communications Surveys & Tutorials, Third Quarter 2005.
[3] Hanaa Torkey, Gamal Attiya and Ibrahim Z. Morsi, “Modified Fast Recovery Algorithm for Performance Enhancement of TCP-New Reno” International Journal of Computer Applications (0975 – 8887) Volume 40– No.12, February 2012.
[4] A. Seddik-Ghaleb, Y. Ghamri-Doudane, and S. M. Senouci, "TCP WELCOME TCP Variant for Wireless Environment, Link losses, and COngestion packet loss ModEls,” in First International Communication Systems and Networks and Workshops, COMSNETS 2009.
[5] P Bhaskar Sardar and Debashis Saha, "A Survey of TCP Enhancements for Last-Hop Wireless Networks" in IEEE Communications Surveys & Tutorials, 2006 3rd Quarter 2006,Volume 8, No 3.
[6] Haifa Touati, Ilhem Lengliz and Farouk Kamoun, “TCP Adaptive RTO to Improve TCP performance in mobile ad hoc networks,” in The Sixth Annual Mediterranean Ad Hoc Networking WorkShop, Corfu, Greece, June 12-15, 2007.
[7] H. M. El-Sayed, “Performance Evaluation of TCP in Mobile Ad-Hoc Networks,” in the Second International Conference on Innovations in Information Technology (IIT) 2005.
[8] Prakash B. Khelage, Uttam D. Kolekar, ” Survey and Simulation based Performance Analysis of TCP-Variants in terms of Throughput, Delay and drop Packets over MANETs” International Journal of Scientific and Engineering Research(775-786) Volume 5, Issue 1 January 2014. [9] Prakash B. Khelage, Uttam D. Kolekar,” TCP- Costco Reno: New Variant
by Improving Bandwidth Estimation to adapt over MANETs”International Journal of advanced computer science and applications Vol. 05, No. 02, February 2014.
[10] R. Oliveira and T. Braun, “A Dynamic Adaptive Acknowledgment Strategy for TCP over Multi-hop Wireless Networks,” Proc. IEEE INFOCOM, Mar. 2005.
[11] Z. Fu, P. Zerfos, H. Luo, S. Lu, L. Zhang, and M. Gerla, “The Impact of Multi-hop Wireless Channel on TCP Throughput and Loss,” Proc. INFOCOM ’03, Apr. 2003.
[12] Network Simulator Ns2, http://www.isi.edu/nsnam/ns.
AUTHORS PROFILE
Prakash B. Khelage received his B.E. in Electronics and Telecommunication Engineering from Dr. Babasaheb Ambedkar Marathwada University Aurangabad, M.Tech in information Technology from NMIMS University Mumbai, Maharastra, India. He is currently working as Assistant Professor with UMIT, SNDT Women’s University. He has 13 years of experience in industrial as well as educational field; His research interest includes Ad Hoc Networks, Mobile Computing, Wireless Networks, Co-operative Communication Networks and Network Security. He has also interest in Computer Architecture design, Cloud Computing and Data Mining. He has published 2 International journal papers.

![Fig. 5. Signal Loss Network Model [9]](https://thumb-eu.123doks.com/thumbv2/123dok_br/16372765.191227/4.918.74.435.102.372/fig-signal-loss-network-model.webp)