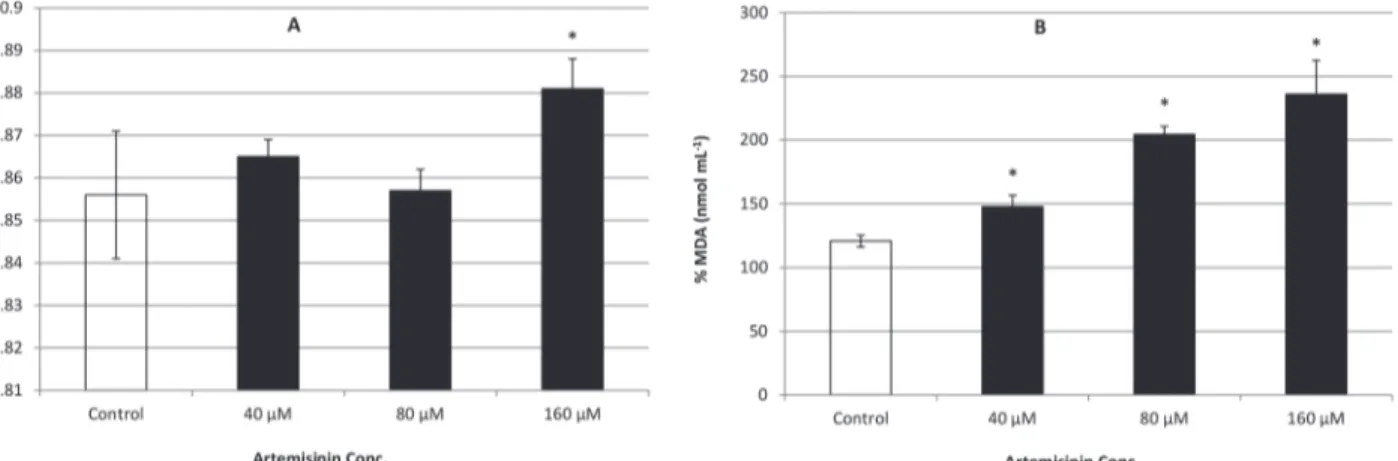
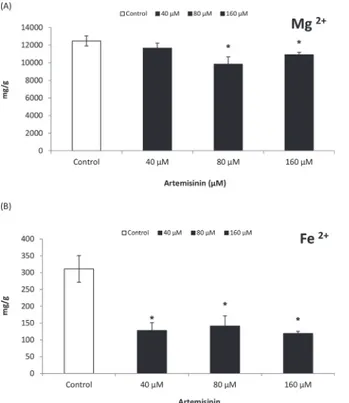
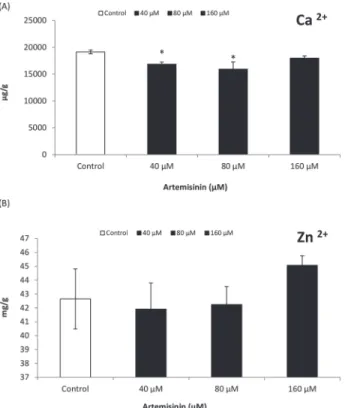
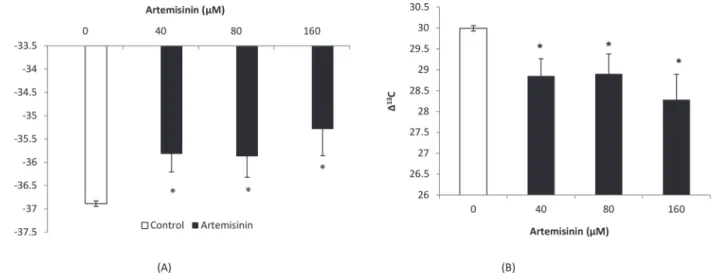
Characterization of xanthophyll pigments, photosynthetic performance, photon energy dissipation, reactive oxygen species generation and carbon isotope discrimination during artemisinin-induced stress in Arabidopsis thaliana.
Texto
Imagem
Documentos relacionados
Dessa forma, parto já do entendimento de que as experiências incorporadas pelos sujeitos no decorrer de suas vidas (socialização familiar, classe social,
Nesta investigação procuramos estudar a importância do apoio fornecido durante o estágio nas competências motivacionais (projeto profissional e motivação intrínseca) e
O simples enunciado do título Fantasia demonstra já claramente que a obra que o ostenta tem algo à margem de toda a constituição previamente estabelecida 18. A Fantasia é uma
Com os dados obtidos, bem como quantidade de hemoculturas realizadas, e total de amostras positivas e negativas, foi possível fazer um levantamento de
A comprehensive sleep history in patients suspected of OSA should include an evaluation for snoring, witnessed apneas (WA), gasping/chocking episodes, excessive
O objetivo geral deste estudo foi caracterizar o nível de equilíbrio de crianças e jovens com deficiência visual, nomeadamente com cegueira e baixa visão, e verificar o efeito,
Dessa forma, apesar de apenas 12 estudantes apresentarem respostas individuais com níveis cognitivos de alta ordem, pode-se inferir que, a partir do trabalho em grupo, houve a
A análise de variância (Anexo 4 / Tabela 3) indica que os sujeitos que receberam feedback positivo de alta credibilidade (4.3) estavam menos satisfeitos com os
