TESTING AND VALIDATION OF DRIS FOR
APPLE TREE
Gilmar Ribeiro Nachtigall1*; Antonio Roque Dechen2
1
Embrapa Uva e Vinho, C.P. 130 - 95700-000 - Bento Gonçalves, RS - Brasil. 2
USP/ESALQ - Depto. de Ciência do Solos, C.P. 9 - 13418-900 - Piracicaba, SP - Brasil. *Corresponding author <[email protected]>
ABSTRACT: To evaluate three procedures of the calculation of DRIS indices, as well as the efficiency of DRIS as a method for the interpretation of apple tree leaf analyses. This study uses data collected in apple producing areas of the Rio Grande do Sul and Santa Catarina States, Brazil. The concentrations of nitrogen, phosphorus, potassium, calcium, magnesium, boron, copper, iron, manganese, and zinc were determined in the leaf samples. The validation of the DRIS method used results of an experiment of potassium fertilization. The DRIS indices were calculated using two criteria for the choice of the ratio order of nutrients (F value – ratio of variance of the relationships among nutrients between the reference group and the low productivity group, and R value - correlation coefficients between the productivity and the relationship between pairs of nutrients) and three forms of calculation of nutrient functions (methods of Beaufils, Jones and Elwali & Gascho). The Nutritional Balance Index (NBI) presented negative correlation with the productivity in all combinations. The DRIS method described by Elwali & Gascho, using the F value, presented a performance similar to the criterion of sufficiency range, and it can be used for the interpretation of foliar analysis of apple trees, because it presents values of the nutritional balance index that indicates the nutritional status of the plants, and for the efficiency in the nutritional diagnosis of the crop.
Key words: Malus Domestica, foliar diagnosis, nutritional balance
CALIBRAÇÃO E VALIDAÇÃO DO DRIS
PARA MACIEIRA
RESUMO: Este trabalho teve por objetivo avaliar três procedimentos de cálculo dos índices DRIS, bem como avaliar a eficiência do DRIS como método de interpretação de resultados de análises de folhas de plantas de macieira. O estudo foi realizado nas regiões produtoras de maçã do Rio Grande do Sul e de Santa Catarina. Foram determinadas as concentrações de nitrogênio, fósforo, potássio, cálcio, magnésio, boro, cobre, ferro, manganês e zinco nas amostras de folhas. A validação do método DRIS utilizou resultados de um experimento de adubação potássica. Os índices DRIS foram calculados utilizandose dois critérios para a escolha da ordem da razão dos nutrientes (valor “F” -razão de variância das relações entre nutrientes entre o grupo de referência e de baixa produtividade e valor “R” - coeficientes de correlação entre os valores de produtividade e a relação entre os pares de nutrientes) e três formas de cálculo das funções dos nutrientes (métodos de Beaufils, Jones e Elwali & Gascho). O Índice de Balanço Nutricional (IBN) apresentou correlação negativa e significativa com a produtividade em todas as combinações de métodos testados. O método DRIS descrito por Elwali & Gascho, utilizando o “valor F”, apresentou desempenho semelhante ao critério de faixa de suficiência e pode ser utilizado para a interpretação da análise foliar em macieira, por apresentar valores de IBN que indicam o estado nutricional das plantas e pela eficiência no diagnóstico nutricional da cultura.
Palavras-chave: Malus Domestica, diagnose foliar, equilíbrio nutricional
INTRODUCTION
Foliar diagnosis, based on standardized meth-ods of sampling, is the most effective criterion in the evaluation of the nutritional status of fruitful plants (Faust, 1989). This methodology, however, presents
The Diagnosis and Recommendation Integrated System (DRIS) is a method of nutritional diagnosis of plants based on an index calculation for each nutrient, considering its relation with the other nutrients, and comparing each relation with average relations of a ref-erence population (Beaufils, 1971). The original equa-tion of Beaufils (1973) generates DRIS indices enhanc-ing the most deficient nutrients. From the methodol-ogy of Beaufils (1973), several modifications in the form of calculation of the DRIS indices were pro-posed. The equation of Jones (1981) is characterized by involving simpler calculations and it uses the re-verse of the standard deviation to consider the vari-ability of the relation. The equation of Elwali & Gascho (1984) consists of a modification of the method pro-posed by Beaufils (1973), in that a limit of tolerance is used to consider two balanced nutrients.
There are few studies with the DRIS method for the apple tree crop, although some results have been obtained in Canada (Parent & Granger, 1989), in Hun-gary (Szücs et al., 1990; Szücs & Kállay, 1990), in New Zealand (Goh & Malakouti, 1992), and in India (Singh et al., 2000). In all of these studies, DRIS was considered appropriate for the nutritional diagnosis of the crop. In Brazil, there are no studies on the use of this method for the nutritional diagnosis of the apple tree.
The aim of this study was to evaluate three calculation procedures of DRIS indices, as well as to verify the efficiency of DRIS as method to interpret results of leaf analyses of apple tree plants, in relation to the method of nutritional diagnosis, based on the criterion of sufficiency range, now used in South Bra-zil.
MATERIAL AND METHODS
The research was carried out in the apple pro-ducing area of Campos de Cima da Serra (28°30'S and 50°56'W); , in the Rio Grande do Sul State, and in the areas of Alto Vale do Rio do Peixe (27o
01’S and 50o55’W) and Planalto Serrano (28o17’S and 49o56’W), in the Santa Catarina State. The predomi-nant soils in these areas are the Humic Xanthic Hapludox and Tipic Hapumbrept. The methodology used for the collection of the samples, for the accom-plished analytical determinations and for the establish-ment of the DRIS norms for the apple tree crop is de-scribed in Nachtigall & Dechen (2007).
For the choice of the ratio order of nutrients two criteria were used, one called R value (Nick, 1998), and another called F value (Letzsch, 1985 and Walworth & Summer, 1987). The DRIS indices for the nutrients were calculated by the procedures
pro-posed by Beaufils (1973), Elwali & Gascho (1984) and Jones (1981), obtaining the DRIS index IA, for nutri-ent A in the following way:
m n
Σ
f (A/Bi) -Σ
f (Bj/A)IA = i = 1 j = 1 .
m + n
Beaufils (1973):
1 - a/b . 100 . k , for A/B < a/b A/B CV%
f (A/B) = 0, for A/B = a/b
A/B - 1 . 100 . k , for A/B > a/b a/b CV%
Elwali & Gascho (1984):
1 - a/b . 100 . k , for A/B < a/b - s
A/B CV%
f (A/B) = 0, for a/b - s ≤ A/B ≤ a/b + s
A/B - 1 . 100 . k , for A/B > a/b + s
a/b CV%
Jones (1981):
f (A/B) = (A/B) - a/b) k / s
where: A/B = relation between the concentration of the nutrient A and B in the sample; a/b = relation between the concentration of the nutrient A and B in the refer-ence population; CV% = coefficient of variation for the relation, %; s = standard deviation in the relation; k = constant of sensibility.
The Nutritional Balance Index (NBI) was ca1culated through the sum of the absolute values of the indices generated for the sample, obtained for each nutrient of each orchard, according to the equation:
NBI = |Index A| + |Index B| + .... + |Index N|
The Mean Nutritional Balance Index (NBIm) was also obtained through the sum of the absolute val-ues of the indices generated for each nutrient, calcu-lated for each sample, divided by the number of nu-trients that participate in the calculation, according to:
To evaluate the efficiency of the DRIS method in the nutritional diagnosis of the apple crop, the re-sults of a field experiment of of long duration were used, carried out in Vacaria RS (28o30’00"S and 50o
42’21"W and 955 m above sea level), on a Humic Xanthic Hapludox (Latossolo Bruno alumínico câmbico (Streck et al., 2002)), using virus free seedlings of the cultivar Gala grafted on MM 106 rootstock, in a spac-ing of 2.5 × 5.0 m. The treatments consisted of three levels of potassium fertilization before plantating (0 -50 - 100 kg ha-1 of K2O) and four levels of annual main-tenance potassium fertilization (0 - 50 - 100 - 150 kg ha-1
of K2O). The experimental design consisted of was the randomized blocks with four replicates. The ex-periment was maintained for 12 years (1990 to 2001). The diagnosis or evaluation of the foliar con-centration of nutrients for the apple tree crop was ac-complished using the Range of Nutrients Concentra-tion Criterion, adopted in Rio Grande do Sul and Santa Catarina States, Brazil, and by DRIS, through the three methods here presented. The consistence of the diag-nosis was tested through the comparison among these three diagnosis criteria. For the Range of Nutrients Concentration Criterion, only three categories were used (deficiencient, normal, and in excess). For the nutritional diagnosis using the DRIS method, the used methodology was that proposed by Wadt (1996), also useing three ranges, established from the DRIS index of the nutrient (INut.) and of the Mean Nutritional Bal-ance Index (NBIm), assuming:
Deficient = INut. < 0 and |INut.| > NBIm
Normal = |INut.| ≤ NBIm
In excess = INut. > 0 and |INut.| > NBIm
The calculations of the DRIS indices, NBI and NBIm were made through the software Microsoft ExcelTM. To evaluate the efficiency of the three meth-ods, considering the two criteria of for the choice of the ratio order of nutrients, NBI was related to the pro-ductivity of fruits and verified the significance of the correlation, using the “General Linear Models” (GLM) of the SAS statistical package (SAS Institute, 1985).
RESULTS AND DISCUSSION
The relations between NBI and the productiv-ity for the reference population and for the population of low productivity (Figure 1) indicate that the corre-lation coefficients obtained for the reference popula-tion were significant, while the relapopula-tionship was not significant for the population of low productivity. Con-sidering the whole population, the relationship is co-herent with the expected results (Sumner, 1977), with
the productivity varying from high to low for low val-ues of NBI, while high valval-ues of NBI occurred only in cases of low productivity.
The correlation coefficient between NBI and the productivity for the reference population, although statistically significant, were low, varying from 0.12 to 0.17. This behavior is probably related to the fact that in this type relation (NBI × production) partici-pated only plants of medium to high productivity. These plants should at first present nutritional balance, so that the variation of the productivity would be more dependent on other non nutritional factors. Relations between NBI and the productivity with accentuated dispersion of points, originating relatively low values of R2, were also obtained by Wadt et al. (1998) for eucalyptus and for Wadt et al. (1999) for coffee, in studies to generate the DRIS norms for these crops. In both cases, high values of NBI occurred only in cases of low productivity, a fact that was also observed for the apple tree crop.
Comparing the combinations of criteria of choice of ratio among nutrients (R value and F value) and of methods of calculation of the DRIS indices, it was observed that the best adjustments between NBI and productivity for the reference population were ob-tained by the method of Jones, using the F value and for the method of Elwali & Gascho, using the F and R values. Working with citrus in the State of São Paulo, Santos (1997) verified superiority of the method of Jones over the other. These results were also ob-served by Nick (1998) for the coffee plant and for Mourão Filho & Azevedo (2003) for the ‘Valency’orange tree. Regarding the criterion of the choice of ratio order among the nutrients, Nick (1998) and Mourão Filho et al. (2002) observed that the cri-terion of R was superior to F. There are no studies for the apple tree crop on the comparison of methods and of criteria of choice of ratio of nutrients. Singh et al. (2000) used for the evaluation of the DRIS method for apple trees in India, the method proposed by Beaufils (1973) and the criterion of the largest ratio among variances between the populations of low and high productivity (F value).
the largest productivities were related to the smallest values of NBI. For this situation, in which the pro-ductivity was influenced by the nutritional status of the plants, specifically for the potassium availability, the adjustment between NBI and the productivity presented much higher values of correlation coefficients than those obtained for the reference population, showing that the larger the nutritional unbalance of the plants (larger value of NBI) the lower is the productivity. A similar result was also obtained by Silva et al. (2003), when evaluating the use of DRIS to establish the nu-tritional status of the coffee plant in response to po-tassium fertilization.
Figure 1 - Relation between the values of Nutritional Balance Index (NBI) and the productivity (t ha-1) for combinations of methods of
ratio choice among nutrients (R value and F value) and DRIS indices (methods Beaufils, Jones and Elwali & Gascho) for the reference population and for the population of low productivity.
y = 64.59 - 0.17**x
R2 = 0.15
0 20 40 60 80 100 120
0 100 200 300 400 500
NBI Be u afils R
P
rod
uc
ti
o
n (
t ha
-1)
Re fe r e nce p o pu latio n L ow p ro du ctivity p op u lation
y = 63.11 - 0.13**x
R2 = 0.14
0 20 40 60 80 100 120
0 100 200 300 400 500 600
NBI Be uafils F
P
rod
uc
ti
o
n
(t
h
a
-1)
y = 63.19 - 0.23**x
R2 = 0 .12
0 20 40 60 80 100 120
0 50 1 00 150 200 2 50
NBI Jo ne s R
P
rod
u
c
ti
o
n (
t ha
-1)
y = 64.65 - 0.30**x
R2 = 0 .17
0 20 40 60 80 100 120
0 100 200 300 400
NBI Jo ne s F
P
r
od
uc
ti
o
n (
t
ha
-1)
y = 62.15 - 0.17**x
R2 = 0 .17
0 20 40 60 80 100 120
0 1 00 200 300 4 00 500
NBI Elw ali & Ga s ch o R
P
r
od
uc
ti
o
n (
t ha
-1)
y = 60.37 - 0.12**x
R2 = 0.17
0 20 40 60 80 100 120
0 10 0 200 300 400 500 6 00
NBI Elw ali & Gas ch o F
P
r
od
uc
ti
o
n (
t ha
-1)
For the diagnosis regarding K, the element that presented the largest variation among the results due to the applied rates, the accordance percentage in the nutritional diagnosis varied from 62% to 78% for the appraised models (Table 1). When all the nutrients were considered, the largest accordance number was observed when the method Elwali & Gascho was used, using the F criterion. In addition, the other methods presented low accordance with the criterion of suffi-ciency range for P, Ca and Zn. For P and Ca, the cri-terion of sufficiency range identified a larger number of deficient samples than the methods Beaufils and Jones, while for Zn these methods identified a larger
number of samples with excess, than the criterion of sufficiency range.
Comparing the mean results obtained by the two criteria of choice of the ratio order of nutrients (F and R values), it was verified that the largest ac-cordance percentage in the nutritional diagnosis of the apple tree (deficient, normal and in excess), between the criterion of sufficiency strip and the DRIS meth-ods, was obtained when the F criterion was used, in-dicating it as the most appropriate criterion for the crop. These results differ from the those obtained by Nick (1998) and Mourão Filho et al. (2002). They observed that the criterion of R was better than F.
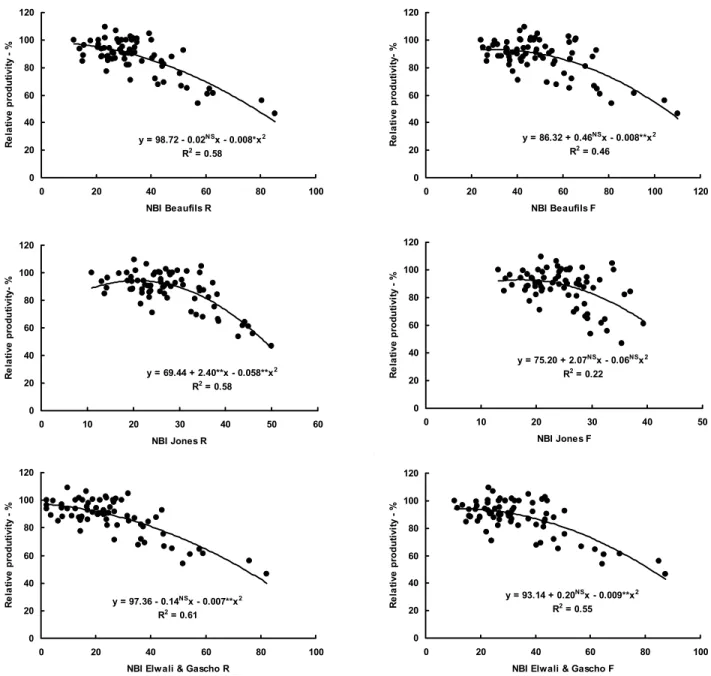
Figure 2 - Relation between the relative production of fruits of the apple tree cv. Gala and the Nutritional Balance Index (NBI) for combinations of methods of ratio order choice among nutrients (R value and F value) and DRIS indices (methods Beaufils, Jones and Elwali & Gascho), as a function of rates of potassium fertilizer. (Six years-old results)
y = 98.72 - 0.02NSx - 0.008*x2
R2 = 0.58
0 20 40 60 80 100 120
0 20 40 60 80 100
NBI Beaufils R
R e la tiv e p ro d u tiv it y %
y = 86.32 + 0.46NSx - 0.008**x2
R2 = 0.46
0 20 40 60 80 100 120
0 20 40 60 80 100 120
NBI Beaufils F
R e la ti v e p ro d u tiv it y - %
y = 69.44 + 2.40**x - 0.058**x2
R2 = 0.58
0 20 40 60 80 100 120
0 10 20 30 40 50 60
NBI Jones R
R e la ti v e p ro d u ti v ity - %
y = 75.20 + 2.07NSx - 0.06NSx2
R2 = 0.22
0 20 40 60 80 100 120
0 10 20 30 40 50
NBI Jones F
R e la tiv e p ro d u tiv it y %
y = 97.36 - 0.14NSx - 0.007**x2
R2 = 0.61
0 20 40 60 80 100 120
0 20 40 60 80 100
NBI Elwali & Gascho R
R e la tiv e p ro d u tiv it y %
y = 93.14 + 0.20NSx - 0.009**x2
R2 = 0.55
0 20 40 60 80 100 120
0 20 40 60 80 100
NBI Elwali & Gascho F
Table 1 - Accordance percentage in the nutritional diagnosis of the apple tree (deficient, normal and in excess) between the Range of Nutrients Concentration Criterion and the methods DRIS for combinations of criteria of choice of the ratio order among nutrients (R value and F value) and DRIS indices (methods Beaufils, Jones and Elwali & Gascho), as a function of rates of potassium fertilizer. (Six year-old results)
t n e i r t u
N Beaufils Jones Elwali&Gascho
R F R F R F
-%
-N 62.50 70.83 55.56 68.06 50.00 73.61
P 43.06 68.06 51.39 58.33 45.83 81.94
K 77.78 65.28 75.00 62.50 73.61 70.83
a
C 43.06 59.72 47.22 50.00 37.50 70.83
g
M 54.17 80.56 58.33 68.06 63.89 63.89
e
F 76.39 86.11 81.94 97.22 97.22 95.83
n
M 100.00 100.00 100.00 100.00 100.00 100.00
n
Z 19.44 0.00 8.33 8.33 38.89 94.44
u
C 77.78 81.94 83.33 54.17 91.67 93.06
B 83.33 87.50 83.33 84.72 80.56 81.94
e g a r e v
A 63.75 70.00 64.44 65.14 67.92 82.64
The method of Elwali & Gascho, using the F criterion is the most suitable for the apple tree crop, presenting values of NBI that indicate the nutritional status of the plants and for the efficiency in the nutri-tional diagnosis of the crop.
CONCLUSIONS
The Nutritional Balance Index (NBI), calculated from the generated norms, presented negative corre-lation with the productivity for all of the combinations of the tested methods. The DRIS method described by Elwali & Gascho, using the F value, presented simi-lar performance in relation to the criterion of suffi-ciency range. The DRIS method can be used for the interpretation of foliar analysis for the apple tree, for presenting values of NBI that indicate the nutritional status of the plants and for the efficiency in the nutri-tional diagnosis of the crop.
REFERENCES
BATAGLIA, O.C.; SANTOS, W.R.; QUAGGIO, J.A. Reference populations for evaluation of the nutritional status of coffee by DRIS. In: HORST, W.J.; SCHENK, M.K.; BÜRKERT, A.; CLAASSEN, N.; FLESSA, H.; FROMMER, W.B.; GOLDBACH, H.; OLFS, H.W.; RÖMHELD, V.; SATTELMACHER, B.; SCHMIDHALTER, U.; SCHUBERT, S.; WIRÉN, N.V.; WITTENMAYER L. (Ed.). Plant nutrition – Food security and sustainability of agro-ecosystems. Dordrecht: Kluwer Academic Publishers, 2001. p.728-729.
BEAUFILS, E.R. Physiological diagnosis - a guide for improving maize production based on principles developed for rubber trees.
Fertilizer Society of South African Journal, v.1, p.1-30, 1971.
BEAUFILS, E.R. Diagnosis and recommendation integrated system (DRIS). A general scheme for experimentation and calibration based on principles developed from research in plant nutrition. Pietermararitzburg: University of Natal, 1973. 132p. (Soil Science Bulletin, 1).
ELWALI, A.M.O.; GASCHO, G.J. Soil testing, foliar analysis, and DRIS as guide for sugarcane fertilization. Agronomy Journal,
v.76, p.466-470, 1984.
FAUST, M. Physiology of temperate zone fruit trees. New York: John Wiley. 1989. 338p.
GOH, K.M.; MALAKOUTI, M.J. Preliminary nitrogen, phosphorus, potassium, calcium and magnesium DRIS norms and indices for apple orchards in Canterbury, New Zealand. Communications in Soil Science and Plant Analysis, v.23, p.1371-1385, 1992. JONES, C.A. Proposed modifications of the diagnosis and recommendation integrated system (DRIS) for interpreting plant analysis. Communications in Soil Science and Plant Analysis, v.12, p.785-794, 1981.
LETZSCH, W.S. Computer program for selection of norms for use in the diagnosis and recommendation integrated system (DRIS).
Communications in Soil Science and Plant Analysis, v.16, p.339-347, 1985.
MOURÃO FILHO, F.A.A.; AZEVEDO, J.C. DRIS norms for ‘Valencia’ sweet orange on three rootstocks. Pesquisa Agropecuária Brasileira, v.38, p.85-93, 2003.
MOURÃO FILHO, F.A.A.; AZEVEDO, J.C.; NICK, J.A. Funções e ordem da razão dos nutrientes no estabelecimento de normas DRIS em laranjeiras ‘Valência’. Pesquisa Agropecuária Brasileira, v.37, p.185-192, 2002.
NACHTIGALL, G.R.; DECHEN, A.R. DRIS norms for evaluating the nutritional state of apple tree. Scientia Agricola, v.64, p.282-287, 2007.
NICK, J.A. DRIS para cafeeiros podados. Piracicaba: USP/ESALQ, 1998. 86p. (Dissertação - Mestrado).
PARENT, L.E.; GRANGER, R.L. Derivation of DRIS norms for a high density apple orchard established in the Quebec Appalachian mountains. Journal of the America Society for Horticultural Science, v.114, p.915-919, 1989.
SAS INSTITUTE. SAS User’s guide: statistics. 5 ed. Cary, N.C., 1985. 956p.
SILVA, E.B.; NOGUEIRA, F.D.; GUIMARÃES, P.T.G. Uso do DRIS na avaliação do estado nutricional do cafeeiro em resposta à adubação potássica. Revista Brasileira de Ciência do Solo,
v.27, p.247-255, 2003.
SINGH, N.P.; AWASTHI, R.P.; SUD, A. Diagnosis and recommendation integrated system (DRIS) norms for apple (Malus x Domestica Borkh. L. CV. Starking Delicious) in Himachal Pradesh. Indian Journal of Horticulture, v.57, p.196-204, 2000.
STRECK, E.V.; KÄMPF, N.; DALMOLIN, R.S.D.; KLAMT, E.; NASCIMENTO, P.C.; SCHNEIDER, P. Solos do Rio Grande do Sul. Porto Alegre: EMATER/RS; UFRGS, 2002. 107p. SUMMER, M.E. Use of the DRIS system in foliar diagnosis of
crops at high yield levels. Communications in Soil Science and Plant Analysis, v.8, p.251-268, 1977.
SZÜCS, E.; KÁLLAY, T. Determination of fruiting capacity of apple trees (Malus domestica) by DRIS. In: INTERNATIONAL PLANT NUTRITION COLLOQUIUM, 11., Wageningen, 1989.
Annals. Dordrecht: Kluwer Academic Publishers, 1990. p.717-721.
SZÜCS, E.; KÁLLAY, T.; SZENCI, G. Determination of DRIS indices for apple (Malus domestica Borkh). Acta Horticulturae,
n.274, p.443-453, 1990.
WADT, P.G.S. Os métodos da chance matemática e do sistema integrado de diagnose e recomendação (DRIS) na avaliação nutricional de plantios de eucalipto. Viçosa: UFV, 1996. 123p. (Tese - Doutorado).
WADT, P.G.S.; NOVAIS, R.F.; ALVAREZ VENEGAS, V.H.; FONSECA, S.; BARROS, N.F. Valores de referência para macronutrientes em eucalipto obtidos pelos métodos DRIS e chance matemática. Revista Brasileira de Ciência do Solo,
v.22, p.685-692, 1998.
WADT, P.G.S.; NOVAIS, R.F.; ALVAREZ VENEGAS, V.H.; BRAGANÇA, S.M. Alternativas de aplicação do “DRIS” à cultura de café conilon (Coffea canephora Pierre). Scientia Agricola,
v.56, p.83-92, 1999.
WALWORTH, J.L.; SUMMER, M.E. The diagnosis and recommendation integrated system (DRIS). Advances in Soil Science, v.6, p.149-188, 1987.