The Cryosphere, 5, 349–358, 2011 www.the-cryosphere.net/5/349/2011/ doi:10.5194/tc-5-349-2011
© Author(s) 2011. CC Attribution 3.0 License.
The Cryosphere
Multi-decadal mass loss of glaciers in the Everest area (Nepal
Himalaya) derived from stereo imagery
T. Bolch1,3, T. Pieczonka1, and D. I. Benn2,4
1Institut f¨ur Kartographie, Technische Universit¨at Dresden, Germany 2The University Centre in Svalbard, Norway
3Geographisches Institut, Universit¨at Z¨urich, Switzerland
4School of Geography and Geosciences, University of St Andrews, UK
Received: 1 December 2010 – Published in The Cryosphere Discuss.: 20 December 2010 Revised: 28 March 2011 – Accepted: 30 March 2011 – Published: 20 April 2011
Abstract.Mass loss of Himalayan glaciers has wide-ranging consequences such as changing runoff distribution, sea level rise and an increasing risk of glacial lake outburst floods (GLOFs). The assessment of the regional and global im-pact of glacier changes in the Himalaya is, however, ham-pered by a lack of mass balance data for most of the range. Multi-temporal digital terrain models (DTMs) allow glacier mass balance to be calculated. Here, we present a time series of mass changes for ten glaciers covering an area of about 50 km2 south and west of Mt. Everest, Nepal, using stereo Corona spy imagery (years 1962 and 1970), aerial images and recent high resolution satellite data (Cartosat-1). This is the longest time series of mass changes in the Himalaya. We reveal that the glaciers have been significantly losing mass since at least 1970, despite thick debris cover. The specific mass loss for 1970–2007 is 0.32±0.08 m w.e. a−1, however, not higher than the global average. Comparisons of the re-cent DTMs with earlier time periods indicate an accelerated mass loss. This is, however, hardly statistically significant due to high uncertainty, especially of the lower resolution ASTER DTM. The characteristics of surface lowering can be explained by spatial variations of glacier velocity, the thick-ness of the debris-cover, and ice melt due to exposed ice cliffs and ponds.
1 Introduction
Recent debate on whether Himalayan glaciers are shrinking faster than those in other parts of the world (Cogley et al., 2010) highlighted the lack of knowledge about the glaciers in this region. The best measure of glacier health is mass bal-ance, which can be directly linked to climate and compared
Correspondence to:T. Bolch (tobias.bolch@geo.uzh.ch)
to other regions. The topographic setting and the glacier hypsometry modify the way the climatic signal is translated into glacier mass balance, but this can calculated using a DTM (Paul and Haeberli, 2008). However, only a few in-situ mass balance measurements have been made on Himalayan glaciers, and existing data series are short (Kulkarni, 1992; Fujita et al., 2001; Wagnon et al., 2007; Dobhal et al., 2008). Comparisons of digital terrain models for different years can complement field measurements, and allow regional mass balance to be estimated (Bamber and Rivera, 2007). How-ever, to date it has only been applied to some glaciers in the western Himalaya for 1999 to 2004 (Berthier et al., 2007) and to four glaciers at Mt. Everest for 1962 to 2002 (Bolch et al., 2008b). Broader and more detailed knowledge of glacier mass balance is also needed to decrease the high uncertainty about the importance of Himalayan glaciers for water resources (e.g. Immerzeel et al., 2010) and sea level rise (e.g. Braithwaite and Raper, 2002). Finally, improved knowledge of glacier recession is needed to better estimate hazards of glacier lake outburst floods (GLOFs; Richardson and Reynolds, 2000).
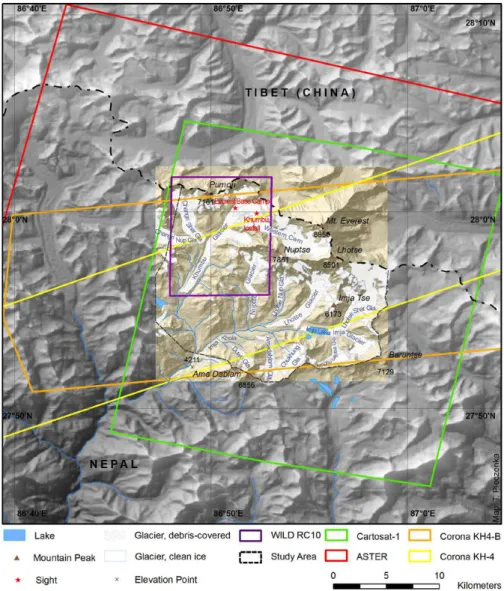
Fig. 1. Study area; location, names and debris-covered portion of the glaciers in the study area, coverage of the utilized satellite data. Background: SRTM3 CGIAR, Vers. 4, study area: ASTER DTM; glacier outlines based on Bolch et al. (2008b).
The tongues of nine of the ten studied glaciers are heav-ily covered by supraglacial debris (Fig. 1), with a debris area of about 36.3 km2 and an average debris thickness in-creasing downglacier (Nakawo et al., 1999; Hambrey et al., 2008). The glaciers are mainly nourished by snow and ice avalanches which accumulate cones below the steep head-walls. Only Khumbu Glacier has an extensive accumu-lation area (called “Western Cwm”). Glacier equilibrium line altitudes (ELAs) are roughly estimated to be situated above 5600 m (Asahi, 2001). Ice velocities typically de-crease downglacier from the ELA and most of the studied glaciers have extensive stagnant ice in their lower reaches (Bolch et al., 2008a; Scherler et al., 2008; Quincey et al., 2009). Between 1962 and 2005 the overall glacier area loss in the study area was∼5% with an increasing debris-covered area (∼2.5%) but almost stable terminus positions (Bolch et al., 2008b).
2 Data and methodology
T. Bolch et al.: Multi-decadal mass loss of glaciers in the Everest area (Nepal Himalaya) 351
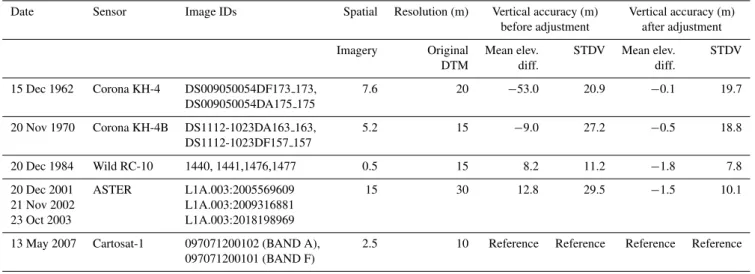
Table 1.Utilized imagery and derived DTM characteristics based on the ice free area relative to the 2007 master DTM.
Date Sensor Image IDs Spatial Resolution (m) Vertical accuracy (m) Vertical accuracy (m)
before adjustment after adjustment
Imagery Original Mean elev. STDV Mean elev. STDV
DTM diff. diff.
15 Dec 1962 Corona KH-4 DS009050054DF173 173, 7.6 20 −53.0 20.9 −0.1 19.7
DS009050054DA175 175
20 Nov 1970 Corona KH-4B DS1112-1023DA163 163, 5.2 15 −9.0 27.2 −0.5 18.8
DS1112-1023DF157 157
20 Dec 1984 Wild RC-10 1440, 1441,1476,1477 0.5 15 8.2 11.2 −1.8 7.8
20 Dec 2001 ASTER L1A.003:2005569609 15 30 12.8 29.5 −1.5 10.1
21 Nov 2002 L1A.003:2009316881
23 Oct 2003 L1A.003:2018198969
13 May 2007 Cartosat-1 097071200102 (BAND A), 2.5 10 Reference Reference Reference Reference
097071200101 (BAND F)
Fig. 2.Elevation difference of 1970 Corona and 2007 Cartosat DTM before (left) and after adjustment (right).
Graz (RSG, http://dib.joanneum.at/rsg/) 6.13 for processing Corona, PCI Geomatica OrthoEngine 10.2 for Cartosat, and Leica Photogrammetry Suite (LPS) 9.1 for the aerial images. We used 14 non-differential GPS points acquired in 2006 and 2008 and∼200 points from the National Geographic 1:50k topographic map (Altherr and Gr¨un, 1990) as ground con-trol points (GCPs). The GPS points were mostly measured along the main trekking routes within a height range between 3900 m and 5600 m. Their horizontal accuracy is about 7.9 m and their vertical accuracy in comparison to topographic map height points is about 20.6 m. The GCPs based on the map are almost randomly distributed in accordance with the
un-systematic distribution of significant peaks and other geo-morphological forms marked as height points. In addition, these points represent different slope angles and aspects well (Pieczonka et al., 2011). The RMSEz and RSMEx,y of the
Fig. 3.DTM differences of the study area 1970–2007 and 2002–2007.
In order to measure glacier elevation changes as precisely as possible it is recommended to adjust the DTMs relative to each other (Nuth and K¨a¨ab, 2011). Tilts which occurred especially in the Corona DTM were corrected using trend surfaces calculated based on stable non-glacierised areas of the DTMs (Fig. 2, Pieczonka et al., 2011). We observed slight horizontal shifts of the generated DTMs although we used the same GCPs for all images whenever possible. In order to avoid biases introduced thereby and to improve the z-accuracy, we choose the Cartosat-1 DTM as the master ref-erence as it has a high spatial resolution and showed the low-est mean elevation difference (5.9 m) and standard deviation (18.3 m) relative to the SRTM3 DTM. We co-registered the other DTMs to it by minimizing the standard deviation of the elevation differences (Berthier et al., 2007). The applied shifts varied between 5 and 30 m. Altitudinal differences which exceeded±100 m (usually around data gaps and near DTM edges) were omitted assuming that these values repre-sent outliers. Similar assumptions were made by Berthier et al. (2010). We resampled all DTMs bilinearly to the pixel size of the coarsest DTM (30 m) in order to reduce the effect of different resolutions.
The relative uncertainties of the DTMs prior to and after the adjustments were calculated based on the ice free terrain relative to the 2007 master DTM. The mean difference be-tween the final adjusted DTMs was in the range −0.1 to −1.8 m while the RMSEz was 7.8 to 19.8 m (Table 1). To
address the uncertainty of the elevation differences of the glacierised areas we calculated statistical parameters for the differences of ice covered and the non-ice covered areas sep-arately (Table 2). The standard deviation of the non glacier area (STDVnoglac)or the RSMEzcan be used as a first
esti-mate of the uncertainty, but would probably overestiesti-mate it as it does not account for the reduction of the error due to averaging over larger regions (Berthier et al., 2007, 2010). Another suitable measure for the uncertainty is the standard error of the mean (SE) defined as
SE=STDVno glac√
n (1)
whilenis the number of the included pixels. We choose a decorrelation length of 600 m for the ASTER DTMs with an effective spatial resolution of 30 m and a length of 400 m for all other higher resolution DTMs to minimize the effect of auto-correlation. These numbers are slightly more conserva-tive than the average value of 500 m utilized by Berthier at el. (2010) for DTMs with coarser resolution (mostly 40 m). Koblet et al. (2010) suggested a decorrelation length of 100 m for DTMs based on aerial images of a spatial reso-lution of 5 m.
We used the standard error (SE) and the mean elevation difference (MED) of the non glacier area (Table 2) as an estimate of the uncertainty according to the law of error propagation:
e= q
SE2+MED2 (2)
T. Bolch et al.: Multi-decadal mass loss of glaciers in the Everest area (Nepal Himalaya) 353
Table 2.Statistics of the DTM differences for the investigated periods.
Period DTM DTM Mean elev. STDV Mean elev. STDV N SE coverage coverage diff. no glac. diff. glac. glac. no glac. no glac. study area glac. no glac.
(km2) (km2) (m) (m) (m) (m) (m) 1962–1970 137.8 25.4 −0.9 22.3 −1.9 15.7 319 1.3 1970–1984 83.8 24.4 −3.6 26.3 −9.9 16.1 163 2.1 1984–2002 83.4 25.7 −2.2 26.5 −5.4 18.2 107 2.6 2002–2007 174.5 59.8 +2.2 22.8 −3.2 13.5 214 1.6 1984–2007 80.6 20.9 +2.4 15.8 −9.2 15.4 109 1.5 1970–2007 152.9 46.5 +2.2 19.4 −13.2 15.6 293 1.1
glac.: glacier area, no glac.: non glacier area,N: number of considered pixels.
Table 3.Glacier volume loss and mass balance 1970–2007, and 2002–2007.
Period 1970–2007 Period 2002–2007
Glacier Glacier Glacier area Average Specific Glacier area Average Specific Size covered elev. mass covered elev. mass by DTM diff. balance Diff. by DTM balance (km2) (km2) (m) (m w.e. a−1) (km2) (m) (m w.e. a−1)
Changri Shar/Nup 13.0 6.85 −11.6±2.5 −0.28±0.08 6.93 −1.6±2.7 −0.29±0.52 Khumbu accumulation area1 6.2 4.3 −6.2±2.5 4.66 +1.2±2.7
Khumbu ablation area1 10.8 10.0 −13.9±2.5 10.1 −4.0±2.7
Whole Khumbu 17 14.26 −11.1±2.5 −0.27±0.08 14.7 −2.5±2.7 −0.45±0.52 Nuptse 4.0 3.45 −9.4±2.5 −0.25±0.08 3.52 −2.2±2.7 −0.40±0.53 Lhotse Nup 1.95 1.86 −7.6±2.5 −0.18±0.07 1.86 −5.7±2.7 −1.03±0.51 Lhotse 6.5 6.71 −10.7±2.5 −0.26±0.08 6.71 −6.1±2.7 −1.10±0.52 Lhotse Shar/Imja2 10.7 8.65 −20.6±2.5 −0.50±0.09 8.87 −8.1±2.7 −1.45±0.52 Amphu Laptse 1.5 1.05 −10.0±2.5 −0.24±0.08 1.08 −4.3±2.7 −0.77±0.52 Chukhung 3.8 1.88 −5.3±2.5 −0.30±0.08 3.2 +0.2±2.7 +0.04±0.54 Amadablam 2.2 1.86 −12.0±2.5 −0.29±0.08 2.5 −3.1±2.7 −0.56±0.52 Duwo 1.0 0.37 −12.2±2.5 −0.30±0.08 0.37 −10.9±2.7 −1.96±0.53
Sum/Average 61.7 46.9 −13.3±2.5 −0.32±0.08 49.6 −4.4±2.7 −0.79±0.52
1We assumed an ELA of 5700 m based on Ashai (2001) and interpretation of the satellite images. 2For the year 2007, the estimated volume of Imja lake (37.8
×106m3, calculated based on the area extent 0.91 km2and the average depth of 41.4 m) was added to the elevation difference of 1970–2007. For 2002–2007 we added the volume difference between 2007 and 2002 (2.0×10⁶m3). Data is based on Fujita et al. (2009).
areas using a spline algorithm. We did not fill the larger data gaps e.g. on steep slopes. The glacier tongues, the avalanche cones, and Western Cwm are represented in the DTMs of 1970, 2002, and 2007 (Fig. 3, Tables 3, 4) which allow es-timation of the mass balance for the entire glacier. Only Changri Nup, Duwo, and the debris-free Chukhung Glacier have larger data gaps. Detailed investigations on Khumbu Glacier are limited to the tongue below∼5700 m (mainly the ablation area) due to the small coverage of the aerial images.
3 Volume changes and mass losses
3.1 Periods 1970–2007 and 2002–2007 for the whole
study area
Fig. 4.DTM differences on Khumbu Glacier for different times.
mass balance of−0.32±0.08 m w.e. a−1between 1970 and 2007 (Table 3). The surface lowering for the debris-covered parts only is−0.39±0.07 m a−1, clearly showing that signif-icant thickness loss occurs despite thick debris cover. Most glaciers also experienced surface lowering between 2002 and 2007 (Fig. 3, Table 3). The specific mass balance of all 10 glaciers has possibly doubled compared to 1970–2007 (−0.79±0.52 m w.e. a−1). However, the uncertainty is high.
3.2 Detailed multi-temporal investigations on Khumbu
Glacier
The surface of the ablation area of Khumbu Glacier lowered in all investigated time periods (Table 3). DTM differenc-ing (Figs. 3 and 4) and longitudinal profiles, in particular for 1970–2007, show almost no surface lowering in the clean ice zone below Khumbu Icefall (Figs. 5 and 6, section A); an increasing downwasting in the debris-covered part, with the highest lowering between 2 and 8 km from the terminus (B,
Table 4. Volume loss of the ablation area of Khumbu Glacier 1962–2007.
Time DTM coverage Average down- Downwasting rate
(km2) wasting (m) (m a−1)
1962–1970 4.9 −2.74±1.54 −0.34±0.19
1970–1984 9.9 −2.53±4.16 −0.18±0.29
1984–2002 9.8 −6.72±2.78 −0.37±0.16
2002–2007 10.0 −3.95±2.68 −0.79±0.52
1984–2007 9.8 −13.00±2.84 −0.56±0.13
T. Bolch et al.: Multi-decadal mass loss of glaciers in the Everest area (Nepal Himalaya) 355
Fig. 5. (A): Khumbu Glacier based on the 2007 Cartosat-1 image including the profile and the different sections of surface lowering (see Fig. 6A).(B, C): Terminus of Khumbu Glacier based on the 1970 Corona KH-4B and on the 2007 Cartosat-1 image.
lowering (Table 4). However, these differences are statisti-cally not significant. Comparing the periods 1970–1984 and 1984–2007, however, shows an almost statistically signifi-cant increase in the surface lowering rate (0.18±0.29 m a−1 in comparison to 0.56±0.13 m a−1). The accumulation zone of Khumbu Glacier has possibly also thinned during the in-vestigated time, while there might be a slight thickening in recent time (2002–2007).
4 Discussion
Stereo capability, acquisition in the 1960s and 1970s and relatively high spatial resolution make Corona 4, KH-4A and B imagery a valuable source for geodetic mass bal-ance estimations. While the earlier KH-4 data were already found to be suitable for this task (Bolch et al., 2008b) we have shown that the later higher resolution KH-4 results in lower uncertainties. The accuracy and even distribution of the ground control points used for the rectification of the imagery are crucial for the resultant accuracy of the DTM. Hence, it could be expected that an even better accuracy than ours could be achieved if more precise GCPs are available. Other reconnaissance images such as Hexagon KH-9 from the 1970s and early 1980s are also suitable for this task if coverage with no clouds and little snow cover are available (Surazakov and Aizen, 2010). Surazakov and Aizen (2010) have shown a RSMEz for mountainous terrain of ∼20 m,
which is the same range as our results using KH-4B data despite lower resolution of the KH-9 data. Reseau marks on the KH-9 images facilitate minimizing the distortion. Corona and Hexagon data are also of high value for mapping glaciers and investigating area changes (Bhambri et al., 2011; Bolch et al., 2010; Narama et al., 2010). The generation of mass
Fig. 6. (A): Profiles of the DTM differences of Khumbu Glacier.
(B): Longitudinal profiles of the surface elevation of Khumbu Glacier 1970 and 2007. See Figs. 3 and 5 for the location of the profiles.
balance time series estimation of different data sets with dif-ferent resolution requires careful co-registration and adjust-ment. This is especially true for the 1984 DTM based on aerial imagery, highlighted by a clear positive-negative trend on hillslopes with opposing aspects for the periods 1970– 1984 and 1984–2002 (visible on the lower right of the im-ages on Fig. 4). However, a shifting to adjust this area would worsen the accuracy of the steep slope in the northern part of the DTM. Hence, the distortion of the 1984 DTM is more complex and could not be fully adjusted relative to the others. Although inaccuracies remain on steep slopes with all DTMs, most of the glacier area is not affected by these biases. The inclusion of the lower resolution 2002 ASTER DTM provides some insight in the recent volume loss of the glaciers. However, the volume change of the glaciers is too small for a significant signal to be detected. In addition, the large scatter in the volume change amongst the investigated glaciers needs further investigation.
and 1984, which can be attributed to the growth of a lake basin visible on the 1984 aerial photograph (Supplement, Fig. 4). Melting and calving around the margins of lakes is well known to produce locally high ablation rates (Sakai et al., 2000; Benn et al., 2001). Thickening occurred in this re-gion between 1984 and 2002, attributable to drainage of the lake reducing ablation and ice inflow from upglacier.
The utilized imagery also allows length changes of the glaciers to be examined in detail. Bajracharya and Mool (2009) argued that Khumbu Glacier has undergone termi-nus retreat, based on comparison of recent imagery with old topographic maps. Our images, however, indicate that the terminus region of Khumbu Glacier has undergone very little change in recent decades (Fig. 5b, c and Supple-ment Fig. 1). This highlights the fact that debris-covered glaciers may have stable terminus positions even though they are in negative balance, and that volume changes are more reliable indicators of glacier health than area changes (cf. Scherler et al., 2011).
The calculated average 1970–2007 thickness changes for the whole study area of −0.36±0.07 m a−1, based on in-dependent data sets, is very close to the value of−0.33± 0.24 m a−1presented by Bolch et al. (2008b) for 1962–2002, but with smaller uncertainty. The wider coverage of this study including Imja Glacier, and the accumulation area of Khumbu Glacier, as well as lower uncertainties and the multi-temporal coverage, allow greater insight into decadal glacier changes and the influence of debris cover.
The longitudinal profile of glacier thinning of Khumbu Glacier shows similar characteristics to those presented by Nakawo et al. (1999) based on estimated ice flow and thermal properties derived from Landsat data. Based on field mea-surements, Kadota et al. (2000) found a slight surface lower-ing (∼5 m) about 1 km upglacier of the terminus and higher surface loss (more than 10 m in places) up to the pinnacle zone close to Everest base camp for the period 1978–1995. This is in good agreement with our data. These observa-tions increase confidence in the observed patterns of down-wasting, despite the remaining uncertainties.
The pattern of surface lowering on Khumbu Glacier can be explained in terms of ice dynamics and surface melt rates. Sustained high rates of ice delivery below the icefall largely offset melt in the upper ablation area, where debris cover is thin or absent (Figs. 5 and 6a, section A). Further downglacier, thin debris cover increases the ice melt (sec-tion B), in line with field measurements of increased sur-face lowering (Takeuchi et al., 2000). Thinning rates remain high downglacier despite an increasing debris thickness, due to very low glacier velocities and ablation associated with supraglacial lakes and exposed ice cliffs (Sakai et al., 2000, 2002) (section C, Supplement, Fig. 2). Almost no thinning was observed within 1 km of the terminus (section D), which may reflect either a thick, complete debris cover or indicate that ice loss is already complete. The possible slight surface lowering in the accumulation area of the glacier from 1970
to 2007 might be due to less snowfall. This is consistent with an ice core record at the East Rongbuk Glacier north of Mt. Everest that indicates decreasing snow accumulation for 1970–2001 (Kaspari et al., 2008).
The pattern of downwasting has resulted in the devel-opment of a concave glacier profile on Khumbu Glacier, with very low surface gradients in the lower ablation zone (Fig. 5b). This trend indicates that a glacial lake could de-velop about 1.5 to 3 km upstream of the terminus, as was pre-dicted in simulations using a 1D-coupled mass balance and flow model by Naito et al. (2000). The formation of a large lake on Khumbu Glacier would have major consequences for outburst flood hazards downstream.
T. Bolch et al.: Multi-decadal mass loss of glaciers in the Everest area (Nepal Himalaya) 357 The total mass balance of Khumbu Glacier for 1970–
2007, at−0.27±0.08 m w.e. a−1is lower than that observed on several other Himalayan glaciers including Chhota Shi-gri Glacier (−0.98 m w.e. a−1, 2002–2006 Wagnon et al., 2007 and –1.02 to –1.12 m w.e. a−1, 1999–2004 Berthier et al., 2007) or the small debris-free Glacier AX010 (−0.6 to −0.8 m w.e. a−1, 1978–1999 Fujita et al., 2001), but similar to Dokriani Glacier (−0.32 m w.e. a−1, 1992–2000 Dobhal et al., 2008). However, the different observation times and glacier sizes have to be considered, and Khumbu Glacier also has possibly a more negative mass balance in recent years. The tendency towards increased mass loss has also been ob-served worldwide and for the few other Himalayan glaciers with mass balance estimates (Cogley, 2011). The mass loss of the investigated glaciers is similar to the average mass loss of the 30 reference glaciers worldwide for 1976–2005 (−0.32 m w.e. a−1) (Zemp et al., 2009).
5 Conclusions
This study presents the longest time series of geodetically derived mass-balance and glacier volume change estimates obtained to date in the Himalaya. Geodetic mass-balance estimates based on early stereo Corona and recent satellite data are suitable for tracking glacier changes through time, thus filling major gaps in glaciological knowledge of the Hi-malaya and other mountain regions. However, careful rela-tive adjustments of the DTMs are necessary to obtain suit-able accuracies of DTMs based on different data sources with different resolutions. Mass balance information is ur-gently needed to improve knowledge of the response of Hi-malayan glaciers to climate change and to allow prediction of future glacier change and its influence on water resources, river runoff, sea level rise, and glacial hazards.
Glaciers south of Mt. Everest have continuously lost mass from 1970 until 2007, with a possibly increasing rate in re-cent years. All glaciers lost mass despite partly thick debris-cover. The highest loss was observed at Imja Glacier which terminates into a lake. The specific mass balance of the in-vestigated glaciers of−0.32±0.08 m w.e. a−1is not higher than the global average.
Supplementary material related to this article is available online at:
http://www.the-cryosphere.net/5/349/2011/ tc-5-349-2011-supplement.pdf.
Acknowledgements. We thank M. Buchroithner for the support and B. Shreshta, S. Bajracharja and P. Mool and the staff from ICIMOD, Nepal for cooperation. We are grateful for the thorough reviews of A. Racoviteanu, G. Cogley and an anonymous reviewer on an earlier version of this paper. The comments by the anonomous reviewer, D. Quincey and the short comments of M. Pelto and the scientific editor A. K¨a¨ab improved it further. H. Raggam helped
with RSG software. GAF AG offered Cartosat-1 data at a reduced price and D. Quincey provided the 1984 images. DFG (Deutsche Forschungsgemeinschaft) provided financial support (Codes BU 949/15-1 and BO 3199/2-1). T. Bolch was partly funded through the ESA project GlobGlacier (21088/07/I-EC).
Edited by: A. K¨a¨ab
References
Altherr, W. and Gr¨un, A.: Mt. Everest Karte 1:50 000 – Faszination eines Kartenprojektes, Schweizerische Zeitschrift f¨ur Vermes-sung, Kulturtechnik und Photogrammetrie, Febr, 90–97, 1990. Asahi, K.: Inventory and recent variations of glaciers in the eastern
Nepal Himalayas, Seppyo, 159–169, 2001.
Bajracharya, S. R. and Mool, P. K.: Glaciers, glacial lakes and glacial lake outburst floods in the Mount Everest region, Nepal, Ann. Glaciol., 50, 81–86, 2009.
Bamber, J. L. and Rivera, A.: A review of remote sensing methods for glacier mass balance determination, Global Planet. Change, 59, 138–148, 2007.
Benn, D. I., Wiseman, S., and Hands, K.: Growth and drainage of supraglacial lakes on debris-mantled Ngozumpa Glacier, Khumbu Himal, Nepal, J. Glaciol., 47(159), 626–638, 2001. Berthier, E., Arnaud, Y., Rajesh, K., Sarfaraz, A., Wagnon, P., and
Chevallier, P.: Remote sensing estimates of glacier mass bal-ances in the Himachal Pradesh (Western Himalaya, India), Re-mote Sens. Environ., 108, 327–338, 2007.
Berthier, E., Schiefer, E., Clarke, G. K. C., Menounos, B., and R´emy, F.: Contribution of Alaskan glaciers to sea-level rise derived from satellite imagery, Nat. Geosci., 3, 92–95, doi:10.1038/NGEO737, 2010.
Bhambri, R., Bolch, T., Chaujar, R., K. and Kulshreshtha, S. C.: Glacier changes in the Garhwal Himalayas, India 1968–2006 based on remote sensing, J. Glaciol., 97(203), 14 pp., 2011. Bolch, T., Buchroithner, M. F., Peters, J., Baessler, M., and
Ba-jracharya, S.: Identification of glacier motion and potentially dangerous glacial lakes in the Mt. Everest region/Nepal using spaceborne imagery, Nat. Hazards Earth Syst. Sci., 8, 1329– 1340, doi:10.5194/nhess-8-1329-2008, 2008a.
Bolch, T., Buchroithner, M. F., Pieczonka, T., and Kunert, A.: Plani-metric and voluPlani-metric glacier changes in Khumbu Himalaya since 1962 using Corona, Landsat TM and ASTER data, J. Glaciol., 54, 592–600, 2008b.
Bolch, T., Yao, T., Kang, S., Buchroithner, M. F., Scherer, D., Maus-sion, F., Huintjes, E., and Schneider, C.: A glacier inventory for the western Nyainqentanglha Range and the Nam Co Basin, Ti-bet, and glacier changes 1976-2009, The Cryosphere, 4, 419– 433, doi:10.5194/tc-4-419-2010, 2010.
Braithwaite, R. J. and Raper, S. C. B.: Glaciers and their contri-bution to sea level change, Phys. Chem. Earth, 27, 1445–1454, 2002.
Cogley, J. G.: Himalayan glaciers now and in 2035, in: Encyclopae-dia of Snow, Ice and Glaciers, edited by: Singh, V. P., Singh, P., and Haritashya, U. K., Springer, in press, 2011.
Dobhal, D. P., Gergan, J. T., and Thayyen, R. J.: Mass balance studies of the Dokriani Glacier from 1992 to 2000, Garhwal Hi-malaya, India, Bull. Glaciol. Res., 25, 9–17, 2008.
Fujita, K., Kadota, T., Rana, B., Shresta, R. B., and Ageta, Y.: Shrinkage of Glacier AX010 in shorong region, Nepal Hi-malayas in the 1990s, Bull. Glaciol. Res., 18, 51–54, 2001. Fujita, K., Sakai, A., Nuimura, T., Yamaguchi, S., and Sharma,
R. R.: Recent changes in Imja Glacial Lake and its damming moraine in the Nepal Himalaya revealed by in situ surveys and multi-temporal ASTER imagery, Environ. Res. Lett., 4, 045205, doi:10.1088/1748-9326/4/4/045205, 2009.
Hambrey, M., Quincey, D., Glasser, N. F., Reynolds, J. M., Richard-son, S. J., and Clemmens, S.: Sedimentological, geomorpho-logical and dynamic context of debris-mantled glaciers, Mount Everest (Sagarmatha) region, Nepal, Quaternary Sci. Rev., 27, 2341–2360, 2008.
Immerzeel, W. W., van Beek, L. P. H., and Bierkens, M. F. P.: Cli-mate change will affect the Asian water towers, Science, 328, 1382–1385, 2010.
Kadota, T., Seko, K., Aoki, T., Iwata, S., and Yamaguchi, S.: Shrinkage of Khumbu Glacier, east Nepal from 1978 to 1995, IAHS Publ., 264, 235–243, 2000.
Kaspari, S., Hooke, R. L. B., Mayewski, P. A., Kang, S., Hou, S., and Qin, D.: Snow accumulation rate on Qomolangma (Mount Everest), Himalaya: synchroneity with sites across the Tibetan Plateau on 50–100 year timescales, J. Glaciol., 54, 343–352, 2008.
Koblet, T., G¨artner-Roer, I., Zemp, M., Jansson, P., Thee, P., Hae-berli, W., and Holmlund, P.: Reanalysis of multi-temporal aerial images of Storglaciren, Sweden (1959-99) - Part 1: Determina-tion of length, area, and volume changes, The Cryosphere, 4, 333–343, doi:10.5194/tc-4-333-2010, 2010.
Kulkarni, A. V.: Mass balance of Himalayan glaciers using AAR and ELA methods, J. Glaciol., 38, 101–104, 1992.
Naito, N., Nakawo, M., Kadota, T., and Raymond, C. F.: Numer-ical simulation of recent shrinkage of Khumbu Glacier, Nepal Himalayas, IAHS Publ., 264, 245–254, 2000.
Nakawo, M., Yabuki, H., and Sakai, A.: Characteristics of Khumbu Glacier, Nepal Himalaya: recent changes in the debris-covered area, Ann. Glaciol., 28, 118–122, 1999.
Nuth, C. and K¨a¨ab, A.: Co-registration and bias corrections of satel-lite elevation data sets for quantifying glacier thickness change, The Cryosphere, 5, 271–290, doi:10.5194/tc-5-271-2011, 2011. Paterson, W. S. B.: The Physics of Glaciers 3rd ed. New York:
Perg-amon, 1994.
Paul, F. and Haeberli, W.: Spatial variability of glacier ele-vation changes in the Swiss Alps obtained from two dig-ital elevation models, Geophys. Res. Lett., 35, L21502, doi:10.1029/2008GL034718, 2008.
Pieczonka, T., Bolch, T., and Buchroithner, M. F.: Generation and evaluation of multi-temporal digital elevation models from dif-ferent optical sensors, J. Photogramm. Rem. Sens., in revision, 2011.
Prasad, A. K., Yang, K.-H. S., El-Askary, H. M., and Kafatos, M.: Melting of major glaciers in the western Himalayas: evidence of climatic changes from long term MSU derived tropospheric temperature trend (1979-2008), Ann. Geophys., 27, 4505–4519, doi:10.5194/angeo-27-4505-2009, 2009.
Quincey, D., Luckman, A., and Benn, D.: Quantification of Everest region glacier velocities between 1992 and 2002, using satellite radar interferometry and feature tracking, J. Glaciol., 55, 596– 606, 2009.
Ramanathan, V. and Carmichael, G.: Global and regional climate changes due to black carbon, Nat. Geosci., 1, 221–227, 2008. Richardson, S. D. and Reynolds, J. M.: An overview of glacial
haz-ards in the Himalayas, Quatern. Int., 65/66, 31–47, 2000. Sakai, A., Takeuchi, N., Fujita, K., and Nakawo, M.: Role of
supraglacial ponds in the ablation process of a debris-covered glacier in the Nepal Himalayas., IAHS Publ., 264, 119–130, 2000.
Sakai, A., Nakawo, M., and Fujita, K.: Distribution characteristics and energy balance of ice cliffs on debris-covered glaciers, Nepal Himalaya, Arc. Antarc. Alp. Res., 34, 12–19, 2002.
Scherler, D., Leprince, S., and Strecker, M. R.: Glacier-surface ve-locities in alpine terrain from optical satellite imagery–Accuracy improvement and quality assessment, Remote Sens. Environ., 112, 3806–3819, 2008.
Scherler, D., Bookhagen, B., and Strecker, M. R.: Spatially variable response of Himalayan glaciers to climate change affected by debris cover, Nat. Geosci., 4,156–159, 2011.
Surazakov, A. and Aizen, V. B.: Positional accuracy evaluation of declassified Hexagon KH-9 mapping camera imagery, Pho-togramm. Eng. Rem. S., 76, 603–608, 2010.
Takeuchi, Y., Kayastha, R. B., and Nakawo, M.: Characteristics of ablation and heat balance in debris-free and debris-covered areas on Khumbu Glacier, Nepal Himalayas, in the pre-monsoon season, IAHS Publ., 264, 53–61, 2000.
Wagnon, P., Linda, A., Arnaud, Y., Kumar, R., Sharma, P., Vincent, C., Pottakkal, J. G., Berthier, E., Ramanathan, A., Hasnain, S. I., and Chevallier, P.: Four years of mass balance on Chhota Shigri Glacier, Himachal Pradesh, India, a new benchmark glacier in the western Himalaya, J. Glaciol., 53, 603–611, 2007.
Zemp, M., Hoelzle, M., and Haeberli, W.: Six decades of glacier mass balance observations – a review of the worldwide monitor-ing network, Ann. Glaciol., 50, 101–111, 2009.