www.biogeosciences.net/10/2699/2013/ doi:10.5194/bg-10-2699-2013
© Author(s) 2013. CC Attribution 3.0 License.
Biogeosciences
Geoscientiic
Geoscientiic
Geoscientiic
Geoscientiic
Coccolithophore surface distributions in the North Atlantic and
their modulation of the air-sea flux of CO
2
from 10 years of
satellite Earth observation data
J. D. Shutler1, P. E. Land1, C. W. Brown2, H. S. Findlay1, C. J. Donlon4, M. Medland1, R. Snooke3, and J. C. Blackford1
1Plymouth Marine Laboratory, Plymouth, UK
2Center for Satellite Applications and Research, National Oceanic and Atmospheric Administration, USA 3College of Life and Environmental Sciences, University of Exeter, UK
4European Space Agency, ESA/ESTEC, Noordwijk, the Netherlands
Correspondence to:J. D. Shutler ([email protected])
Received: 2 April 2012 – Published in Biogeosciences Discuss.: 22 May 2012 Revised: 15 March 2013 – Accepted: 19 March 2013 – Published: 23 April 2013
Abstract.Coccolithophores are the primary oceanic phyto-plankton responsible for the production of calcium carbon-ate (CaCO3). These climatically important plankton play a key role in the oceanic carbon cycle as a major contribu-tor of carbon to the open ocean carbonate pump (∼50 %) and their calcification can affect the atmosphere-to-ocean (air-sea) uptake of carbon dioxide (CO2)through increas-ing the seawater partial pressure of CO2 (pCO2). Here we document variations in the areal extent of surface blooms of the globally important coccolithophore, Emiliania hux-leyi, in the North Atlantic over a 10-year period (1998– 2007), using Earth observation data from the Sea-viewing Wide Field-of-view Sensor (SeaWiFS). We calculate the an-nual mean sea surface areal coverage ofE. huxleyi in the North Atlantic to be 474 000±104 000 km2, which results in a net CaCO3 carbon (CaCO3-C) production of 0.14– 1.71 Tg CaCO3-C per year. However, this surface coverage (and, thus, net production) can fluctuate inter-annually by
−54/+81 % about the mean value and is strongly correlated with the El Ni˜no/Southern Oscillation (ENSO) climate oscil-lation index (r=0.75,p<0.02). Our analysis evaluates the spatial extent over which theE. huxleyiblooms in the North Atlantic can increase thepCO2and, thus, decrease the lo-calised air-sea flux of atmospheric CO2. In regions where the blooms are prevalent, the average reduction in the monthly air-sea CO2 flux can reach 55 %. The maximum reduction of the monthly air-sea CO2flux in the time series is 155 %.
This work suggests that the high variability, frequency and distribution of these calcifying plankton and their impact on pCO2should be considered if we are to fully understand the variability of the North Atlantic air-to-sea flux of CO2. We estimate that these blooms can reduce the annual N. Atlantic net sink atmospheric CO2by between 3–28 %.
1 Introduction
Coccolithophores are an abundant and widely distributed group of marine phytoplankton that form external calcium carbonate (CaCO3)scales or platelets, called coccoliths, dur-ing their life cycle. Coccolithophores are major calcifiers in the open ocean (Sabine et al., 2004), and play a key role in oceanic carbon cycles (Balch et al., 2005; Iglesias-Rodriguez et al., 2002). Primary production sustains the organic carbon pump that transfers organic carbon from surface waters to the deep ocean and pelagic calcification (such as that from coccolithophores) counter-acts the CO2uptake related to pri-mary production (Harlay et al., 2010). CaCO3also acts as a ballast mineral for marine organic particles, increasing their sinking rate to deeper waters and is thought to increase the long-term storage of carbon (Honjo et al., 2008). CaCO3 coc-coliths are generated through the calcification reaction: Ca2++2HCO−3 ⇔CaCO3+H2O+CO2 (1) This leads to a disequilibrium in the ocean carbonate sys-tem that can drive an additional flux of CO2 to the atmo-sphere; calcification depletes surface CO23−, reduces alka-linity and increases the seawater partial pressure of CO2 (pCO2). Within this process the deposition of 1 mol of cal-cium carbonate releases ∼0.6 mol of CO2 into seawater (Frankignoulle and Gattuso, 1994). In addition, production and sedimentation of coccoliths is a long-term carbon sink process. As previously mentioned, it is important to note that calcification is not the only biological control onpCO2. CO2 uptake by photosynthesis and its release by respiration are major processes by which marine organisms and ecosystems can alterpCO2(Gattuso et al., 1995) and the interaction be-tween photosynthesis, respiration and calcification in certain marine systems (e.g., coral reefs) can be tightly coupled (Gat-tuso et al., 1995). Equally, the biogeochemical history of the body of water is also important.
It has been documented since the early 1980s by the use of satellite imagery that there is a considerable amount of E. huxleyi activity in the N. Atlantic (Holligan et al., 1983). Of the numerous coccolithophores, the cosmopoli-tan speciesEmiliania huxleyi, when present at high con-centrations (blooms) in the surface layer, profoundly im-pacts the optical properties of the upper ocean (Balch et al., 1991; Tyrrell et al., 1999; Holligan et al., 1993). The high re-flectance spectral signature ofE. huxleyiblooms allows the study of their frequency, distribution pattern and areal extent by Earth observation (EO) from satellites (Brown and Yo-der, 1994a; Cokacar et al., 2001; Smyth et al., 2004; Merico et al., 2003; Shutler et al., 2010; Iglesias-Rodriguez et al., 2002). Based on EO data the E. huxleyi areal coverage in the N. Atlantic has been estimated to account for 40–60 % of the global areal coverage ofE. huxleyi(Brown and Yoder, 1994a), with single blooms covering areas of>100 000 km2 (Brown and Yoder, 1994a). Through the use of EO data, these calcifying blooms are known to occur over large areas of the N. Atlantic and the ability of calcification to alter thepCO2 is well understood. However, the spatial and temporal
im-pact that these blooms have onpCO2and on the air-sea flux of CO2(F) across the whole of the N. Atlantic has yet to be characterised.
It has already been observed that pCO2 in regions of the N. Atlantic is highly variable (Watson et al., 2009; Schuster and Watson, 2007) and within some regions of the N. Atlantic sub-polar gyrepCO2has unexpectedly increased faster than atmospheric levels (Lefevre et al., 2004; Le Quere et al., 2009). Lefevre et al. (2004) concluded that this unex-pected increase was due to a decrease in biological activity as the trend was strongest during spring and summer (Lefevre et al., 2004). Similarly, in generalE. huxleyibloom activity in the N. Atlantic increases as spring progresses into sum-mer, exhibiting a peak in bloom activity during late June and early July, with blooms still forming in the north east dur-ing August. Due to the slow equilibration time between the surface ocean and the atmosphere (6 months to a year) the in-creasedpCO2due to calcification will remain in place long after a bloom has finished, blocking a large portion of the annual CO2sink cycle (Robertson et al., 1991). In addition, increased E. huxleyi bloom activity at higher latitudes has been reported in the polar Barents sea (Smyth et al., 2004), while an increasing (multi-decadal) trend in multi-taxa coc-colithophore abundance has been identified (McQuatters-Gollop et al., 2010) for a sub-set of the north east Atlantic. Therefore, it is possible that calcifying plankton may be play-ing a role in the unexpected elevatedpCO2in the waters of the N. Atlantic sub-polar gyre.
Many regional ecosystem models used to produce short to medium term predictions of air-sea CO2fluxes in the N. At-lantic do not include the effect that calcifying plankton can have onpCO2(e.g., ERSEM; Wakelin et al., 2012). Global biogeochemical/ecosystem models often represent calcifica-tion by a highly simplified parameterisacalcifica-tion, for instance as a globally constant rain ratio (e.g., OCMIP-2, (Najjar et al., 2007), a latitudinal function (e.g., MEDUSA; Yool et al., 2011) or as a function of the surface saturation state of calcite or aragonite (e.g., BioGEM; Ridgwell et al., 2007). Calcifi-cation can alter thepCO2and, thus, the air-sea flux and so these simplifications may introduce a large source of uncer-tainty within the modelled air-sea fluxes.
In this paper, we study the areal extent of E. huxleyi
blooms in the open ocean (>200 m depth) in temperate to high latitudes of the N. Atlantic (35◦N–68◦N, 75◦W–11◦E) (Fig. 1).
Fig. 1.The study region. The white regions show the spatial
dis-tribution of open ocean (>200 m) Emiliania huxleyi blooms during
April to August as detected by the Earth observation (EO) data used in this study (1998–2007). Land is in brown. A white pixel shows that an instance of an Emiliania huxleyi bloom has appeared once or more within the 1998–2007 time series.
2 Methods
E. huxleyiblooms were detected in ocean colour radiometry measurements acquired by the Sea Viewing Wide Field-of-View Sensor (SeaWiFS) from 1998 to 2007 by applying a recently developed technique (Shutler et al., 2010) to esti-mate their surface areal coverage. We restricted our exami-nation of data to the months from April to August so that the minimum solar elevations were between 30°and 50°. This criterion helps reduce the uncertainties in the optical remote sensing data. It is also ecologically appropriate as low light levels and low temperatures inhibit coccolithophore growth during the Northern Hemisphere winter months (Tyrrell and Merico, 2004). A confusion matrix evaluation between the EO data and a 10 year in situ dataset from the Continuous Plankton Recorder (CPR) (Reid et al., 2003) combined with analytical error propagation were used to determine error es-timates in the EO derived surface areal coverage. Net CaCO3 carbon (CaCO3-C) production ofE. huxleyiblooms was cal-culated using constant standing stock approaches and a range of parameter quantities. The impact that theE. huxleyi distri-butions have onpCO2(and, thus, F )was then determined using the SeaWiFS data, a constant CaCO3-C concentration, a carbonate system software toolbox (seacarb) and climatol-ogy data (Takahashi et al., 2009).
2.1 Datasets
The SeaWiFS level 2 quality controlled normalised water leaving radiance data covering the region of interest for all complete years (1998–2007) were obtained from the NASA ocean colour website (NASA, 2010). All SeaWiFS data were re-projected using generic tools (Shutler et al., 2005) to an equidistant cylindrical projection with an equatorial pixel size of 4 km. The SeaWiFS data archive also includes data for 2008–2009. However, these data were excluded from analy-sis due to prolonged gaps in data coverage during these years, as these prolonged gaps fail the requirements for the
coccol-ithophore classification algorithm. The mean Multivariate El Ni˜no/Southern Oscillation (ENSO) Index data for each year were calculated using monthly data downloaded from NOAA (2011). The N. Atlantic Oscillation (NAO) data used here are the result of Principal Component Analysis of sea-level pres-sure over the N. Atlantic sector for months from December to March (Hurrell et al., 2001) and were obtained from Hurrell (2011). Correlations between the climate indices (ENSO and NAO) and the total season surface areal coverage ofE. hux-leyiblooms were determined using the Pearson correlation coefficient in python using the SciPy (v0.7.1) toolbox. Cli-matological data of the partial pressures of CO2in seawater (pCO2)and air, salinity, solubility and the gas transfer veloc-ity (Takahashi et al., 2009) at 5◦×4◦global grid resolution were used as the basis to calculateF. Two grid cells south of Iceland were missing from the climatology data and this is a region of annualE. huxleyiactivity e.g., (Raitsos et al., 2006). Therefore, to allow this area to be studied the clima-tology values within these cells were generated by linearly interpolating the data from the adjacent cells. In situ mea-surements of coccolithophore cell numbers for the same ge-ographical region and temporal period as the SeaWiFS data were obtained from the CPR survey (Reid et al., 2003).
2.2 Emiliania huxleyi surface areal coverage
For each satellite pass in the time series a map ofE. huxleyi
surface areal coverage was generated (Shutler et al., 2010). The first stage of this algorithm exploits temporal correlation to remove the background signal (referred to as background subtraction and relies upon the data from proceeding months to characterise the region of interest). This approach reduces the number of false positives caused by suspended sediment and allows the spectral classification stage to focus on just the areas of ocean that have recently changed (e.g., due to the for-mation of a bloom). The second stage of the algorithm uses a spectral algorithm (Brown and Yoder, 1994a) to classify the remaining data into areas that containE. huxleyiand those that do not. The algorithm default parameters and data qual-ity control thresholds followed those of Shutler et al. (2010). All maps ofE. huxleyisurface coverage were masked based on bathymetry and only regions with depth>200 m were in-cluded in the analysis as these are considered open ocean waters. Additionally, the enclosed region of the Laurentian Channel (in the Gulf of St Lawrence in the region of 48.0◦N
61.5◦W) was not included as this is only 290 m deep and
was considered susceptible to influences from river run off. Monthly maps of counts ofE. huxleyi elements (CCxy)and cloud-free elements (CFxy)at pixel position (x, y)were gen-erated from the EO data for all data for years 1998–2007. A cloud free element is defined as any pixel with a water leav-ing radiance>0 at any of the wavelengths of interest (443, 510 and 555 nm). For each month, m, the estimated area of
line (y) is determined using:
ACmy=
X P x=1
CCxy X P x=1
CFxy
AyNVy (2)
wherex is the longitudinal grid point, NVy is the number of valid ocean pixels in the longitudinal row andAy is the pixel area at that latitude. The pixel area was determined by representing the Earth as an ellipsoid. The use of NVystops regions of land from consistently biasing the results and the normalisation using the cloud free element count (CFxy)is done to make a first order correction for cloud cover by as-suming that the proportion ofE. huxleyi under the clouds is the same as that observed in cloud free areas. Summing this over all latitudes gives the monthly surface coverage; sum-ming across all months (April–August) gives the yearly total surface coverage (in km2).
2.3 Standing stock and air-sea flux calculations
Previous CaCO3-C standing stock calculations (e.g., Brown and Yoder, 1994a) have relied on an estimate of the cell den-sity, the CaCO3-C content of each coccolithophore cell and a mixed layer depth (and have assumed a fixed number of coc-coliths per cell). In this study, we are interested in the impact that calcification can have on thepCO2 and to do this we require a CaCO3-C concentration. Therefore, our CaCO3-C standing stock calculations use a coccolith concentration and a quantity of CaCO3-C per coccolith, which allows a CaCO3 -C concentration to be determined without the need to assume a fixed number of coccoliths per cell. Bloom coccolith con-centrations in the literature range 75 000–300 000 coccoliths ml−1 (Balch et al., 1991, 1992, 1996). Similarly, CaCO3-C per coccolith quantities range between 0.2–0.6 pg CaCO3-C (Balch et al., 1992, 1996; Brown and Yoder, 1994b; Holli-gan et al., 1983). For our indicative net CaCO3-C content estimates and our flux analyses we use the middle values in each of these ranges, so 187,500 coccoliths ml−1 and 0.4 pg CaCO3-C per coccolith; this results in a CaCO3-C concentration of 0.075 mg l−1. For consistency with previous studies, we adopt the mixed layer depth of 20 m as used in previous work (Brown and Yoder, 1994a). To investigate the sensitivity of these parameter choices, we also calculate net production rates across the complete range (quoted above) of coccolith concentrations, CaCO3-C coccolith weights and a range of mixed layer depths. The volume of water below a 1 km2area of ocean assuming a (mixed layer) depth of 20 m is 20×1012ml. Multiplying this by an areal coverage and the per coccolith CaCO3-C weight gives the standing stock esti-mate of the net CaCO3-C content for a given areal coverage. Next a bloom residence time for each bloom is required. Ex-amples of residence values from the literature range between 5–40 days, e.g., (Berelson et al., 2007; Brown and Yoder,
1994b; Harlay et al., 2010). Previous work for the region of study used EO from the Coastal Zone Color Scanner (CZCS) data to estimate mean and median bloom durations of 36 ±25 days and 31 days, respectively (Brown and Yoder, 1994b). From studying our SeaWiFS data, example blooms in a range of locations were on average visible in the same approximate location for∼3 weeks (21 days). The EO data is only able to detect bloom conditions under cloud free conditions and is also unable to detect the development of the bloom. There-fore, the period of initial growth will not be within the 21 days. To include the period of growth prior to the blooms be-ing visible in the EO data, and to cover the potential biasbe-ing due to cloud, the estimated residence time was extended to 30 days. Therefore, it was assumed thatE. huxleyi blooms would be present in the water for an average of 1 month or
∼30 days meaning that a monthly surface coverage map rep-resents the mean monthly conditions.
The net air-sea fluxes were calculated for each year us-ing the Takahashi climatology dataset as perturbed by theE. huxleyi distributions (1998–2007) and following the meth-ods in the original climatology publication (Takahashi et al., 2009) to produce F in teragrams of carbon per month (Tg C month−1). The air-sea flux of CO2is estimated as the difference in pCO2 between the surface water and the at-mosphere modulated by an exchange coefficient (Takahashi et al., 2009). As we follow the methods of Takahashi et al. (2009) for deriving the air-sea fluxes, the solubility coeffi-cient and gas transfer velocity parameterisations follow those of the original publication. The water and atmosphericpCO2 are estimated from Takahashi et al. (2009) by increasing the climatological values linearly with year by 1.5 µatm yr−1to account for the known underlying global trend (Takahashi et al., 2009). We assume that the ratio of particulate inorganic carbon to particulate organic carbon (rain rate) remains the same between years. The corrected seawater pCO2 within each grid cell was then modified based onE. huxleyibloom activity using (i) a fixed concentration of CaCO3-C within each bloom of 0.075 mg l−1; (ii) the ratio (ψ ) of CO2 re-leased (1[CO2]) to precipitated CO3as calculated using the methods in the seacarb software package (Lavigne and Gat-tuso, 2011; Dickson et al., 2007; DOE, 1994; Frankignoulle and Gattuso, 1994; Zeebe and Wolf-Gladrow, 2001) and (iii) the change inpCO2dissolved into the water due to calcifica-tion was calculated using1[CO2]/k0, wherek0is the temper-ature dependent CO2seawater constant. The modifiedpCO2 was then used to determineF assuming also that theE. hux-leyiblooms raise the temperature of the surface water within the bloom by 1◦C (Holligan et al., 1993). This process was
if the modulation of the air-sea fluxes is primarily driven by strong ENSO events.
3 Results
3.1 Uncertainties in E. huxleyi surface coverage estimates
The accuracy of the coccolithophore (E. huxleyi) maps was analysed using the method of (Shutler et al., 2010) and all available CPR (26 738 in situ data points) and SeaWiFS data for 1998–2007. This analysis provides a measure of the methods ability to correctly detectE. huxleyi blooms. This analysis using an in situ database resulted in N=2102 cocident data points (265 bloom instances, 1837 no-bloom in-stances) and a correct classification rate (CCR) of 78 % with a false alarm rate (FAR) of 14 %. (An ideal case would be CCR=100 % and FAR=0 %). The FAR=14 % can be par-tially explained by the mesh size characteristics of the CPR instrument. The mesh size of the CPR is 270 µm, whereas anE. huxleyicoccosphere diameter is of the order of∼5 µm and coccolith diameters are of the order of 2.5 µm. There-fore, the CPR is only able to detect the presence of coc-colithophores when the coccospheres or coccoliths become caught on the strands of the mesh. As the blooms subside the spectral signal from the coccoliths will still be significant and due to the smaller coccolith size they are less likely to be caught on the strands of the CPR mesh. Following this analysis, we estimate the total uncertainty in theE. huxleyi
surface coverage data as having an upper limit of 22 % (100– CCR). To investigate how much of this uncertainty was due to the spectral algorithm, we performed a theoretical error propagation analysis of the spectral algorithm. This analy-sis was performed by propagating the known uncertainties of the individual spectral channels and their ratios (Hooker et al., 2001) through the classification algorithm using standard error propagation approaches (Taylor, 1997). These known uncertainties are all random perturbations as the sensor spec-tral channels have been shown not to exhibit significant bias (Hooker et al., 2001). The resultant uncertainty in the spec-tral classification algorithm due to the known uncertainties in the input spectral data was calculated to be 11 %, which equates to half of the total uncertainty.
3.2 Surface coverage, CaCO3production and correlation with climate indices
The mean annual surface areal coverage of the E. huxleyi
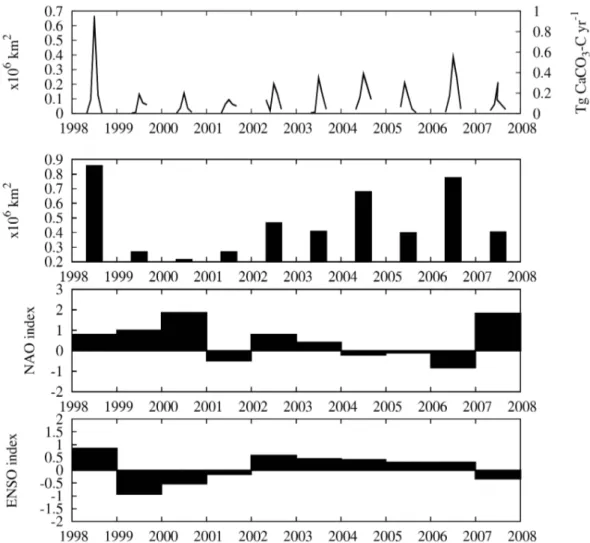
blooms in the study area during the 10 years examined was 474 000±104 000 km2 with a highly variable inter-annual surface coverage, varying from−54 % to+81 % of the mean value in 2000 and 1998, respectively. Based on our mid range standing stock parameter choices (see Sect. 2.3) this areal extent results in a standing stock production of 0.71±0.16 teragrams CaCO3-C per year (Tg CaCO3-C yr−1). Using the
full range of parameter values and the mean areal estimate (474 000 km2yr−1)produces a CaCO
3-C standing stock of 0.14–1.71 Tg CaCO3-C yr−1. The monthly surface areal cov-erage and our mid range net CaCO3-C production for the months April to August for the study period are shown in Fig. 2a and b shows the net surface coverage for each year (April to August). The yearly (April–August) totalE. huxleyi
surface areal coverage (1998–2007) was found to be strongly positively correlated with the mean multivariate ENSO index (r=0.75,p<0.02) (Fig. 2d). A negative correlation with the winter NAO was also observed (r= −0.47) (Fig. 2c), but the correlation was not statistically significant (p=0.17). 3.3 Modulation of the air-sea flux of CO2
Fig. 2.Time series data (1998–2007).(a)Monthly Emiliania huxleyi surface coverage and CaCO3-C production for April to August of each
year using the mid-range parameter set;(b)yearly total (sum of April to August) of surface coverage for each year;(c)mean NAO index for
each year and(d)mean multivariate ENSO index for each year.
4 Discussion
The strong positive correlation found here between total
E. huxleyisurface coverage and ENSO illustrates climate-driven variability of E. huxleyi blooms, although the exact impact and processes of the ENSO acting on the E. hux-leyiin the N. Atlantic are unclear. Furthermore, this corre-lation also suggests a linkage between the ENSO and vari-ations inpCO2and air-sea CO2flux in the N. Atlantic (via theE. huxleyi). However, the similar upper value of percent-age change inpCO2(and, thus, flux) reported for the results excluding the strong ENSO years of 1998 and 1999 show that the large modulation ofpCO2and flux is not simply a function of strong ENSO variation. Previous work has shown that the ENSO can drive the NAO (Mokhov and Smirnov, 2006) and, thus, impact on the physical conditions in the At-lantic (i.e., temperature, precipitation and storm activity). It has also been shown that>89 % of variation inE. huxleyi sur-face coverage in the N. Atlantic (between 1997–2004) can be
explained by the variations in the physical conditions of solar radiation, mixed layer depth and water temperature (Raitsos et al., 2006). Therefore, we suggest that the ENSO is influ-encing the physics (e.g., heat budget and sea state) in the N. Atlantic and, thus, influencingE. huxleyisurface cover-age.
a
b
c
Fig. 3.Spatial distribution of the average impact of Emiliania
hux-leyi on the monthly air-sea CO2flux for years 1998–2007.(a)
Per-centage increase in seawater partial pressurepCO2(0–14 %);(b)
Percentage decrease in air-water partial pressure difference1pCO2
(0–77 %);(c)Percentage decrease in air-sea CO2flux (0–55 %).
The linear nature of the net CaCO3-C standing stock cal-culations means that they are highly sensitive to the input val-ues. Doubling the coccolith concentration will result in dou-bling of the net standing stock estimate. Similarly doudou-bling the coccolith CaCO3-C weight will double the net stand-ing stock estimate. That said, our net CaCO3-C estimates of 0.14–1.71 Tg CaCO3-C yr−1 are comparable to those of (Balch et al., 2005) where they report a euphotic zone aeri-ally integrated value of 1.65 Tg CaCO3-C yr−1 for 2002 in the N. Atlantic (sum of Atlantic Subarctic, Gulf Stream and N. Atlantic Drift Longhurst regions from Table 6 of (Balch et al., 2005)). Although our values (and those of Balch et al., 2005) are both lower than the model-derived 150 Tg CaCO3 -C yr−1estimated for the year 1990 by an earlier study (Lee, 2001).
It is apparent from Fig. 2a thatE. huxleyibloom surface distributions vary in extent between years and so their impact cannot be assumed to be identical each year. We note that it is common practice (as done here) for air-sea exchange stud-ies to exploit climatology datasets for values ofpCO2, under
a
b
c
Fig. 4. Spatial distribution of the maximum impact of Emiliania
huxleyi on the monthly air-sea CO2flux for years 1998–2007.(a)
Percentage increase in seawater partial pressurepCO2(0–35 %);
(b) Percentage decrease in air-water partial pressure difference
1pCO2(0-231 %);(c)Percentage decrease in air-sea CO2flux (0–
155 %).
Fig. 5.Sensitivity of the maximum percentage reduction in air-sea
flux of CO2(across all years, months and regions) to
concentra-tion of CaCO3-C (in mg l−1). Figures 3 and 4 are calculated for a
CaCO3-C concentration of 0.075 mg l−1.
about the biogeochemical and ecological factors that fun-damentally govern calcification rates, disparate responses of different calcifying organisms to these factors, and also the lack of appropriate data to evaluate model output at the ap-propriate scale. Towards this last issue, the advantages of us-ing EO to evaluate ecosystem model output has recently been highlighted (Shutler et al., 2011) and the maps ofE. huxleyi
surface coverage generated within this study would provide a suitable dataset for model evaluation.
The N. Atlantic is an important and variable sink of atmo-spheric CO2(Watson et al., 2009). Figure 1 shows that the E. huxleyiare prevalent in the north east Atlantic sub-polar regions. Additionally, Figs. 3 and 4 shows that these blooms are having an impact on the air-sea CO2flux in these sub-polar regions. These results combined with the knowledge of the slow equilibration time between the surface ocean and the atmosphere (6 months to a year) suggests that calcify-ing plankton may be one reason for the unexpectedpCO2 concentrations that have been previously reported in the sub-polar N. Atlantic (Lefevre et al., 2004). As a simple illustra-tion, we provide an estimate of the average impact that the coccolithophores can have on the N. Atlantic CO2sink. This used the complete 1998–2007 time series of flux estimates, assumed a simplified one month period of existence for the increased seawaterpCO2 due to the coccolithophore activ-ity (i.e., no equilibrium over many months) and the methods and data from Takahashi et al. (2009) for calculating the net CO2 sink. We found that on average using CaCO3-C con-centrations of 0.01–0.18 mg l−1reduced the annual net sink by≤0.013 Gt C yr−1. For the region studied this is a reduc-tion of the annual net sink of CO2 of ≤ 4 % based on an annual CO2sink of 0.352 Gt C yr−1(as determined from the Takahashi climatology data). However, due to the previously mentioned slow equilibrium times between the ocean and the
atmosphere, this simple one month estimate is likely to be very low. This equilibrium time will vary dependent on a number of factors including the location of the bloom, and the sea state and weather conditions in the months following the bloom, all of which can be highly variable. This suggests that the true impact of the coccolithophores on the net sink of CO2in the N. Atlantic is likely to be much greater than 4 %. To illustrate this point, we repeated the calculation us-ing a six month equilibrium time, usus-ing the maximum change in pCO2 within a region, ignoring the impact of multiple blooms within the same region and assuming that the ele-vatedpCO2remains constant for six months and then returns to its climatological value on month seven. For the region studied the average reduction of the annual net sink of CO2 was 0.01–0.05 Gt C yr−1. This equates to a 3–14 % reduction of the CO2sink based on an annual sink of 0.352 Gt C yr−1. The range in values is due to the range in CaCO3-C concen-trations. The maximum reduction (which occurred in 1998, a strong El Ni˜no year) is 0.01–0.1 Gt C yr−1, which equates to a 3–28 % reduction in the net sink of CO2.
In the natural marine environment theE. huxleyicell con-centrations will generally gradually decrease at the edge of each bloom. However, as already discussed, the EOE. hux-leyi detection algorithm (Shutler et al., 2010) classifies ar-eas of ocean into bloom and non-bloom regions. The output is a binary classification defining clear boundaries between regions of bloom and non-bloom. Whilst the spatial compo-nent of the classification algorithm is able to detect regions of gradually varying concentrations (through a ramp detec-tor, see Shutler et al., 2010), the spectral component of the algorithm consists of a series of spectral thresholds which are defined to minimise confusion betweenE. huxleyi and other spectrally similar particulates. These conditions set by the spectral model mean that the algorithm is more likely to miss regions of reduced concentrations ofE. huxleyi, such as those that can exist around the edge of a bloom. Therefore, the estimates ofE. huxleyi surface coverage and the resultant net CaCO3-C presented in this study are likely to be under-estimates.
using the largest in situ phytoplankton database currently in existence (the CPR data). For these reasons this study relied upon CaCO3-C standing stock calculations. An equally valid approach could use the particulate inorganic carbon (PIC) data product as developed for the MODIS sensor (Balch et al., 2005) which would allow variations in CaCO3-C to be accounted for. However, robustly assessing the regional un-certainties (across the complete time series) of such a dataset is likely to be more problematic as the CPR data appear un-suitable.
Whilst this study has focussed on the open ocean (>200 m depth), coccolithophore blooms are also known to occur in shallower water and their impact on shelf sea, shelf edge and coastal carbonate systems has been documented in a number of in situ studies (Harlay et al., 2010; Suykens et al., 2010; Buitenhuis et al., 1996; Purdie and Finch, 1994) and their spatial impact on the air-sea CO2fluxes in these regions has yet to be analysed.
5 Conclusions
The results presented in this study show a 10-year time series study ofE. huxleyibloom surface distributions in the N. At-lantic, estimated to a precision of ∼22 %. There is a large inter-annual variation in surface area of satellite-detectedE. huxleyiblooms in the N. Atlantic and this variability is pos-itively correlated with the ENSO. Using climatology data, the time series of EO data, and the seacarb package, we have evaluated the impact that theseE. huxleyiblooms can have on pCO2in the surface water. They have the ability to increase pCO2, which in turn reduces the air-sea flux; this reduction in the flux can exist for six or more months after the bloom has dispersed and we estimate that it has the potential to re-duce the N. Atlantic net sink of CO2 by between 3–28 %. The 10-year times series has illustrated the widespread im-pact that these calcifying plankton can have on the air-sea flux of CO2 in the N. Atlantic. The work has also shown that these effects are likely to be more widespread during years that exhibit a strong positive ENSO signal. Our analy-sis highlights the need for the continued study and monitor-ing of these phytoplankton if we are to fully understand the inter-annual variability of the N. Atlantic sink of CO2.
Acknowledgements. The authors would like to acknowledge and thank K. Anderson who gave input to an earlier version of this work and who also co-supervised the work of R. Snooke. This work was partially funded by the following grants: the ESA Support to Science Element (STSE) Fellowship project “Open ocean
and Coastal CO2 fluxes from Envisat and Sentinel 3 in support
of global carbon cycle monitoring (OC-flux)”; the UK NERC Strategic marine research programme Oceans 2025; the EC FP7 MyOcean project through the research and development project
“Improving CO2 Flux Estimations from the MyOcean Atlantic
north west shelf hydrodynamic ecosystem model (IFEMA)” and the UK National Centre for Earth Observation (NCEO) marine carbon
theme. Some of this work was undertaken while the lead author was a visiting researcher at ESA European Space Technology and Research Centre (ESTEC), a visit that was funded by a NCEO mission support grant. Support for C. Brown was provided by the National Oceanic and Atmospheric Administration (NOAA) Centre for Satellite Applications and Research. All SeaWiFS data re-projection was achieved using resources kindly provided by the UK NERC Earth Observation Data Acquisition and Analysis Service (NEODAAS).
Edited by: M. Gregoire
References
Balch, W. M., Holligan, P. M., Ackleson, S. G., and Voss, K. J.: Biological and optical properties of mesosclae coccolithophore blooms in the Gulf of Maine, Limnol. Oceanogr., 36, 629–643, 1991.
Balch, W. M., Holligan, P. M., and Kilpatrick, K. A.: Calcifi-cation, photosynthesis and growth of the bloom forming
co-coolithophore,Emiliania huxleyi, Cont. Shelf Res., 12, 1353–
1374, 1992.
Balch, W. M., Kilpatrick, K. A., Holligan, P. M., Harbour, D., and Fernandez, E.: The 1991 coccolithophore bloom in the central north Atlantic. II Relating optics to coccolith concentration, Lim-nol. Oceanogr., 41, 1684–1696, 1996.
Balch, W. M., Gordon, H. R., Bowler, B. C., Drapeau, D. T., and Booth, E. S.: Calcium carbonate measurements in the surface global ocean based on Moderate-Resolution Imaging Spectroradiometer data, J. Geophys. Res., 110, doi:10.1029/2004JC002560, 2005.
Berelson, W. M., Balch, W. M., Najjar, R. G., Feely, R. A., Sabine,
C., and Lee, K.: Relating estimates of CaCO3production, export
and dissolution in the water column to measurements of CaCO3
rain into sediment traps and dissolution on the sea floor: A re-vised global carbonate budget, Global Biogeochem. Cy., 21, 15, doi:10.1029/2006GB002803, 2007.
Boyce, D. G., Lewis, M. R., and Worm, B.: Global phytoplankton decline over the past century, Nature, 466, 591–596, 2010. Brown, C. W. and Yoder, J. A.: Coccolithorid blooms in the global
ocean, J. Geophys. Res., 99, 7467–7482, 1994a.
Brown, C. W. and Yoder, J. A.: The distribution pattern of coc-colithophorid blooms in the western North Atlantic, Cont. Shelf Res., 14, 175–198, 1994b.
Buitenhuis, E., Van Bleijswijk, J., Bakker, D. C. E., and Veldhuis, M.: Trends in inorganic and organic carbon in a bloom of Emilia-nia huxleyi in the North Sea, Mar. Ecol. Prog. Ser., 143, 271–282, 1996.
Cokacar, T., Kubilay, N., and Oguz, T.: Structure ofEmiliania
hux-leyiblooms in the Black Sea surface waters as detected by
Sea-WiFS imagery, Geophys. Res. Lett., 28, 4607–4610, 2001. Dickson, A. G., Sabine, C., and Christian, J. R.: Guide to best
prac-tices for ocean CO2measurements, PICES Special Publication,
3, 1–191, 2007.
Frankignoulle, M. and Gattuso, J.-P.: A complete set of buffer
fac-tors for acid/base CO2system in seawater, J. Mar. Syst., 5, 111–
118, 1994.
Fromentin, J. M. and Planque, B.: Calanus and environment in the eastern North Atlantic. Influence of the North Atlantic Oscilla-tion on C. finmarchicus and C. helgolandicus, Mar. Ecol. Prog. Ser., 134, 111–118, 1996.
Gattuso, J.-P., Pichon, M., and Frankignoulle, M.: Biological
con-trol of air-sea CO2fluxes: Effect of photosynthetic and
calcify-ing marine organisms and ecosystems, Mar. Ecol. Prog. Ser., 129, 307–312, 1995.
Harlay, J., Borges, A. V., Van Der Zee, C., Delille, B., Godoi, R. H. M., Schiettecatte, L.-S., Roevros, N., Aerts, K., Lapernat, P.-E., Rebreanu, L., Groom, S. B., Daro, R., Van Grieken, M.-H., and Chou, L.: Biogeochemical study of a coccolithophorid bloom in the northern, Bay of Biscay (NE Atlantic Ocean) in June 2004, Prog. Oceanogr., 86, 317–336, 2010.
Holligan, P., Viollier, M., Harbour, D. S., Camus, P., and Champagne-Philippe, M.: Satellite and ship studies of coccol-ithophore production along a continental shelf edge, Nature, 304, 339–342, doi:10.1038/304339a0, 1983.
Holligan, P., Fernandez, E., Aiken, J. A., Balch, W. M., Boyd, P., Burkill, P. H., Finch, M., Groom, S. B., Malin, G., Muller, K., Purdie, D. A., Robinson, C., Trees, C., Turner, S. M., and Wal, P.
v. d.: A biogeochemical study of the coccolithophoreEmiliania
huxleyiin the North Atlantic, Global Biogeochem. Cy., 7, 879– 900, 1993.
Honjo, S., Manganini, S. J., Krishfield, R. A., and Francois, R.: Par-ticulate organic carbon fluxes to the ocean interior and factors controlling the biological pump: a synthesis of global sediment trap programs since 1983, Prog. Oceanogr., 76, 217–285, 2008. Hooker, S. B., Zibordi, G., Berthon, J.-F., A’Alimonte, D.,
Mari-torena, S., McLean, S., and Sildam, J.: Results of second SeaW-iFS Data Analysis Round Robin, March 2000 (DARR-00), Sea-WiFS Project Postlaunch Technical Report Series, 15, 75, 2001. Hurrell, J. W., Yochanan, K., and Visbeck, M.: The North Atlantic
Oscilation, Science, 291, 603–605, 2001.
Hurrell, J. W.: North Atlantic Oscillation data determined using Principal Component Analysis of sea-level pressure, http://www. cgd.ucar.edu/cas/jhurrell/, 2011.
Iglesias-Rodriguez, M. D., Brown, C. W., Doney, S. C., Kleypas, J., Kolber, D., Kolber, Z., Hayes, P. K., and Falkowski, P. G.: Rep-resenting key phytoplankton functional groups in ocean carbon cycle models: Coccolithophorids, Global Biogeochem. Cy., 16, 1100, doi:10.1029/2001GB001454, 2002.
Lavigne, H., and Gattuso, J.-P.: seacarb seawater carbonate chem-istry with R, http://CRAN.R-project.org/package=seacarb, 2011. Le Quere, C., Raupach, M. R., Canadell, J. G., Marland, G., Bopp, L., Ciais, P., Conway, T. J., Doney, S. C., Feely, R. A., Foster, P., Friedlingstein, P., Gurney, K., Houghton, R. A., House, J. I., Huntingford, C., Levy, P. E., Lomas, M. R., Majkut, J., Metzl, N., Ometto, J. P., Peters, G. P., Prentice, I. C., Randerson, J. T., Running, S. W., Sarmiento, J. L., Schuster, U., Sitch, S., Taka-hashi, T., Viovy, N., van der Werf, G. R., and Woodward, F. I.: Trends in the sources and sinks of carbon dioxide, Nat. Geosci., 2, 831–836, 2009.
Lee, K.: Global net community production estimated from the an-nual cycle of surface water total dissolved inorganic carbon, Lim-nol. Oceanogr., 46, 1287–1297, 2001.
Lefevre, N., Watson, A. J., Rios, A. F., Perez, F. F., and Johannessen,
T.: A decrease in the sink of atmospheric CO2 in the North
Atlantic, Geophys. Res. Lett., 31, doi:10.1029/2003GL018957, 2004.
McQuatters-Gollop, A., Burkill, P. H., Beaugrand, G., Johns, D. G., Gattuso, J.-P., and Edwards, M.: Atlas of Calcifying Plankton: Results from the North Atlantic Continuous Plankton Recorder survey, Sir Alister Hardy Foundation for Ocean Science, Ply-mouth, UK, 20 pp., 2010.
Merico, A., Tyrrell, T., Brown, C. W., Groom, S. B., and Miller,
P. I.: Analysis of satellite imagery forEmiliania huxleyiblooms
in the Bering Sea before 1997, Geophys. Res. Lett., 30, doi:10.1029/2002GL016648, 2003.
Mokhov, I. I., and Smirnov, D. A.: El Ni˜no–Southern Oscilla-tion drives North Atlantic OscillaOscilla-tion as revealed with nonlin-ear techniques from climatic indices, Geophys. Res. Lett., 33, doi:10.1029/2005GL024557, 2006.
Najjar, R. G., Jin, X., Louanchi, F., Aumont, O., Caldeira, K., Doney, S. C., Dutay, J.-C., Follows, M., Gruber, N., Joos, F., Lindsay, K., Maier-Reimer, E., Matear, R., Matsumoto, K., Mon-fray, P., Mouchet, A., Orr, J. C., Plattner, G.-K., Sarmiento, J. L., Schlitzer, R., Slater, R. D., Weirig, M.-F., Yamanaka, Y., and Yool, A.: Impact of circulation on export production, dis-solved organic matter, and disdis-solved oxygen in the ocen: Re-sults from Phase II of the Ocean Carbon-cycle Model Inter-comparison Project (OCMIP-2), Global Biogeochem. Cy., 21, doi:10.1029/2006GB002857, 2007.
NASA: Ocean colour biology group website, http://oceancolor.gsfc. nasa.gov/, 2010.
NOAA: Multivariate El Ni˜no/Southern Oscillation, http://www.esrl. noaa.gov/psd/enso/mei, 2011.
Purdie, D. A. and Finch, M. S.: Impact of a coccolithorid bloom on dissolved carbon dioxide in sea water enclosures in a Norwegian fjord, Sarsia, 79, doi:10.1080/00364827.1994.10413569, 1994. Raitsos, D. E., Lavender, S. J., Pradhan, Y., Tyrrell, T., Reid, P. C.,
and Edwards, M.: Coccolithophore bloom size variation in re-sponse to th regional environment of the subarctic North Atlantic, Liminol. Oceanogr., 51, 2122–2130, 2006.
Reid, P. C., Colebrook, J. M., Matthews, J. B. L., and Aiken, J.: The Continuous Plankton Recorder: concepts and history, from plankton indicator to undulating recorders, Prog. Oceanogr., 58, 117–173, 2003.
Ridgwell, A., Hargreaves, J. C., Edwards, N. R., Annan, J. D., Lenton, T. M., Marsh, R., Yool, A., and Watson, A.: Marine geo-chemical data assimilation in an efficient Earth System Model of global biogeochemical cycling, Biogeosciences, 4, 87–104, doi:10.5194/bg-4-87-2007, 2007.
Robertson, J. E., Robertson, C., Turner, D. R., Holligan, P., Watson, A. J., Boyd, P., Fernandez, E., and Finch, M.: The impact of a coccolithophore bloom on oceanic carbon uptake in the northeast Atlantic during summer 1991, Deep Sea Res. Pt. I, 41, 297–314, 1991.
Sabine, C. L., Feely, R. A., Gruber, N., Key, R. M., Lee, K., Bullis-ter, J. L., Wanninkhof, R., Wong, C. S., Wallace, D. W. R., Tilbrook, B., Millero, F. J., Peng, T. H., Hozyr, A., Ono, T., and
Rios, A. F.: The oceanic sink for anthropogenic CO2, Science,
305, 367–371, 2004.
Schuster, U. and Watson, A. J.: A variable and decreasing sink for
doi:10.1029/2006JC003941, 2007.
Shutler, J. D., Smyth, T. J., Land, P. E., and Groom, S. B.: A near-real time automatic MODIS data processing system, Int. J. Re-mote Sens., 26, 1049–1055, 2005.
Shutler, J. D., Grant, M. G., Miller, P. I., Rushton, E., and An-derson, K.: Coccolithophore bloom detection in the north east Atlantic using SeaWiFS: algorithm description, application and sensitivity analysis, Remote Sens. Environ., 114, 1008–1016, doi:10.1016/j.rse.2009.12.024, 2010.
Shutler, J. D., Smyth, T. J., Saux-Picart, S., Wakelin, S. L., Hyder, P., Orekhov, P., Grant, M. G., Tilstone, G. H., and Allen, J. I.: Evaluating the ability of a hydrodynamic ecosystem model to capture inter- and intra-annual spatial characteristics of chlorophyll-a in the north east Atlantic, J. Mar. Syst., 88, 169– 182, doi:10.1016/j.jmarsys.2011.03.013, 2011.
Smyth, T. J., Tyrrell, T., and Tarrant, B.: Time series of coccolithophore activity in the Barents Sea from twenty
years of satellite imagery, Geophys. Res. Lett., 31,
doi:10.1029/2004GL019735, 2004.
Suykens, K., Delille, B., Chou, L., De Bodt, C., Harlay J., and Borges, A. V.: Dissolved inorganic carbon dynamics and air-sea carbon dioxide fluxes during coccolithophore blooms in the northwest European continental margin (northern Bay of Bis-cay), Global Biogeochem. Cy., 24, doi:10.1029/2009GB003730, 2010.
Takahashi, T., Sutherland, S. C., Wanninkhof, R., Sweeney, C., Feely, R. A., Chipman, D. W., Burke Hales, B., Friederich, G., Chavez, F., Watson, A. J., Bakker, D. C. E., Schuster, U., Metzl, N., Yoshikawa-Inoue, H., Ishii, M., Midorikawa, T., Sabine, C., Hoppema, J. M. J., Olafsson, J., Arnarson, T. S., Tilbrook, B., Johannessen, T., Olsen, A., Bellerby, R., Baar, H. J. W. d., No-jiri, Y., Wong, C. S., and Delille, B.: Climatological mean and
decadal change in surface oceanpCO2and net sea-air CO2flux
over the global oceans, Deep Sea Res. Pt. II, 56, 554–577, 2009.
Taylor, J. R.: An introduction to Error Analysis; the study of un-certainties in physical measurements, in, Second ed., edited by: McGuire, A., University Science Books, 1997.
Tyrrell, T., Holligan, P., and Mobley, C. D.: Optical impacts of oceanic coccolithophore blooms, J. Geophys. Res., 104, 3223– 3241, 1999.
Tyrrell, T. and Merico, A.:Emiliania huxleyi: Bloom observations
and the conditions that induce them, in: Coccolithophores: from Molecular processes to global impact, edited by: Thiertein, H. R., and Young, J. R., Springer-Verlag, 2004.
Wakelin, S., Holt, J. T., Blackford, J., Allen, J. I., Butenschon, M., and Artioli, Y.: Modeling the carbon fluxes of the Northwest Eu-ropean Continential Shelf: validation and budgets, J. Geophys. Res., doi:10.1029/2011JC007402, 2012.
Watson, A. J., Schuster, U., Bakker, D. C. E., Bates, N. R., Corbiere, A., Gonzalez-Davila, M., Friedrich, T., Hauck, J., Heinze, C., Johannessen, T., Kortzinger, A., Metzl, N., Olafsson, J., Olsen, A., Oschlies, A., Padin, X. A., Pfeil, B., Santana-Casiano, J. M., Steinhoff, T., Telszewski, M., Rios, A. F., Wallace, D. W. R., and Wanninkhof, R.: Tracking the Variable North Atlantic Sink for
Atmospheric CO2, Science, 326, 1391–1393, 2009.
Yool, A., Popova, E. E., and Andersen, T. R.: Medusa-1.0:a new in-termediate complexity plankton ecosystem model for the global domain, Geosci. Model Develop., 4, 381–417, doi:10.5194/gmd-4-381-2011, 2011.
Zeebe, R. E. and Wolf-Gladrow, D. A.: CO2in seawater: